SIT718 - Stochastic Modelling for Share Price Analysis - Task 2
VerifiedAdded on 2023/05/29
|10
|612
|213
Report
AI Summary
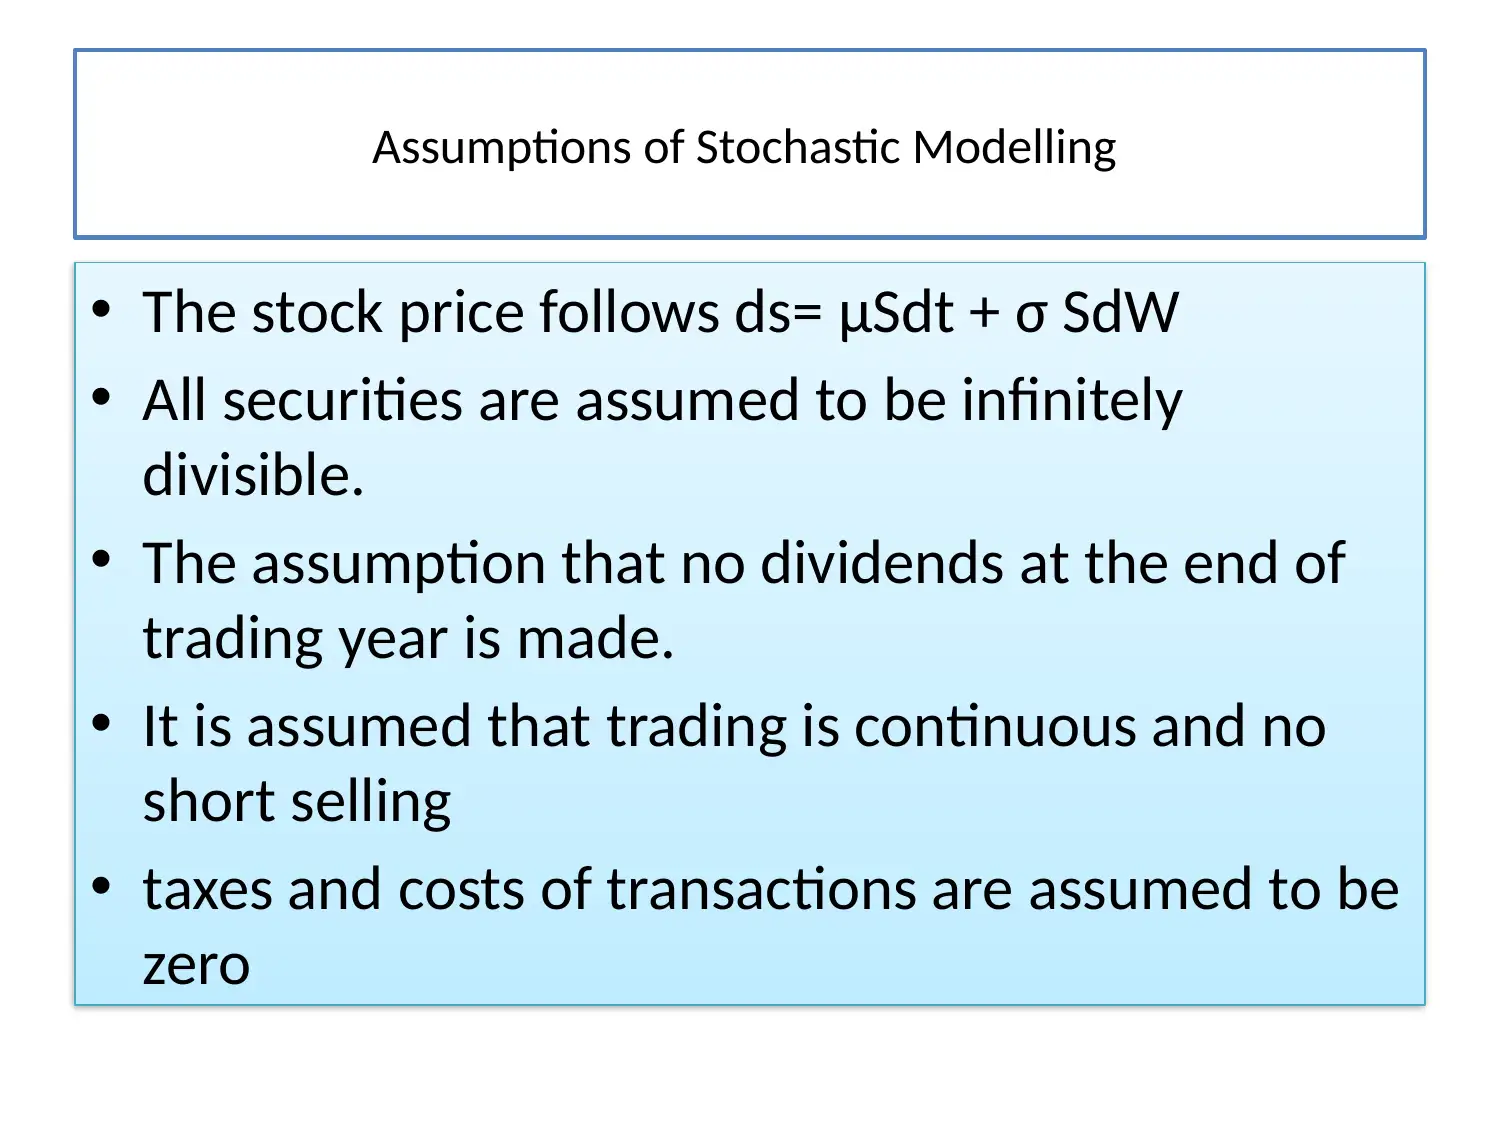
This report analyzes share prices using stochastic modeling, specifically focusing on Geometric Brownian Motion (GBM). It discusses the assumptions underlying stochastic modeling, including the divisibility of securities, continuous trading, and the absence of transaction costs. The report then presents a time series plot for BP share prices and examines the limitations of GBM, such as the assumption of log-normally distributed returns and the Markov process. It also highlights that GBM assumes the company is a going concern and its stock prices are continuous in time. The analysis includes a drift and volatility table for BP share prices. This document is available on Desklib, a platform offering a range of study tools and resources for students.


1 out of 10
Related Documents


Your All-in-One AI-Powered Toolkit for Academic Success.
+13062052269
info@desklib.com
Available 24*7 on WhatsApp / Email
![[object Object]](/_next/static/media/star-bottom.7253800d.svg)
Copyright © 2020–2026 A2Z Services. All Rights Reserved. Developed and managed by ZUCOL.