Characteristics of Sine Wave and Phasor Diagrams
Added on 2022-10-14
17 Pages2782 Words387 Views
Task 1
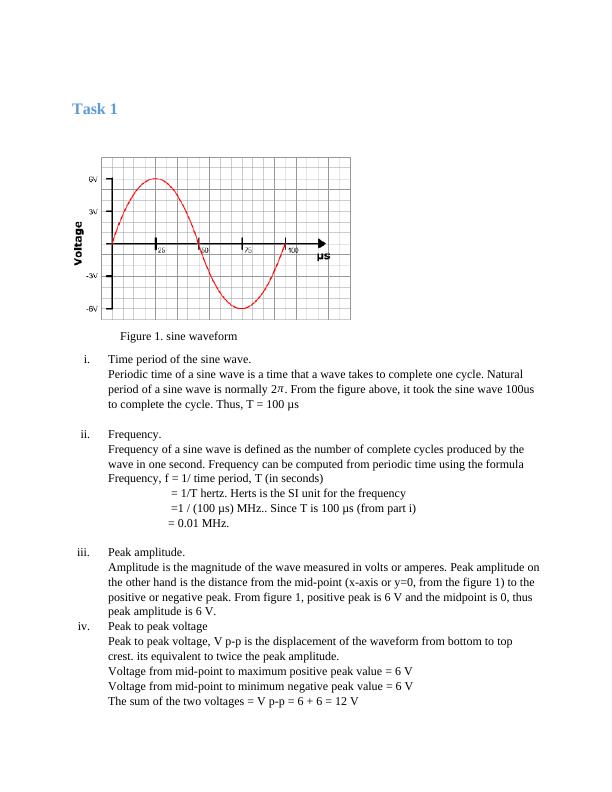
Figure 1. sine waveform
i. Time period of the sine wave.
Periodic time of a sine wave is a time that a wave takes to complete one cycle. Natural
period of a sine wave is normally 2 π. From the figure above, it took the sine wave 100us
to complete the cycle. Thus, T = 100 μs
ii. Frequency.
Frequency of a sine wave is defined as the number of complete cycles produced by the
wave in one second. Frequency can be computed from periodic time using the formula
Frequency, f = 1/ time period, T (in seconds)
= 1/T hertz. Herts is the SI unit for the frequency
=1 / (100 μs) MHz.. Since T is 100 μs (from part i)
= 0.01 MHz.
iii. Peak amplitude.
Amplitude is the magnitude of the wave measured in volts or amperes. Peak amplitude on
the other hand is the distance from the mid-point (x-axis or y=0, from the figure 1) to the
positive or negative peak. From figure 1, positive peak is 6 V and the midpoint is 0, thus
peak amplitude is 6 V.
iv. Peak to peak voltage
Peak to peak voltage, V p-p is the displacement of the waveform from bottom to top
crest. its equivalent to twice the peak amplitude.
Voltage from mid-point to maximum positive peak value = 6 V
Voltage from mid-point to minimum negative peak value = 6 V
The sum of the two voltages = V p-p = 6 + 6 = 12 V
v. RMS voltage
For pure sinusoidal waveform RMS voltage is calculated by multiplying 1/√ 2 by
maximum peak voltage.
RMS voltage, VRMS = 1/√ 2 * peak amplitude
= 1/√ 2 * 6 V
= 0.707 * 6 V
= 4.242 V
Figure 2 below gives a summary of voltage values described in the solutions above.
Figure 2: characteristics of sine wave from Learnabout Electronics,
http://www.learnabout-electronics.org/ac_theory/ac_waves02.php accessed
July 30, 2019
Task 2
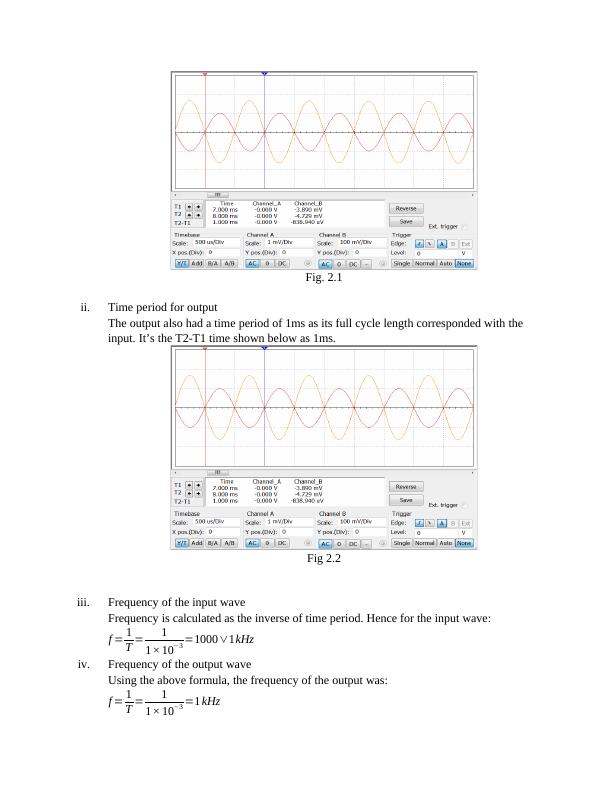
i. Time period for input
The input was the waveform with smaller amplitude which was observed on channel A.
This was measured using the oscilloscope by setting the red cursor to a point of y=0 and
then also setting the blue cursor at a point y=0 exactly at the end of one period. The time
period is shown by the T2-T1 time on the oscilloscope which is 1.00ms.
For pure sinusoidal waveform RMS voltage is calculated by multiplying 1/√ 2 by
maximum peak voltage.
RMS voltage, VRMS = 1/√ 2 * peak amplitude
= 1/√ 2 * 6 V
= 0.707 * 6 V
= 4.242 V
Figure 2 below gives a summary of voltage values described in the solutions above.
Figure 2: characteristics of sine wave from Learnabout Electronics,
http://www.learnabout-electronics.org/ac_theory/ac_waves02.php accessed
July 30, 2019
Task 2
i. Time period for input
The input was the waveform with smaller amplitude which was observed on channel A.
This was measured using the oscilloscope by setting the red cursor to a point of y=0 and
then also setting the blue cursor at a point y=0 exactly at the end of one period. The time
period is shown by the T2-T1 time on the oscilloscope which is 1.00ms.
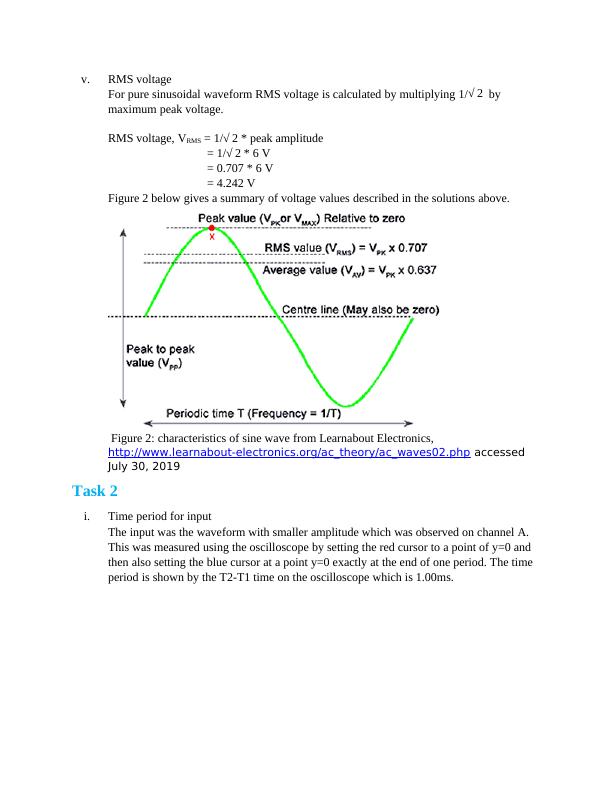
Fig. 2.1
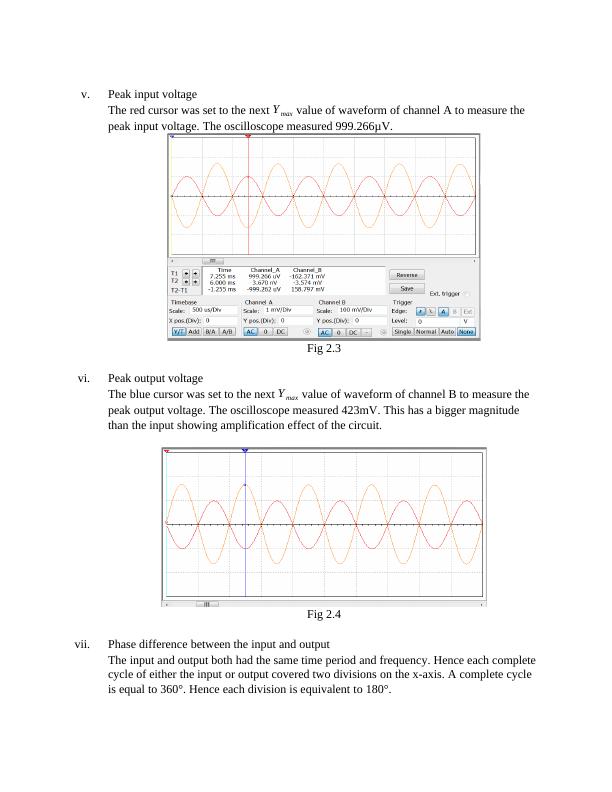
ii. Time period for output
The output also had a time period of 1ms as its full cycle length corresponded with the
input. It’s the T2-T1 time shown below as 1ms.
Fig 2.2
iii. Frequency of the input wave
Frequency is calculated as the inverse of time period. Hence for the input wave:
f = 1
T = 1
1× 10−3 =1000∨1kHz
iv. Frequency of the output wave
Using the above formula, the frequency of the output was:
f = 1
T = 1
1× 10−3 =1 kHz
v. Peak input voltage
The red cursor was set to the next Y max value of waveform of channel A to measure the
peak input voltage. The oscilloscope measured 999.266μV.
Fig 2.3
vi. Peak output voltage
The blue cursor was set to the next Y max value of waveform of channel B to measure the
peak output voltage. The oscilloscope measured 423mV. This has a bigger magnitude
than the input showing amplification effect of the circuit.
Fig 2.4
vii. Phase difference between the input and output
The input and output both had the same time period and frequency. Hence each complete
cycle of either the input or output covered two divisions on the x-axis. A complete cycle
is equal to 360°. Hence each division is equivalent to 180°.
End of preview
Want to access all the pages? Upload your documents or become a member.
Related Documents
Introduction to Circuit Analysis - Assignmentlg...
|9
|906
|167
Understanding Sinusoidal Functions and Phasor Representationlg...
|13
|1732
|20
BTEC 90 Credit Diploma in Engineeringlg...
|11
|1078
|206
Performance of Electrocardiogramlg...
|7
|1053
|87
Electrical & Electronic Control Question & Answerslg...
|16
|978
|166
Synthesis of Sinusoidal Signals-MUS Signal Processing Lab 04lg...
|12
|2092
|491