The Effect of Tax Avoidance on Firm Risk in the UK
VerifiedAdded on 2023/06/07
|19
|5289
|50
AI Summary
This study analyzes the impact of tax avoidance on firm risk in the UK through statistical analysis of data from 100 listed companies. The findings reveal correlations between GAAP ETR, Cash ETR, BTD, Tobin’s Q ratio, firm size, fixed assets, ROA, Debt, Leverage and NOL. Descriptive statistics, correlation, regression, ANOVA test and frequencies have been used to determine the degree of relationship among the variables of interest. The study concludes that tax avoidance measures such as GAAP ETR and BTD carry a risk factor for the firm in terms of affecting their stock returns.
Contribute Materials
Your contribution can guide someone’s learning journey. Share your
documents today.
The effect of tax avoidance on
firm risk in the UK
firm risk in the UK
Secure Best Marks with AI Grader
Need help grading? Try our AI Grader for instant feedback on your assignments.

Table of Contents
FINDINGS & ANALYSIS..............................................................................................................3
REFERENCES..............................................................................................................................17
Books and Journals....................................................................................................................17
FINDINGS & ANALYSIS
In this chapter, the findings have been presented through the analysis of data pertaining to 100
listed companies. The findings have been obtained through the application of various statistical
tools and tests, which includes the following:
Descriptive statistics: Through descriptive statistics the characteristics or nature of data set have
been determined through generating the summary of the data set so that, better understanding
could be developed for further analysis and identification of relationship among the variables.
Through this statistical tool, the averages have been calculated for each & every variable along
with identification of how data set are deviating from the mean.
Correlation: This statistical tool will be used to determine the degree of relationship existing
among the variables of interest such as GAAP ETR, Cash ETR, BTD, Tobin’s Q ratio (stock
return), firm size, fixed assets, ROA, Debt, Leverage and NOL. This will be done to determine to
what extent does each of the variable can affect the Tobin’s Q ratio of the firm.
Regression: This statistical method will be applied to determine the character and strength of
relationship existing among a single dependent variable (Tobin’s Q ratio) and several other
variables which includes both independent & controlled variables such as Cash ETR, GAAP
ETR, BTD, firm size, etc.
ANOVA test: As the group of data involves more than three variables, the one – way ANOVA
test will be applied to determine whether there is any statistical significance lies between the
independent and dependent variable. In other words, whether independent or controlled variables
either in a group or individually affect the Tobin’s Q of the firm.
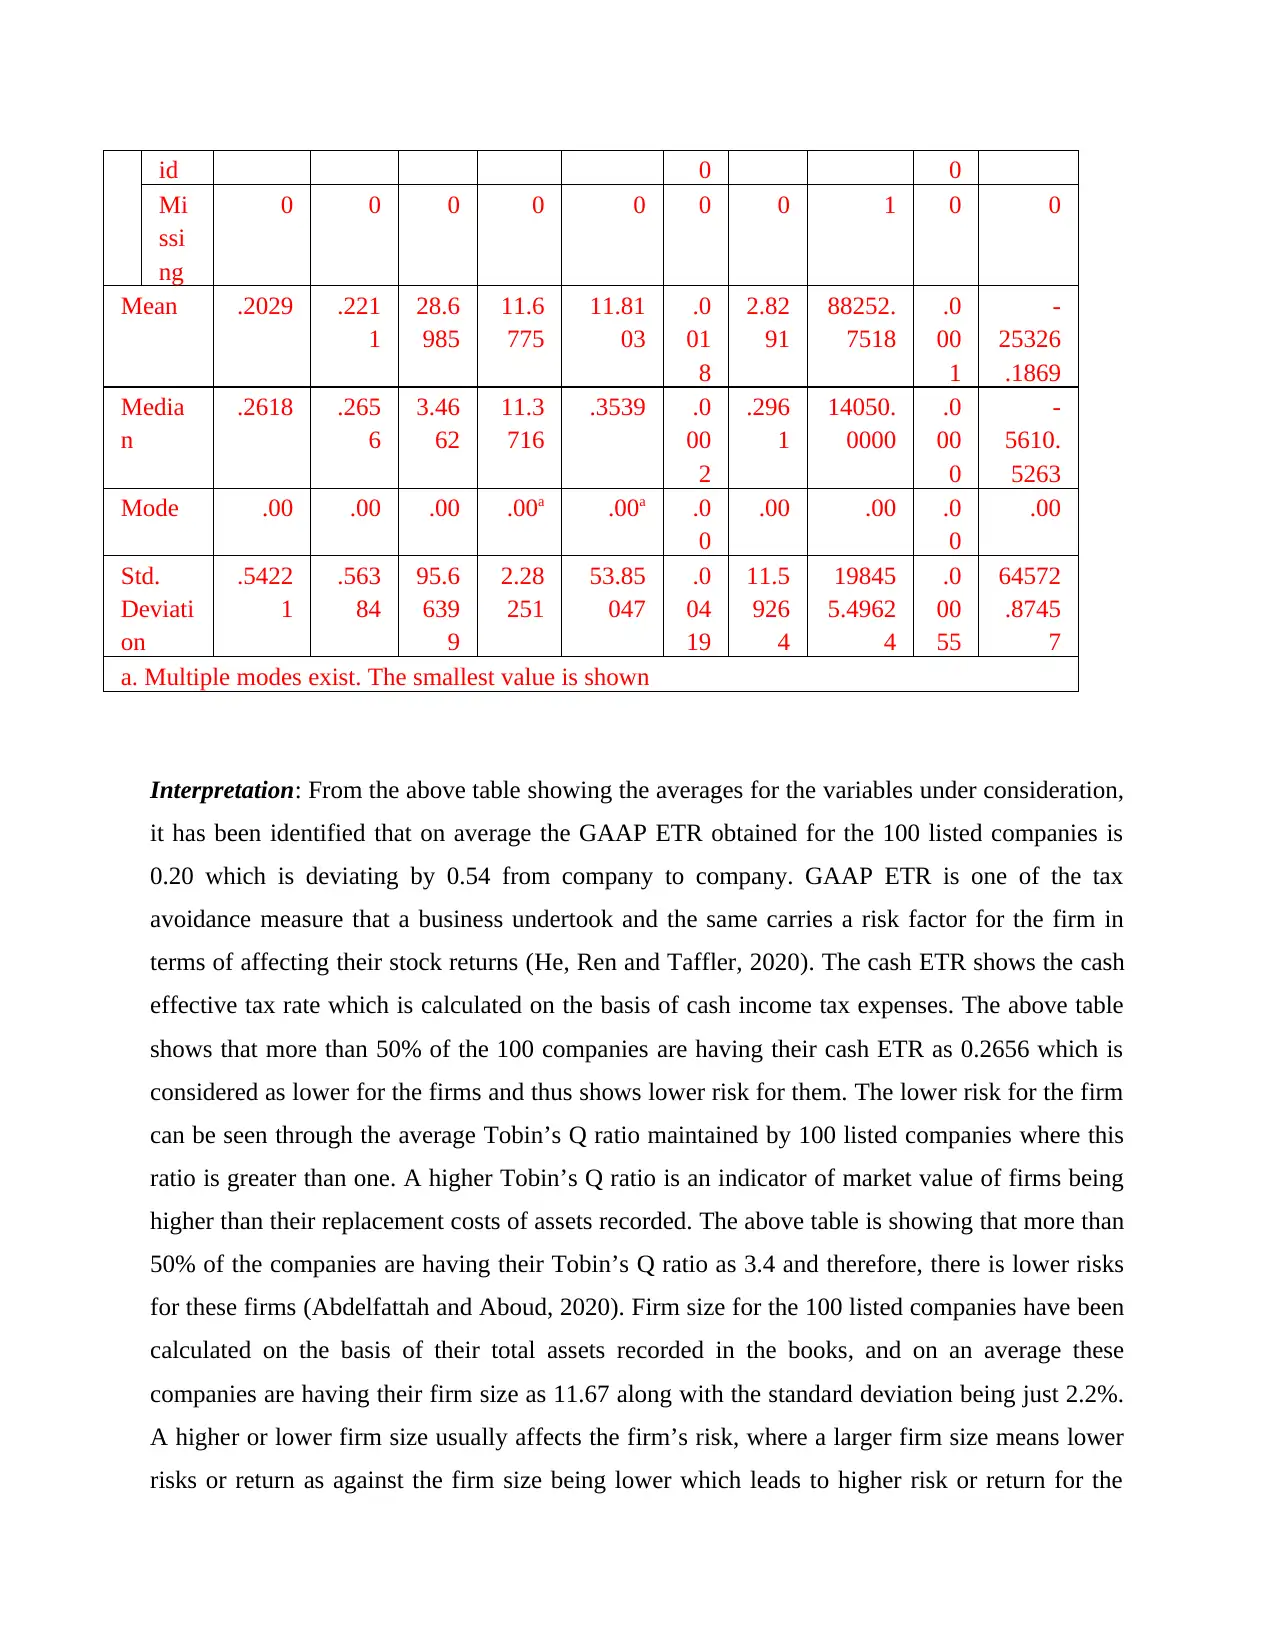
Frequencies
Statistics
GAA
P_ET
R
Cash
_ET
R
Tob
in_
Q
Firm
_Siz
e
Fixed
_Asse
ts
R
O
A
Deb
t
Levera
ge
N
O
L
BTD
N Val 100 100 100 100 100 10 100 99 10 100
In this chapter, the findings have been presented through the analysis of data pertaining to 100
listed companies. The findings have been obtained through the application of various statistical
tools and tests, which includes the following:
Descriptive statistics: Through descriptive statistics the characteristics or nature of data set have
been determined through generating the summary of the data set so that, better understanding
could be developed for further analysis and identification of relationship among the variables.
Through this statistical tool, the averages have been calculated for each & every variable along
with identification of how data set are deviating from the mean.
Correlation: This statistical tool will be used to determine the degree of relationship existing
among the variables of interest such as GAAP ETR, Cash ETR, BTD, Tobin’s Q ratio (stock
return), firm size, fixed assets, ROA, Debt, Leverage and NOL. This will be done to determine to
what extent does each of the variable can affect the Tobin’s Q ratio of the firm.
Regression: This statistical method will be applied to determine the character and strength of
relationship existing among a single dependent variable (Tobin’s Q ratio) and several other
variables which includes both independent & controlled variables such as Cash ETR, GAAP
ETR, BTD, firm size, etc.
ANOVA test: As the group of data involves more than three variables, the one – way ANOVA
test will be applied to determine whether there is any statistical significance lies between the
independent and dependent variable. In other words, whether independent or controlled variables
either in a group or individually affect the Tobin’s Q of the firm.
Frequencies
Statistics
GAA
P_ET
R
Cash
_ET
R
Tob
in_
Q
Firm
_Siz
e
Fixed
_Asse
ts
R
O
A
Deb
t
Levera
ge
N
O
L
BTD
N Val 100 100 100 100 100 10 100 99 10 100
id 0 0
Mi
ssi
ng
0 0 0 0 0 0 0 1 0 0
Mean .2029 .221
1
28.6
985
11.6
775
11.81
03
.0
01
8
2.82
91
88252.
7518
.0
00
1
-
25326
.1869
Media
n
.2618 .265
6
3.46
62
11.3
716
.3539 .0
00
2
.296
1
14050.
0000
.0
00
0
-
5610.
5263
Mode .00 .00 .00 .00a .00a .0
0
.00 .00 .0
0
.00
Std.
Deviati
on
.5422
1
.563
84
95.6
639
9
2.28
251
53.85
047
.0
04
19
11.5
926
4
19845
5.4962
4
.0
00
55
64572
.8745
7
a. Multiple modes exist. The smallest value is shown
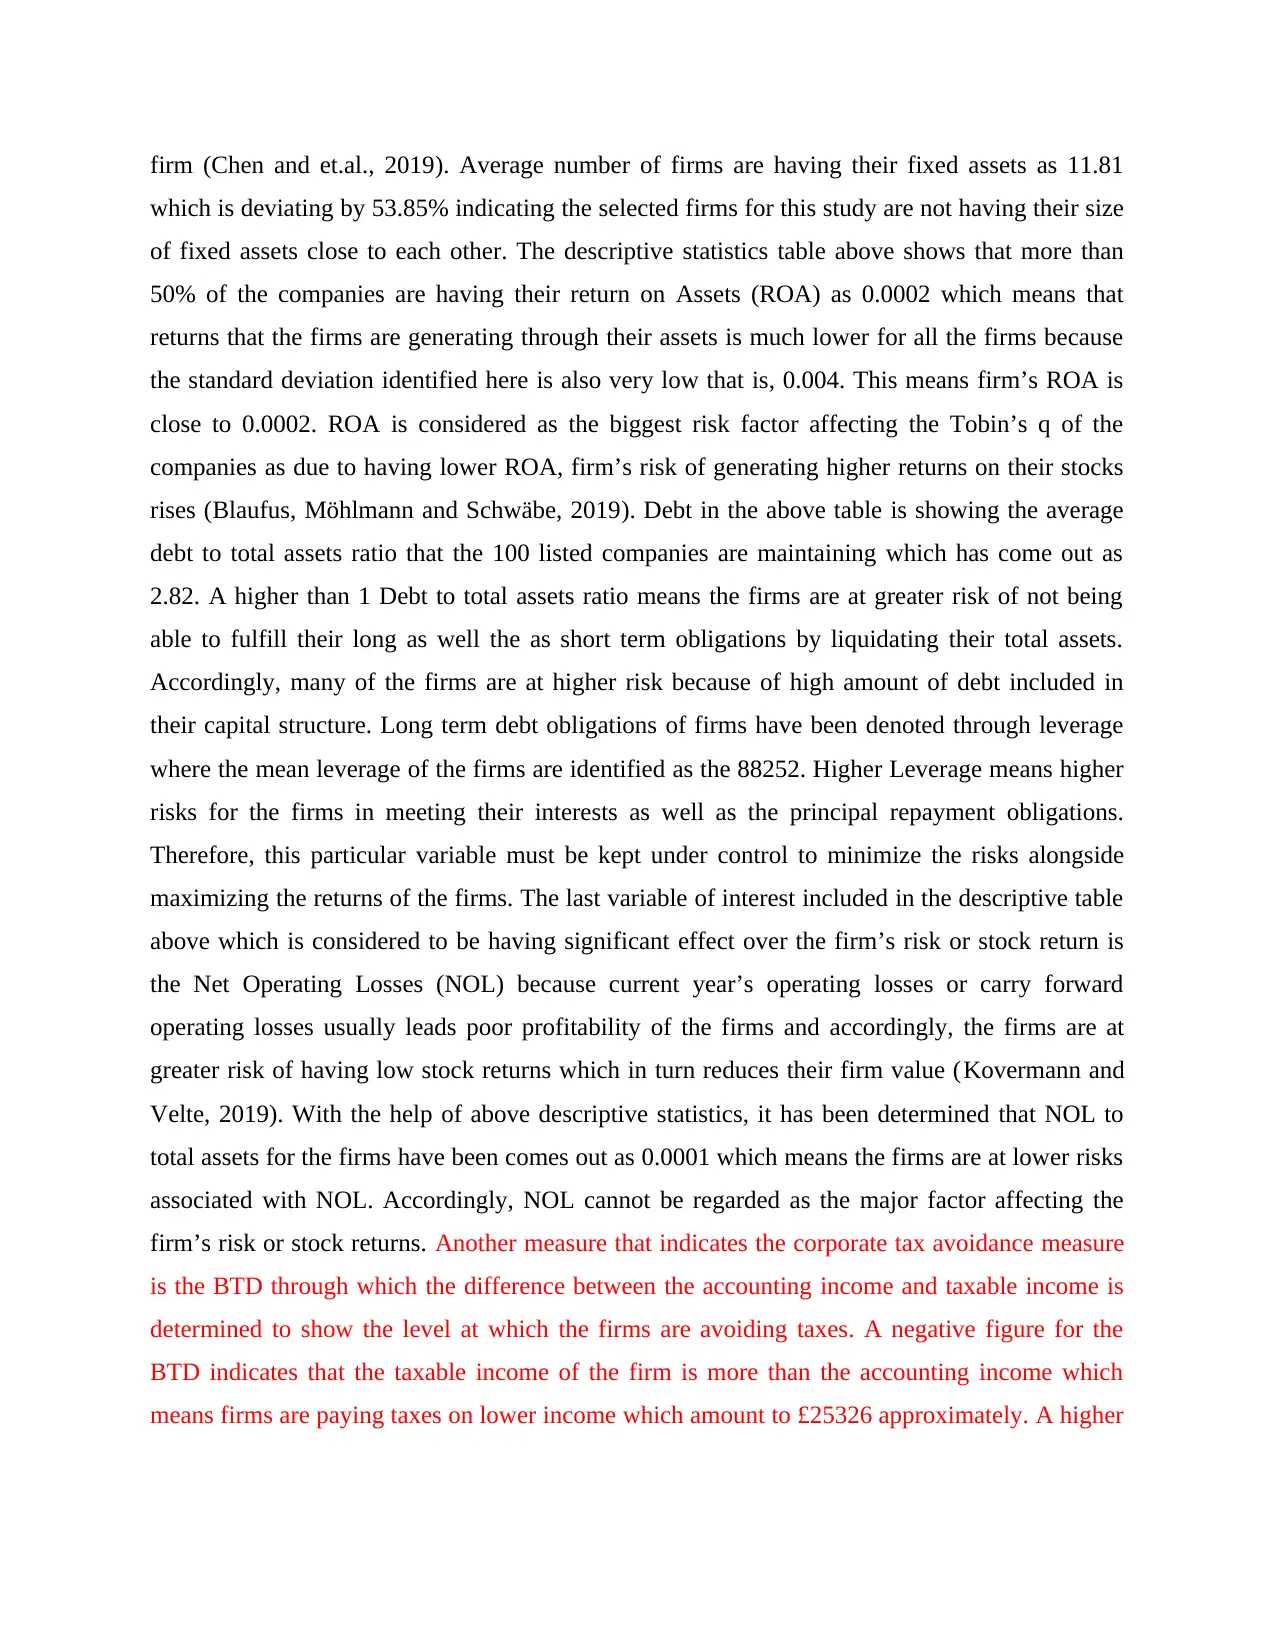
Interpretation: From the above table showing the averages for the variables under consideration,
it has been identified that on average the GAAP ETR obtained for the 100 listed companies is
0.20 which is deviating by 0.54 from company to company. GAAP ETR is one of the tax
avoidance measure that a business undertook and the same carries a risk factor for the firm in
terms of affecting their stock returns (He, Ren and Taffler, 2020). The cash ETR shows the cash
effective tax rate which is calculated on the basis of cash income tax expenses. The above table
shows that more than 50% of the 100 companies are having their cash ETR as 0.2656 which is
considered as lower for the firms and thus shows lower risk for them. The lower risk for the firm
can be seen through the average Tobin’s Q ratio maintained by 100 listed companies where this
ratio is greater than one. A higher Tobin’s Q ratio is an indicator of market value of firms being
higher than their replacement costs of assets recorded. The above table is showing that more than
50% of the companies are having their Tobin’s Q ratio as 3.4 and therefore, there is lower risks
for these firms (Abdelfattah and Aboud, 2020). Firm size for the 100 listed companies have been
calculated on the basis of their total assets recorded in the books, and on an average these
companies are having their firm size as 11.67 along with the standard deviation being just 2.2%.
A higher or lower firm size usually affects the firm’s risk, where a larger firm size means lower
risks or return as against the firm size being lower which leads to higher risk or return for the
Mi
ssi
ng
0 0 0 0 0 0 0 1 0 0
Mean .2029 .221
1
28.6
985
11.6
775
11.81
03
.0
01
8
2.82
91
88252.
7518
.0
00
1
-
25326
.1869
Media
n
.2618 .265
6
3.46
62
11.3
716
.3539 .0
00
2
.296
1
14050.
0000
.0
00
0
-
5610.
5263
Mode .00 .00 .00 .00a .00a .0
0
.00 .00 .0
0
.00
Std.
Deviati
on
.5422
1
.563
84
95.6
639
9
2.28
251
53.85
047
.0
04
19
11.5
926
4
19845
5.4962
4
.0
00
55
64572
.8745
7
a. Multiple modes exist. The smallest value is shown
Interpretation: From the above table showing the averages for the variables under consideration,
it has been identified that on average the GAAP ETR obtained for the 100 listed companies is
0.20 which is deviating by 0.54 from company to company. GAAP ETR is one of the tax
avoidance measure that a business undertook and the same carries a risk factor for the firm in
terms of affecting their stock returns (He, Ren and Taffler, 2020). The cash ETR shows the cash
effective tax rate which is calculated on the basis of cash income tax expenses. The above table
shows that more than 50% of the 100 companies are having their cash ETR as 0.2656 which is
considered as lower for the firms and thus shows lower risk for them. The lower risk for the firm
can be seen through the average Tobin’s Q ratio maintained by 100 listed companies where this
ratio is greater than one. A higher Tobin’s Q ratio is an indicator of market value of firms being
higher than their replacement costs of assets recorded. The above table is showing that more than
50% of the companies are having their Tobin’s Q ratio as 3.4 and therefore, there is lower risks
for these firms (Abdelfattah and Aboud, 2020). Firm size for the 100 listed companies have been
calculated on the basis of their total assets recorded in the books, and on an average these
companies are having their firm size as 11.67 along with the standard deviation being just 2.2%.
A higher or lower firm size usually affects the firm’s risk, where a larger firm size means lower
risks or return as against the firm size being lower which leads to higher risk or return for the
Secure Best Marks with AI Grader
Need help grading? Try our AI Grader for instant feedback on your assignments.
firm (Chen and et.al., 2019). Average number of firms are having their fixed assets as 11.81
which is deviating by 53.85% indicating the selected firms for this study are not having their size
of fixed assets close to each other. The descriptive statistics table above shows that more than
50% of the companies are having their return on Assets (ROA) as 0.0002 which means that
returns that the firms are generating through their assets is much lower for all the firms because
the standard deviation identified here is also very low that is, 0.004. This means firm’s ROA is
close to 0.0002. ROA is considered as the biggest risk factor affecting the Tobin’s q of the
companies as due to having lower ROA, firm’s risk of generating higher returns on their stocks
rises (Blaufus, Möhlmann and Schwäbe, 2019). Debt in the above table is showing the average
debt to total assets ratio that the 100 listed companies are maintaining which has come out as
2.82. A higher than 1 Debt to total assets ratio means the firms are at greater risk of not being
able to fulfill their long as well the as short term obligations by liquidating their total assets.
Accordingly, many of the firms are at higher risk because of high amount of debt included in
their capital structure. Long term debt obligations of firms have been denoted through leverage
where the mean leverage of the firms are identified as the 88252. Higher Leverage means higher
risks for the firms in meeting their interests as well as the principal repayment obligations.
Therefore, this particular variable must be kept under control to minimize the risks alongside
maximizing the returns of the firms. The last variable of interest included in the descriptive table
above which is considered to be having significant effect over the firm’s risk or stock return is
the Net Operating Losses (NOL) because current year’s operating losses or carry forward
operating losses usually leads poor profitability of the firms and accordingly, the firms are at
greater risk of having low stock returns which in turn reduces their firm value (Kovermann and
Velte, 2019). With the help of above descriptive statistics, it has been determined that NOL to
total assets for the firms have been comes out as 0.0001 which means the firms are at lower risks
associated with NOL. Accordingly, NOL cannot be regarded as the major factor affecting the
firm’s risk or stock returns. Another measure that indicates the corporate tax avoidance measure
is the BTD through which the difference between the accounting income and taxable income is
determined to show the level at which the firms are avoiding taxes. A negative figure for the
BTD indicates that the taxable income of the firm is more than the accounting income which
means firms are paying taxes on lower income which amount to £25326 approximately. A higher
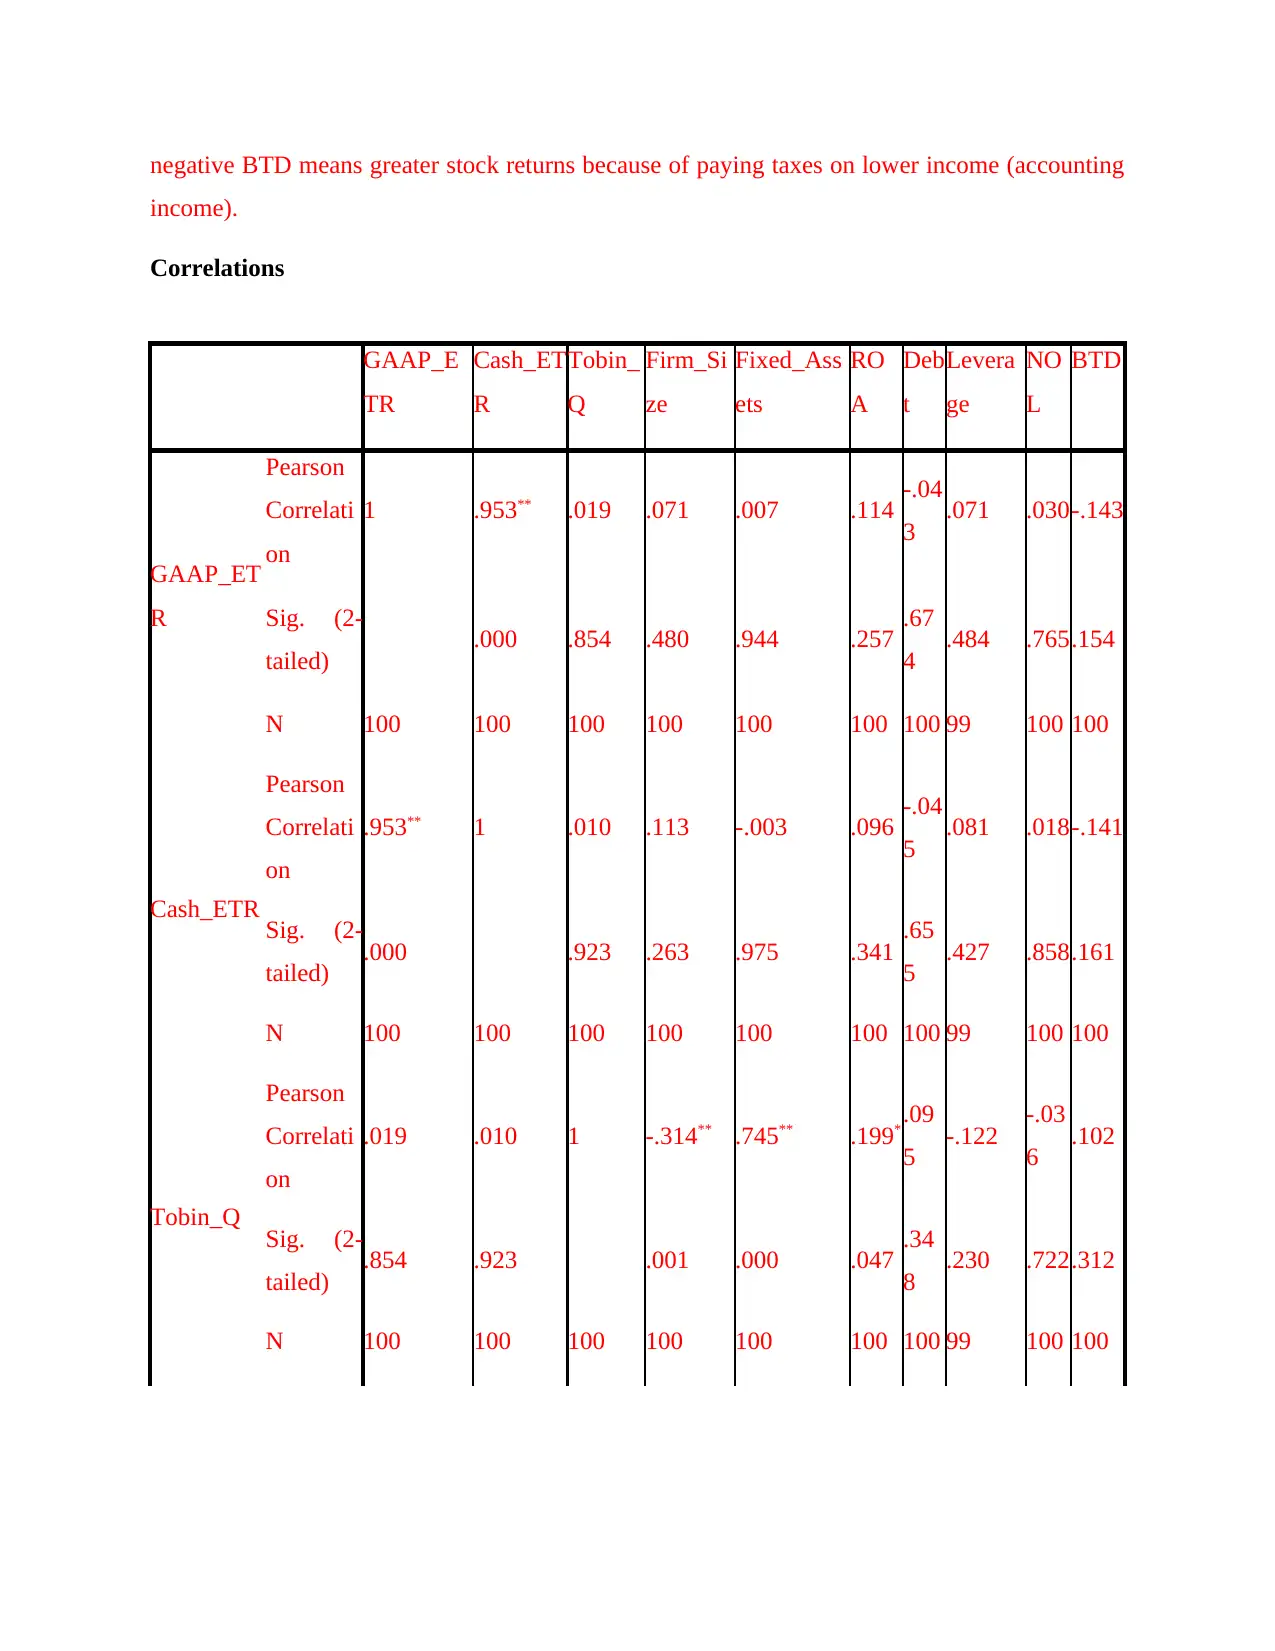
negative BTD means greater stock returns because of paying taxes on lower income (accounting
income).
Correlations
GAAP_E
TR
Cash_ET
R
Tobin_
Q
Firm_Si
ze
Fixed_Ass
ets
RO
A
Deb
t
Levera
ge
NO
L
BTD
GAAP_ET
R
Pearson
Correlati
on
1 .953** .019 .071 .007 .114 -.04
3 .071 .030-.143
Sig. (2-
tailed) .000 .854 .480 .944 .257 .67
4 .484 .765.154
N 100 100 100 100 100 100 100 99 100 100
Cash_ETR
Pearson
Correlati
on
.953** 1 .010 .113 -.003 .096 -.04
5 .081 .018-.141
Sig. (2-
tailed) .000 .923 .263 .975 .341 .65
5 .427 .858.161
N 100 100 100 100 100 100 100 99 100 100
Tobin_Q
Pearson
Correlati
on
.019 .010 1 -.314** .745** .199* .09
5 -.122 -.03
6 .102
Sig. (2-
tailed) .854 .923 .001 .000 .047 .34
8 .230 .722.312
N 100 100 100 100 100 100 100 99 100 100
Firm_Size
Pearson
Correlati
on
.071 .113 -.314** 1 -.321** -.327
**
-.17
4 .610** -.07
0
-.434
**
Sig. (2-
tailed) .480 .263 .001 .001 .001 .08
4 .000 .488.000
N 100 100 100 100 100 100 100 99 100 100
Fixed_Ass
ets
Pearson
Correlati
on
.007 -.003 .745** -.321** 1 .030 .06
3 -.094 -.02
5 .078
Sig. (2-
tailed) .944 .975 .000 .001 .768 .53
6 .352 .803.443
N 100 100 100 100 100 100 100 99 100 100
ROA
Pearson
Correlati
on
.114 .096 .199* -.327** .030 1 -.00
9 -.175 .128.143
Sig. (2-
tailed) .257 .341 .047 .001 .768 .92
8 .083 .205.156
N 100 100 100 100 100 100 100 99 100 100
Debt
Pearson
Correlati
on
-.043 -.045 .095 -.174 .063 -.0091 -.096 -.01
1 .075
Sig. (2-
tailed) .674 .655 .348 .084 .536 .928 .346 .914.459
N 100 100 100 100 100 100 100 99 100 100
Pearson
Correlati
on
.071 .113 -.314** 1 -.321** -.327
**
-.17
4 .610** -.07
0
-.434
**
Sig. (2-
tailed) .480 .263 .001 .001 .001 .08
4 .000 .488.000
N 100 100 100 100 100 100 100 99 100 100
Fixed_Ass
ets
Pearson
Correlati
on
.007 -.003 .745** -.321** 1 .030 .06
3 -.094 -.02
5 .078
Sig. (2-
tailed) .944 .975 .000 .001 .768 .53
6 .352 .803.443
N 100 100 100 100 100 100 100 99 100 100
ROA
Pearson
Correlati
on
.114 .096 .199* -.327** .030 1 -.00
9 -.175 .128.143
Sig. (2-
tailed) .257 .341 .047 .001 .768 .92
8 .083 .205.156
N 100 100 100 100 100 100 100 99 100 100
Debt
Pearson
Correlati
on
-.043 -.045 .095 -.174 .063 -.0091 -.096 -.01
1 .075
Sig. (2-
tailed) .674 .655 .348 .084 .536 .928 .346 .914.459
N 100 100 100 100 100 100 100 99 100 100
Paraphrase This Document
Need a fresh take? Get an instant paraphrase of this document with our AI Paraphraser
Leverage
Pearson
Correlati
on
.071 .081 -.122 .610** -.094 -.175-.09
6 1 -.06
8
-.565
**
Sig. (2-
tailed) .484 .427 .230 .000 .352 .083 .34
6 .507.000
N 99 99 99 99 99 99 99 99 99 99
NOL
Pearson
Correlati
on
.030 .018 -.036 -.070 -.025 .128 -.01
1 -.068 1 .057
Sig. (2-
tailed) .765 .858 .722 .488 .803 .205 .91
4 .507 .575
N 100 100 100 100 100 100 100 99 100 100
BTD
Pearson
Correlati
on
-.143 -.141 .102 -.434** .078 .143 .07
5 -.565** .0571
Sig. (2-
tailed) .154 .161 .312 .000 .443 .156 .45
9 .000 .575
N 100 100 100 100 100 100 100 99 100 100
**. Correlation is significant at the 0.01 level (2-tailed).
*. Correlation is significant at the 0.05 level (2-tailed).
Interpretation: On the basis of above correlation table, it is interpreted that GAAP ETR
is weakly correlated with the Tobin’s q ratio (stock return) of the 100 listed companies as the
correlation value is far to +1. This indicate that there is strong correlation between the GAAP
ETR (independent variable) and Tobin’s q ratio (dependent variable) of the companies. The
correlation value of 0.010 between the independent variable (Cash ETR) and dependent variable
Pearson
Correlati
on
.071 .081 -.122 .610** -.094 -.175-.09
6 1 -.06
8
-.565
**
Sig. (2-
tailed) .484 .427 .230 .000 .352 .083 .34
6 .507.000
N 99 99 99 99 99 99 99 99 99 99
NOL
Pearson
Correlati
on
.030 .018 -.036 -.070 -.025 .128 -.01
1 -.068 1 .057
Sig. (2-
tailed) .765 .858 .722 .488 .803 .205 .91
4 .507 .575
N 100 100 100 100 100 100 100 99 100 100
BTD
Pearson
Correlati
on
-.143 -.141 .102 -.434** .078 .143 .07
5 -.565** .0571
Sig. (2-
tailed) .154 .161 .312 .000 .443 .156 .45
9 .000 .575
N 100 100 100 100 100 100 100 99 100 100
**. Correlation is significant at the 0.01 level (2-tailed).
*. Correlation is significant at the 0.05 level (2-tailed).
Interpretation: On the basis of above correlation table, it is interpreted that GAAP ETR
is weakly correlated with the Tobin’s q ratio (stock return) of the 100 listed companies as the
correlation value is far to +1. This indicate that there is strong correlation between the GAAP
ETR (independent variable) and Tobin’s q ratio (dependent variable) of the companies. The
correlation value of 0.010 between the independent variable (Cash ETR) and dependent variable
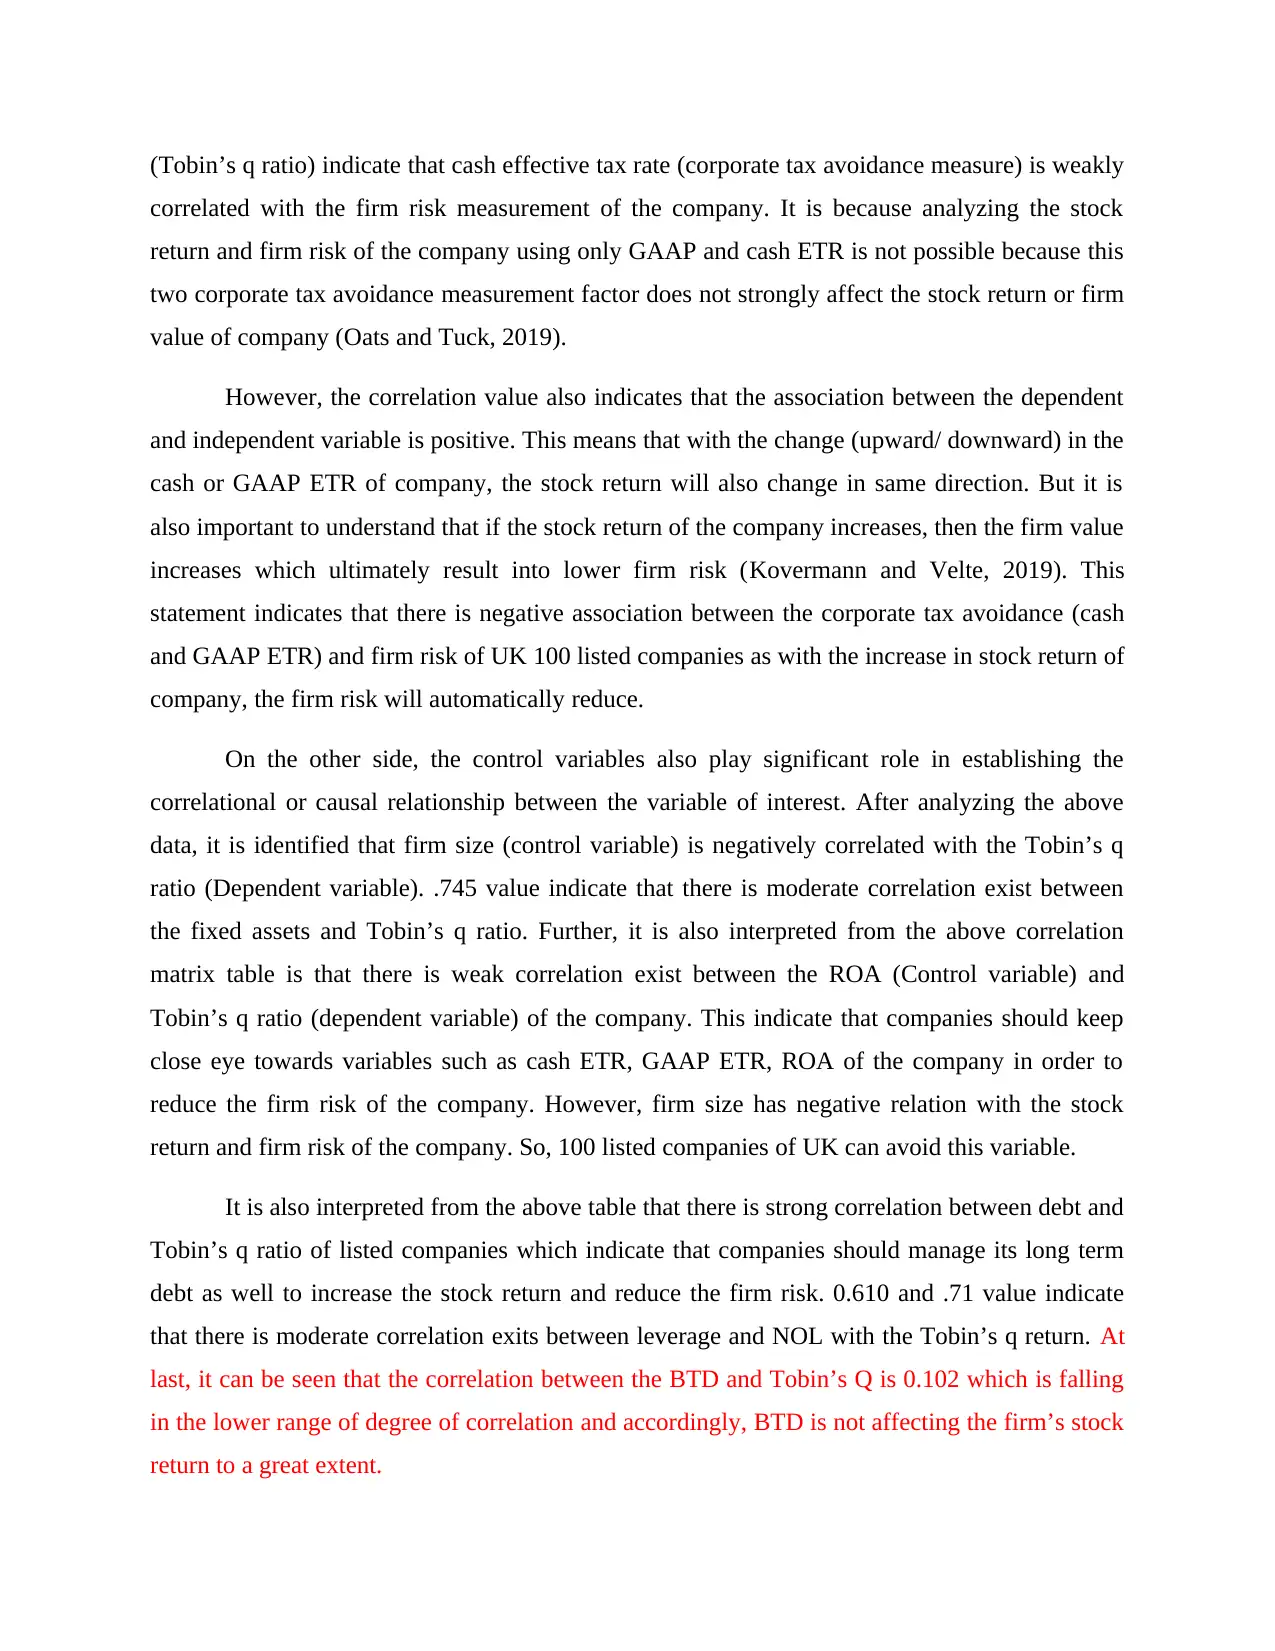
(Tobin’s q ratio) indicate that cash effective tax rate (corporate tax avoidance measure) is weakly
correlated with the firm risk measurement of the company. It is because analyzing the stock
return and firm risk of the company using only GAAP and cash ETR is not possible because this
two corporate tax avoidance measurement factor does not strongly affect the stock return or firm
value of company (Oats and Tuck, 2019).
However, the correlation value also indicates that the association between the dependent
and independent variable is positive. This means that with the change (upward/ downward) in the
cash or GAAP ETR of company, the stock return will also change in same direction. But it is
also important to understand that if the stock return of the company increases, then the firm value
increases which ultimately result into lower firm risk (Kovermann and Velte, 2019). This
statement indicates that there is negative association between the corporate tax avoidance (cash
and GAAP ETR) and firm risk of UK 100 listed companies as with the increase in stock return of
company, the firm risk will automatically reduce.
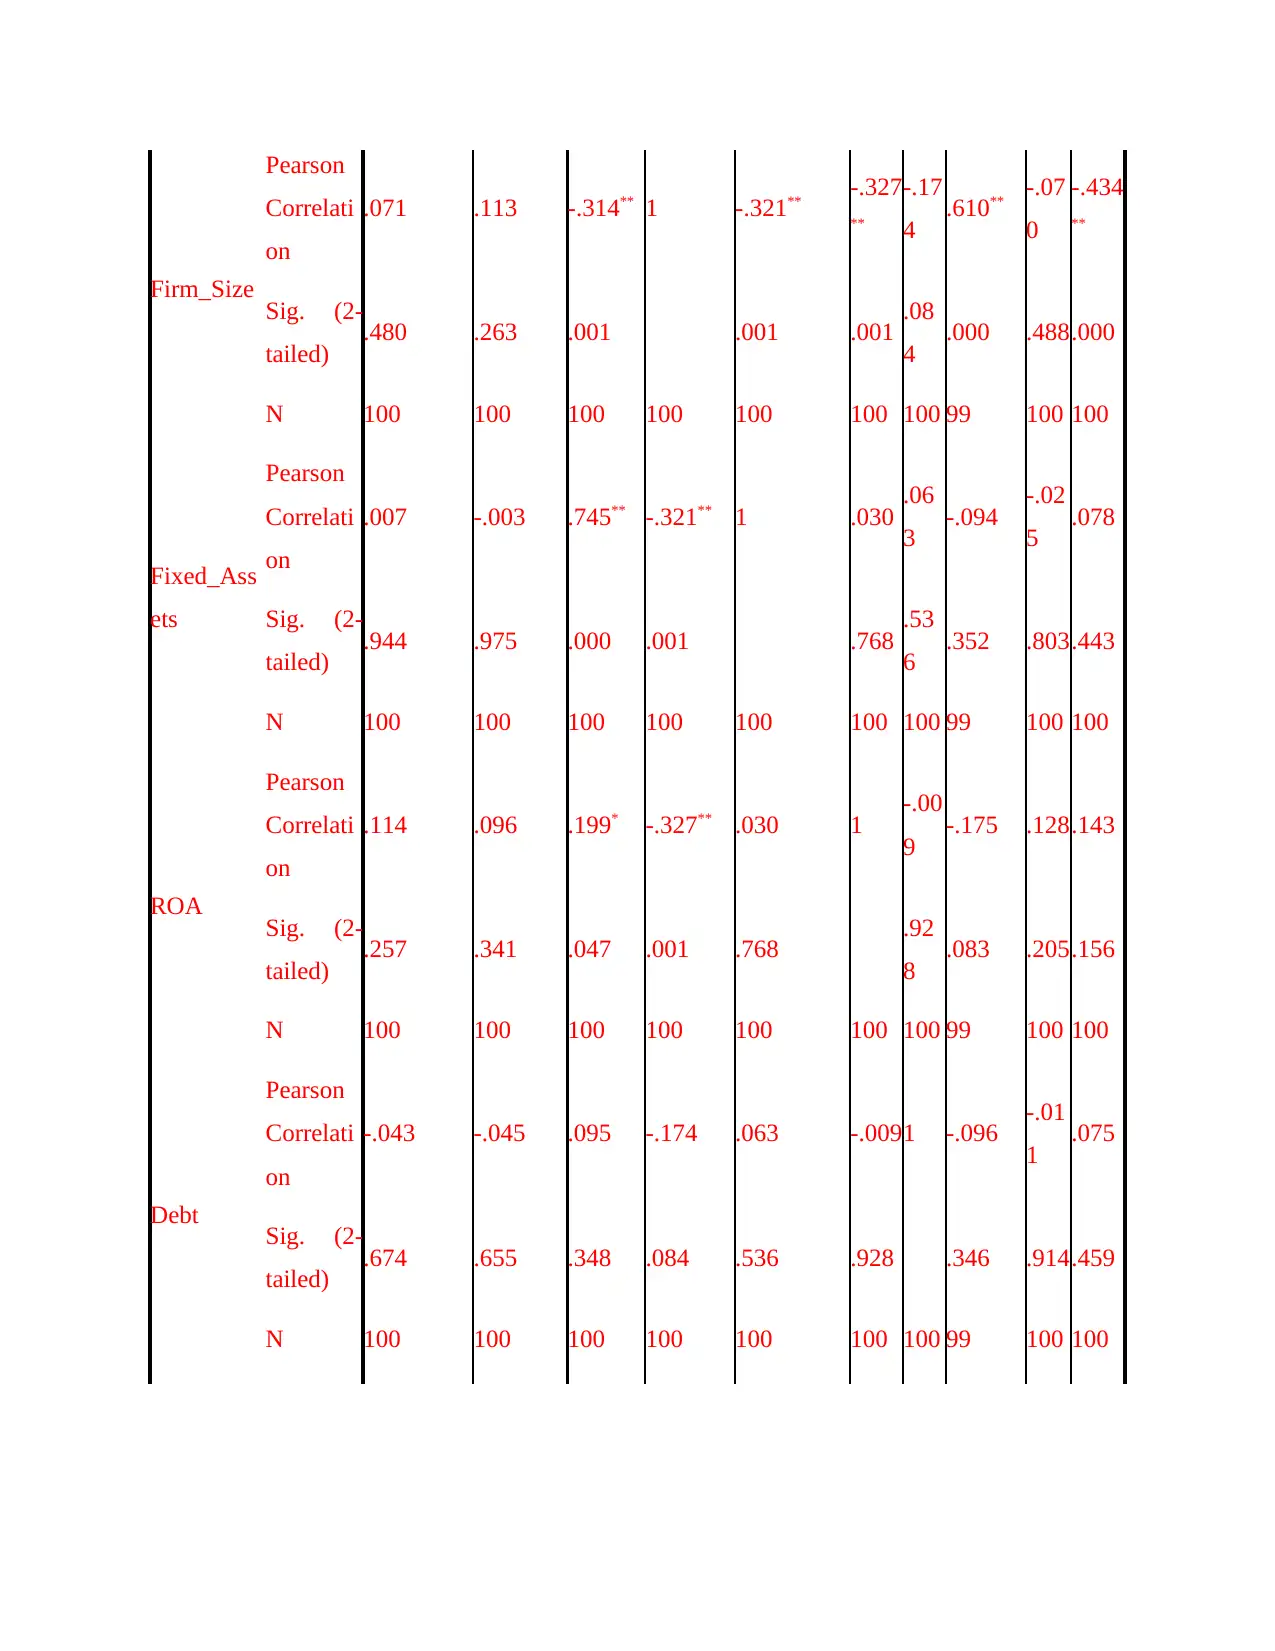
On the other side, the control variables also play significant role in establishing the
correlational or causal relationship between the variable of interest. After analyzing the above
data, it is identified that firm size (control variable) is negatively correlated with the Tobin’s q
ratio (Dependent variable). .745 value indicate that there is moderate correlation exist between
the fixed assets and Tobin’s q ratio. Further, it is also interpreted from the above correlation
matrix table is that there is weak correlation exist between the ROA (Control variable) and
Tobin’s q ratio (dependent variable) of the company. This indicate that companies should keep
close eye towards variables such as cash ETR, GAAP ETR, ROA of the company in order to
reduce the firm risk of the company. However, firm size has negative relation with the stock
return and firm risk of the company. So, 100 listed companies of UK can avoid this variable.
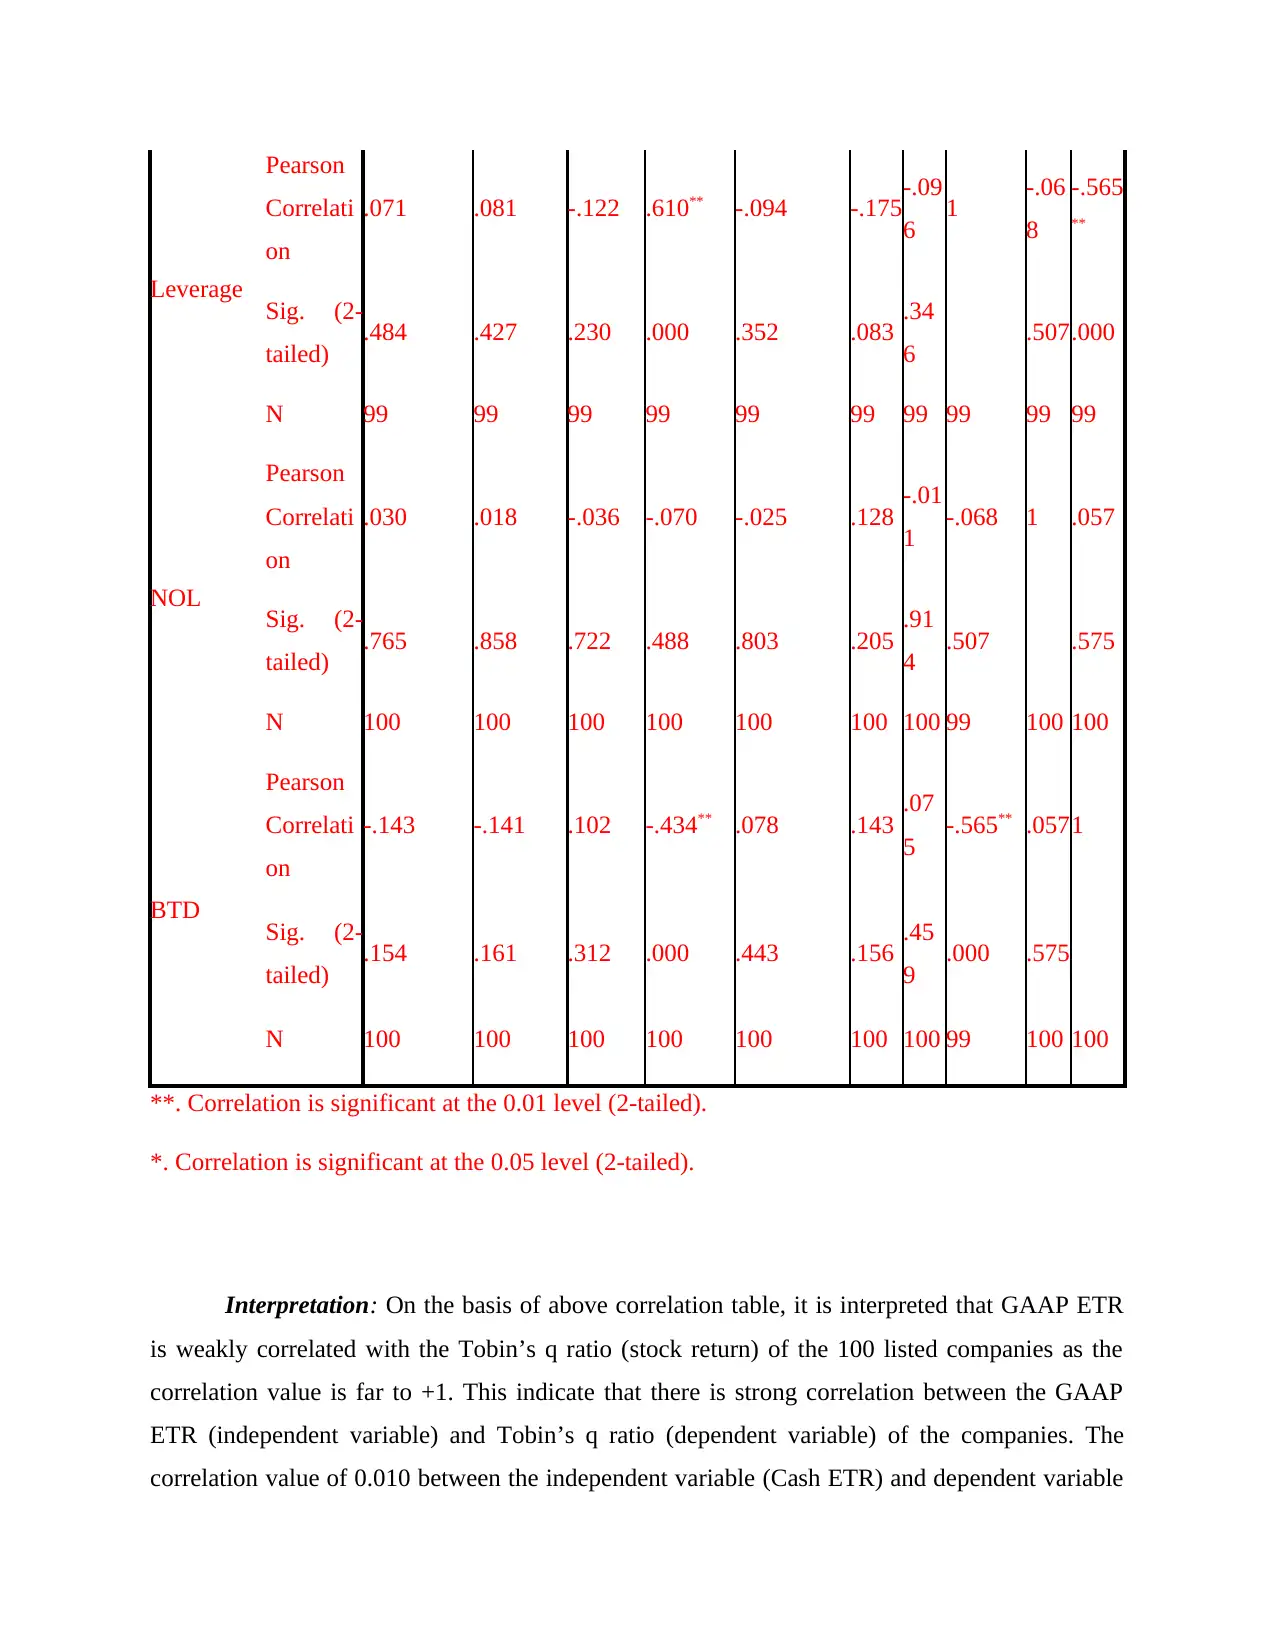
It is also interpreted from the above table that there is strong correlation between debt and
Tobin’s q ratio of listed companies which indicate that companies should manage its long term
debt as well to increase the stock return and reduce the firm risk. 0.610 and .71 value indicate
that there is moderate correlation exits between leverage and NOL with the Tobin’s q return. At
last, it can be seen that the correlation between the BTD and Tobin’s Q is 0.102 which is falling
in the lower range of degree of correlation and accordingly, BTD is not affecting the firm’s stock
return to a great extent.
correlated with the firm risk measurement of the company. It is because analyzing the stock
return and firm risk of the company using only GAAP and cash ETR is not possible because this
two corporate tax avoidance measurement factor does not strongly affect the stock return or firm
value of company (Oats and Tuck, 2019).
However, the correlation value also indicates that the association between the dependent
and independent variable is positive. This means that with the change (upward/ downward) in the
cash or GAAP ETR of company, the stock return will also change in same direction. But it is
also important to understand that if the stock return of the company increases, then the firm value
increases which ultimately result into lower firm risk (Kovermann and Velte, 2019). This
statement indicates that there is negative association between the corporate tax avoidance (cash
and GAAP ETR) and firm risk of UK 100 listed companies as with the increase in stock return of
company, the firm risk will automatically reduce.
On the other side, the control variables also play significant role in establishing the
correlational or causal relationship between the variable of interest. After analyzing the above
data, it is identified that firm size (control variable) is negatively correlated with the Tobin’s q
ratio (Dependent variable). .745 value indicate that there is moderate correlation exist between
the fixed assets and Tobin’s q ratio. Further, it is also interpreted from the above correlation
matrix table is that there is weak correlation exist between the ROA (Control variable) and
Tobin’s q ratio (dependent variable) of the company. This indicate that companies should keep
close eye towards variables such as cash ETR, GAAP ETR, ROA of the company in order to
reduce the firm risk of the company. However, firm size has negative relation with the stock
return and firm risk of the company. So, 100 listed companies of UK can avoid this variable.
It is also interpreted from the above table that there is strong correlation between debt and
Tobin’s q ratio of listed companies which indicate that companies should manage its long term
debt as well to increase the stock return and reduce the firm risk. 0.610 and .71 value indicate
that there is moderate correlation exits between leverage and NOL with the Tobin’s q return. At
last, it can be seen that the correlation between the BTD and Tobin’s Q is 0.102 which is falling
in the lower range of degree of correlation and accordingly, BTD is not affecting the firm’s stock
return to a great extent.
Overall, it is analyzed from the correlation matrix is that companies are required to
manage and control all independent and control variable to reduce the firm risk (Wang and et.al.,
2020).
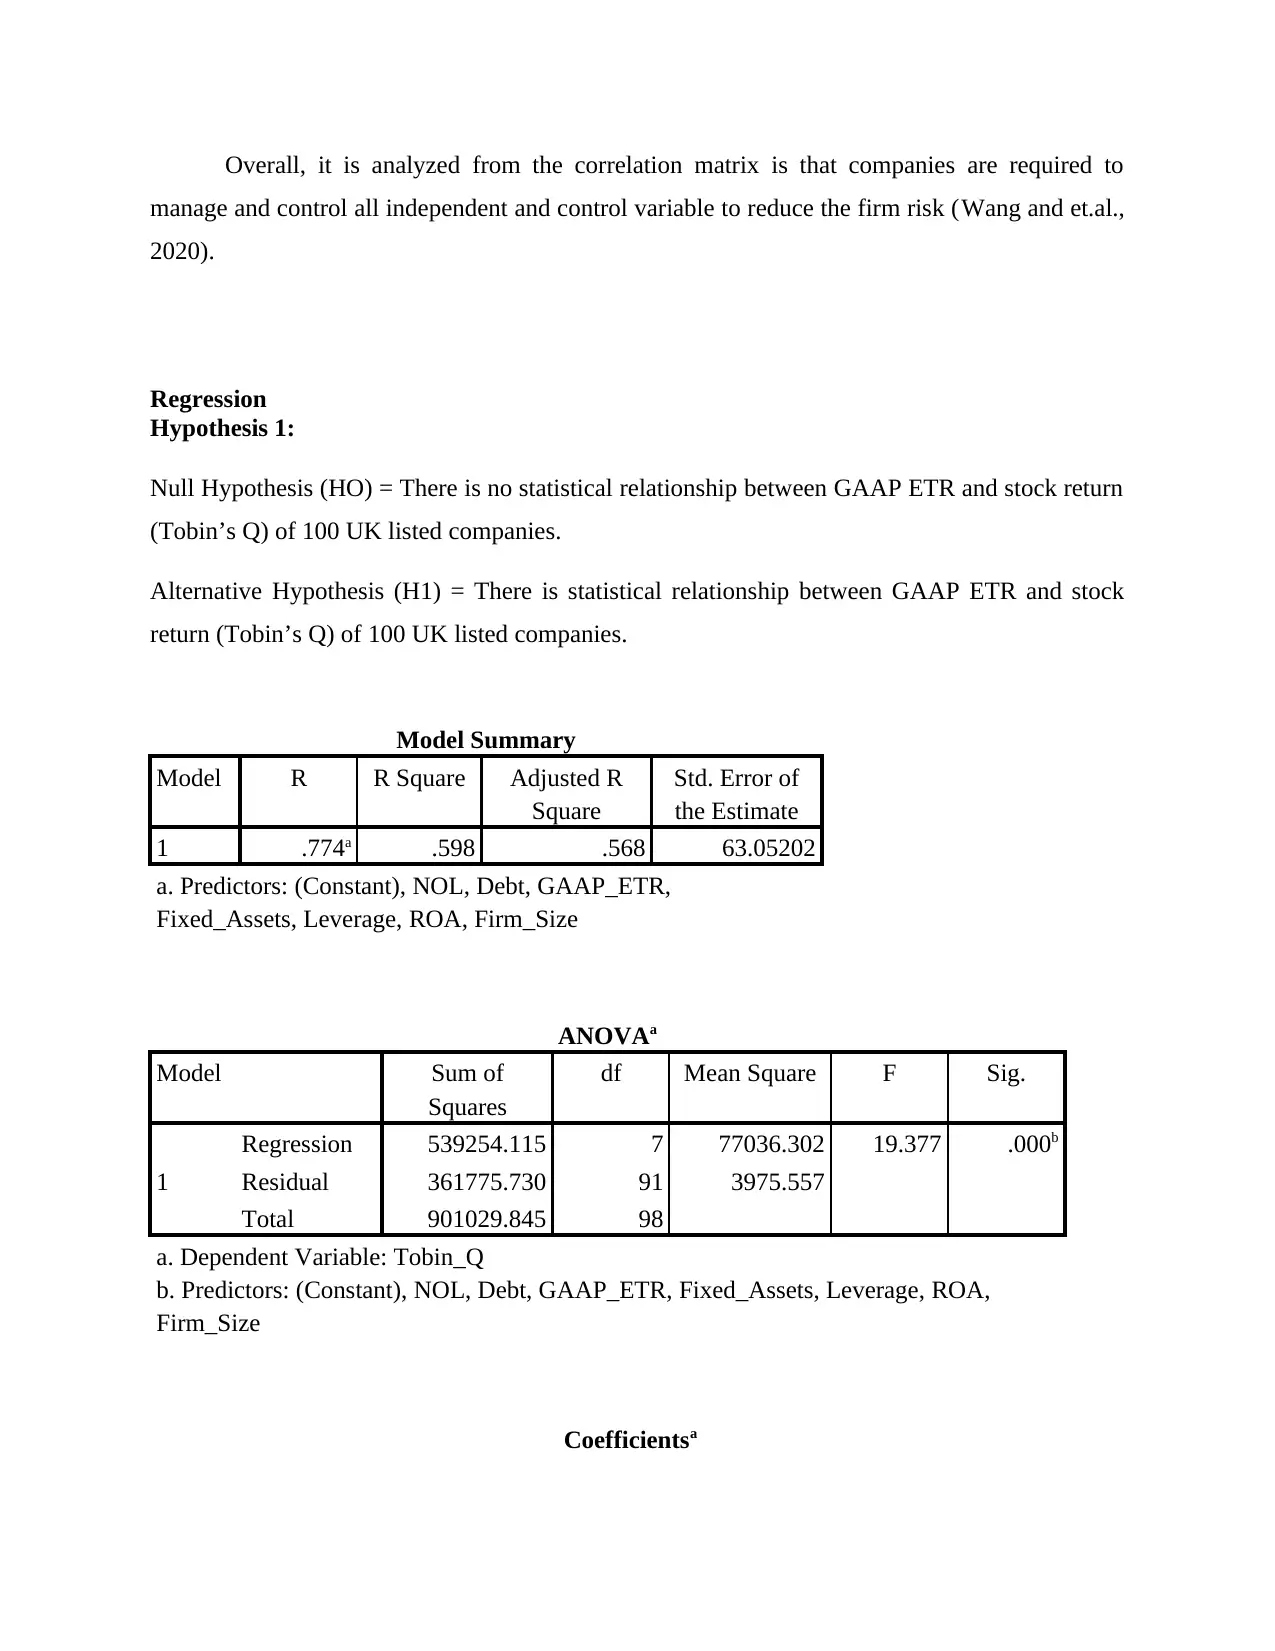
Regression
Hypothesis 1:
Null Hypothesis (HO) = There is no statistical relationship between GAAP ETR and stock return
(Tobin’s Q) of 100 UK listed companies.
Alternative Hypothesis (H1) = There is statistical relationship between GAAP ETR and stock
return (Tobin’s Q) of 100 UK listed companies.
Model Summary
Model R R Square Adjusted R
Square
Std. Error of
the Estimate
1 .774a .598 .568 63.05202
a. Predictors: (Constant), NOL, Debt, GAAP_ETR,
Fixed_Assets, Leverage, ROA, Firm_Size
ANOVAa
Model Sum of
Squares
df Mean Square F Sig.
1
Regression 539254.115 7 77036.302 19.377 .000b
Residual 361775.730 91 3975.557
Total 901029.845 98
a. Dependent Variable: Tobin_Q
b. Predictors: (Constant), NOL, Debt, GAAP_ETR, Fixed_Assets, Leverage, ROA,
Firm_Size
Coefficientsa
manage and control all independent and control variable to reduce the firm risk (Wang and et.al.,
2020).
Regression
Hypothesis 1:
Null Hypothesis (HO) = There is no statistical relationship between GAAP ETR and stock return
(Tobin’s Q) of 100 UK listed companies.
Alternative Hypothesis (H1) = There is statistical relationship between GAAP ETR and stock
return (Tobin’s Q) of 100 UK listed companies.
Model Summary
Model R R Square Adjusted R
Square
Std. Error of
the Estimate
1 .774a .598 .568 63.05202
a. Predictors: (Constant), NOL, Debt, GAAP_ETR,
Fixed_Assets, Leverage, ROA, Firm_Size
ANOVAa
Model Sum of
Squares
df Mean Square F Sig.
1
Regression 539254.115 7 77036.302 19.377 .000b
Residual 361775.730 91 3975.557
Total 901029.845 98
a. Dependent Variable: Tobin_Q
b. Predictors: (Constant), NOL, Debt, GAAP_ETR, Fixed_Assets, Leverage, ROA,
Firm_Size
Coefficientsa
Secure Best Marks with AI Grader
Need help grading? Try our AI Grader for instant feedback on your assignments.
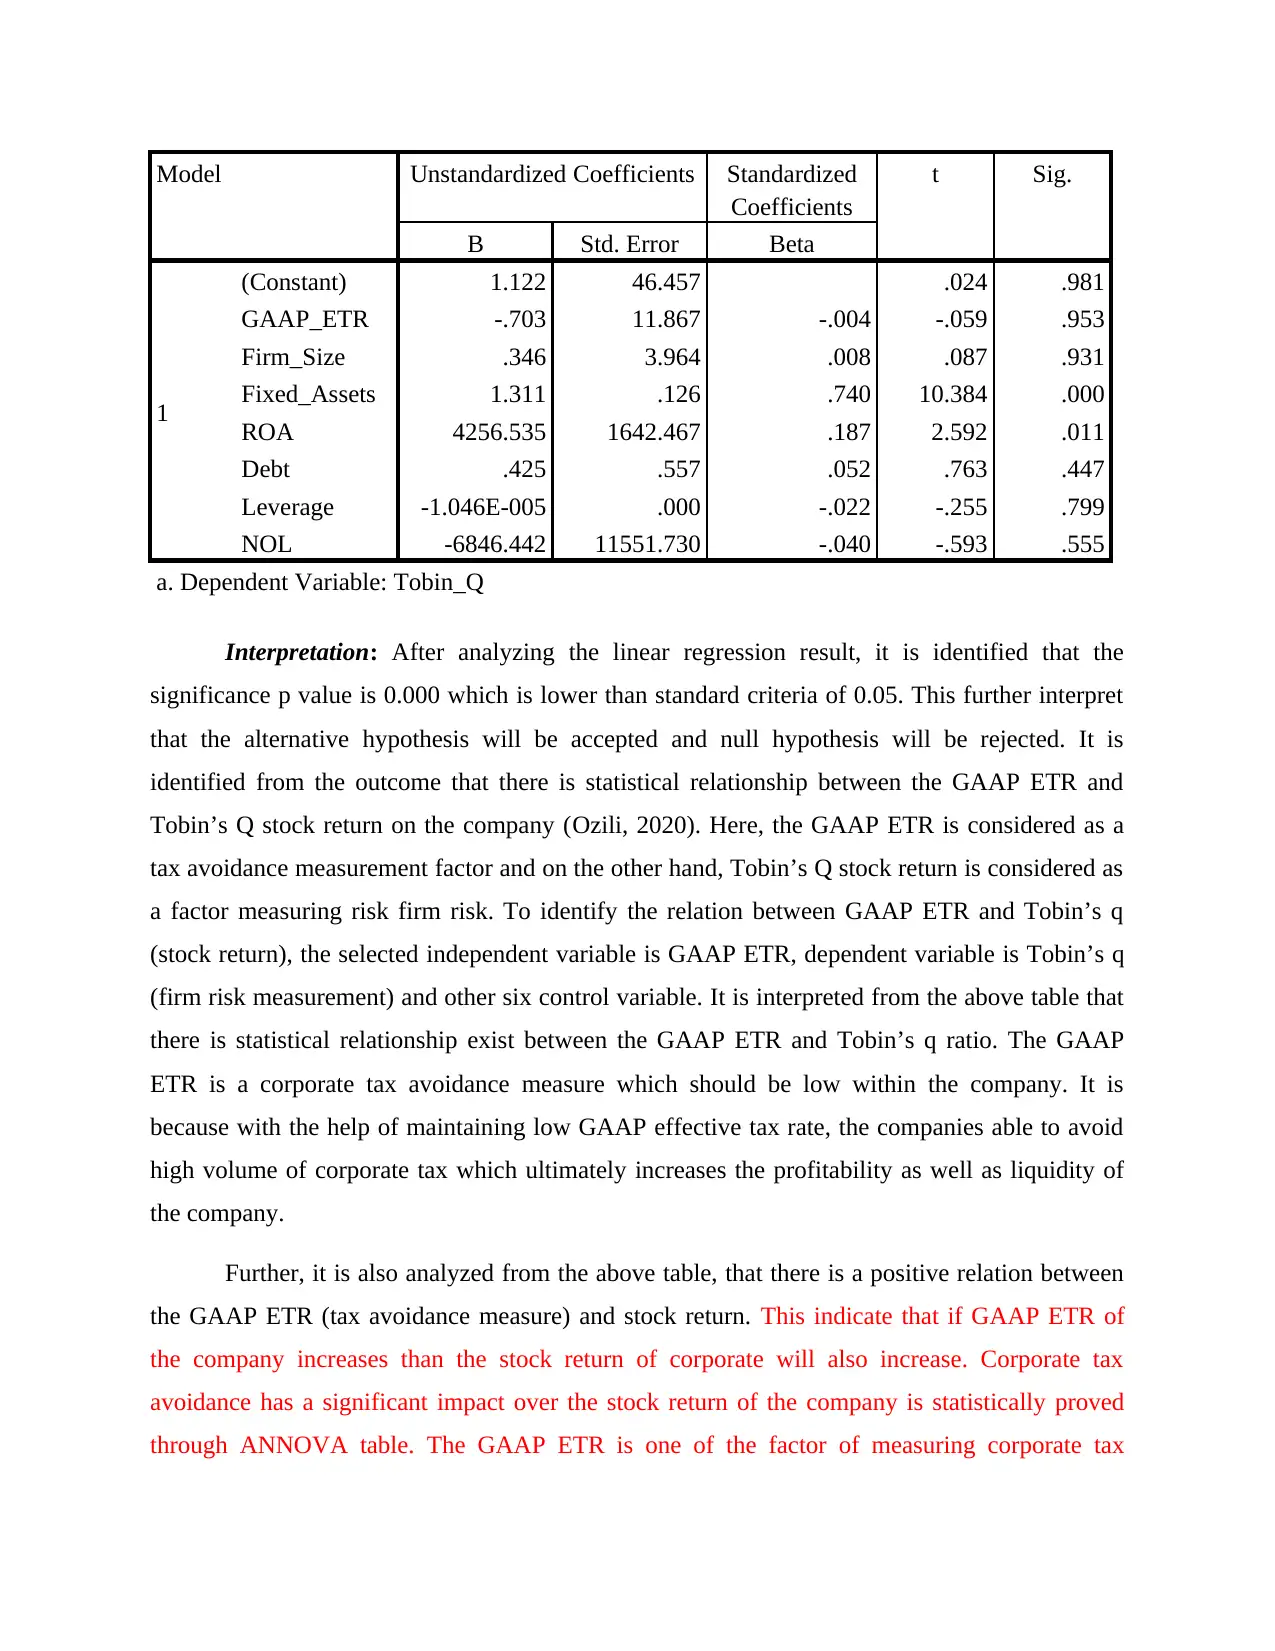
Model Unstandardized Coefficients Standardized
Coefficients
t Sig.
B Std. Error Beta
1
(Constant) 1.122 46.457 .024 .981
GAAP_ETR -.703 11.867 -.004 -.059 .953
Firm_Size .346 3.964 .008 .087 .931
Fixed_Assets 1.311 .126 .740 10.384 .000
ROA 4256.535 1642.467 .187 2.592 .011
Debt .425 .557 .052 .763 .447
Leverage -1.046E-005 .000 -.022 -.255 .799
NOL -6846.442 11551.730 -.040 -.593 .555
a. Dependent Variable: Tobin_Q
Interpretation: After analyzing the linear regression result, it is identified that the
significance p value is 0.000 which is lower than standard criteria of 0.05. This further interpret
that the alternative hypothesis will be accepted and null hypothesis will be rejected. It is
identified from the outcome that there is statistical relationship between the GAAP ETR and
Tobin’s Q stock return on the company (Ozili, 2020). Here, the GAAP ETR is considered as a
tax avoidance measurement factor and on the other hand, Tobin’s Q stock return is considered as
a factor measuring risk firm risk. To identify the relation between GAAP ETR and Tobin’s q
(stock return), the selected independent variable is GAAP ETR, dependent variable is Tobin’s q
(firm risk measurement) and other six control variable. It is interpreted from the above table that
there is statistical relationship exist between the GAAP ETR and Tobin’s q ratio. The GAAP
ETR is a corporate tax avoidance measure which should be low within the company. It is
because with the help of maintaining low GAAP effective tax rate, the companies able to avoid
high volume of corporate tax which ultimately increases the profitability as well as liquidity of
the company.
Further, it is also analyzed from the above table, that there is a positive relation between
the GAAP ETR (tax avoidance measure) and stock return. This indicate that if GAAP ETR of
the company increases than the stock return of corporate will also increase. Corporate tax
avoidance has a significant impact over the stock return of the company is statistically proved
through ANNOVA table. The GAAP ETR is one of the factor of measuring corporate tax
avoidance and stock return is a firm risk measurement which indicate that if the company stock
return increases than this leads to reduction in the firm risk of companies. Hence, on this basis, it
is interpreted that if the GAAP ETR of 100 listed companies increases than their stock return will
also increases because of positive association. The increase in stock return will ultimately result
into the reduction in firm risk. With the ANNOVA table, it is identified that GAAP ETR have a
significant impact on the stock return (Tobin’s q) of the company but on the other hand, from the
coefficient table, it is identified that GAAP ETR have no significant impact on stock return
because of significance value of 0.953 (Zeng, 2018). The ANNOVA table state that the
alternative hypothesis is accepted or proved. This means that overall the GAAP ETR affect the
stock return of the company. While on the other hand, the coefficient table state that GAAP ETR
individually do not affect the Tobin’s Q (stock return) of 100 listed companies.
However, the coefficient table has also stated that individual factors such as firm size,
leverage and NOL has no significant association or impact on the Tobin’s q ratio of the company
which is basically a firm risk measurement. It is because their significance value is more than
0.05. While the individual variable such as ROA, Debt and fixed assets have significant impact
on the stock return (Tobin’s q) of the company (Yee, Sapiei and Abdullah, 2018). On this basis,
it can be said that this individual variable is not affecting the Tobin’s q value of the company, but
while considering it together this are affecting the Tobin’s q (stock return) of the company as per
ANNOVA table.
From the present data and its findings, it is analyzed that 100 listed companies of UK
adopt the strategies to reduce the GAAP ETR of the company. It is because if the GAAP ETR of
the company reduces, the firm value of company will increase which further result into lower
firm risk. Hence, on this basis, it is statistically proved that there is negative effect of corporate
tax avoidance (GAAP ETR) on the firm risk of the companies. It is because with the increase in
GAAP ETR, the firm value or stock return on companies will reduce which ultimately leads to
lower firm risk. Overall, it is interpreted that 100 listed companies of UK adopted different
strategies to reduce the GAAP effective tax rate in order to reduce firm risk (Mao, 2019).
Hypothesis 2:
Null hypothesis: There is no statistical relationship between Cash ETR and Stock returns
(Tobin’s Q ratio) of the 100 listed firms.
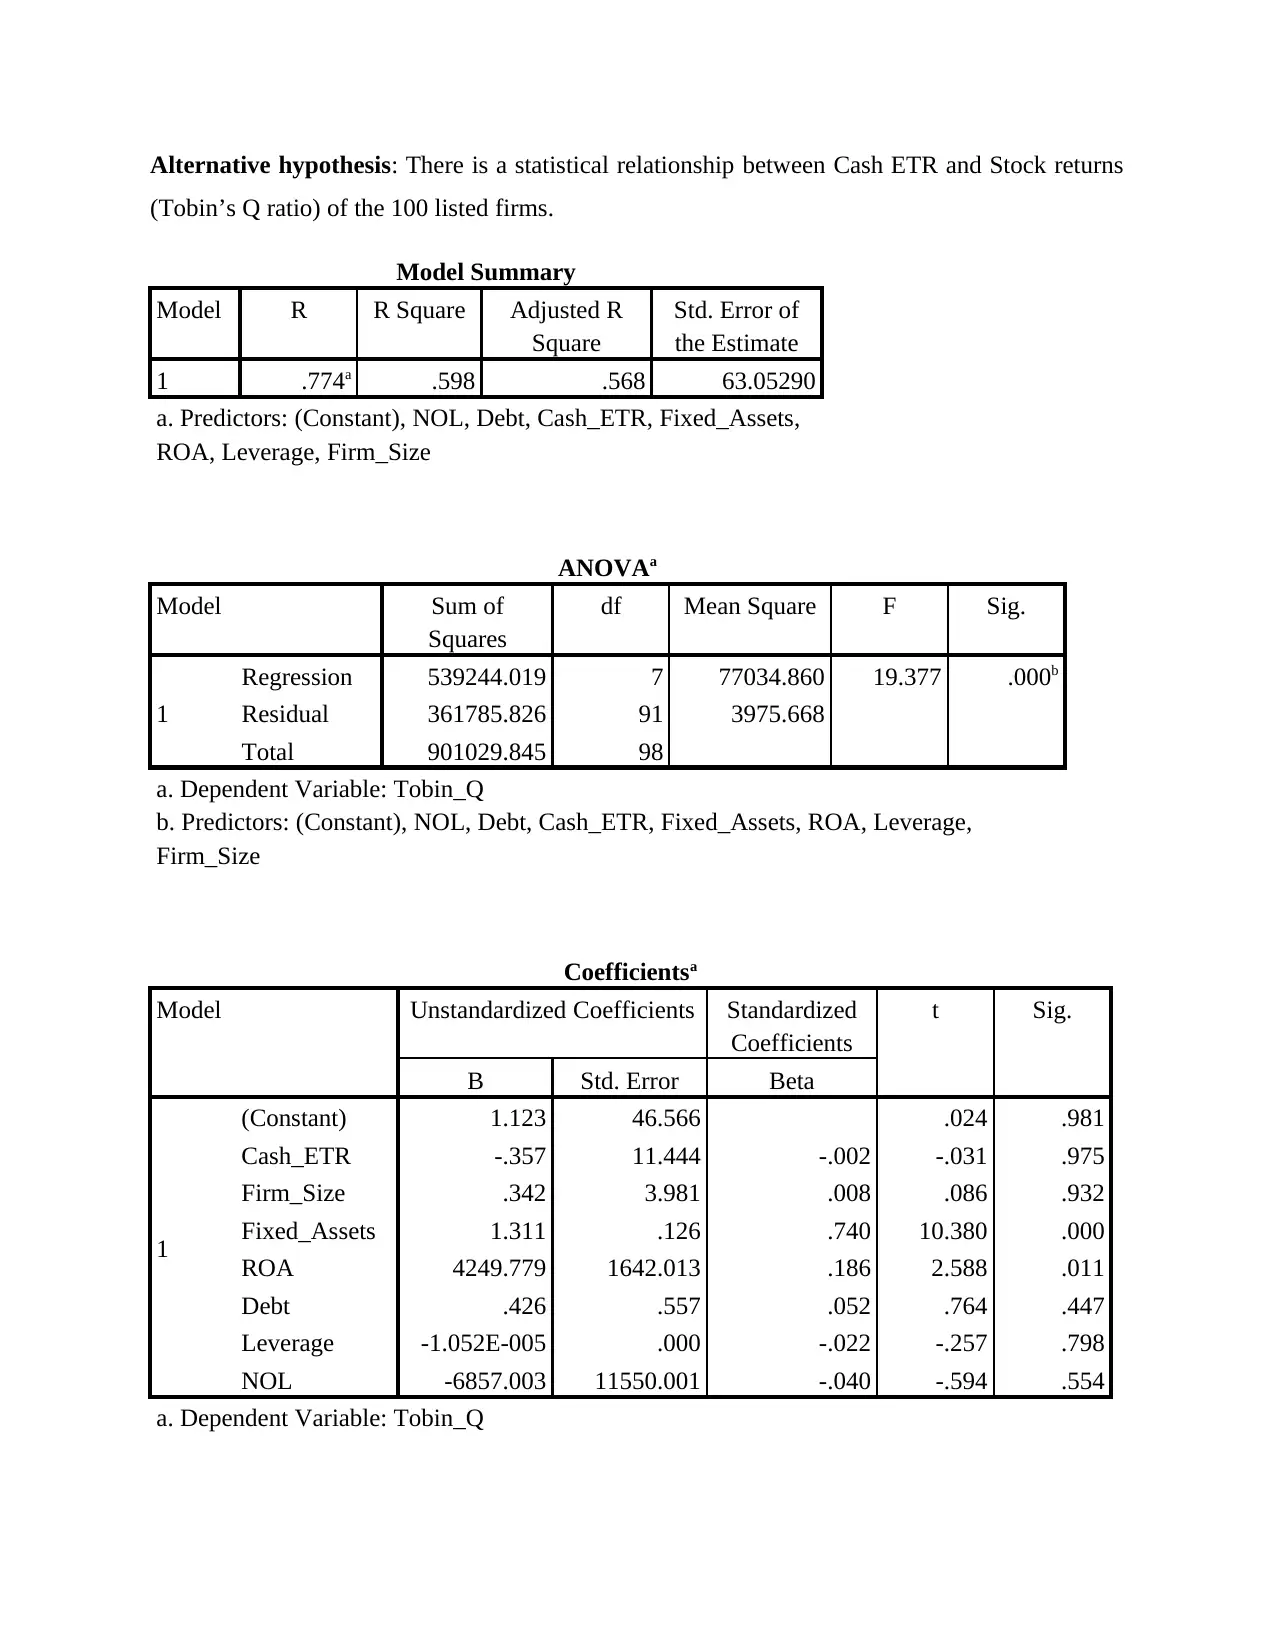
Alternative hypothesis: There is a statistical relationship between Cash ETR and Stock returns
(Tobin’s Q ratio) of the 100 listed firms.
Model Summary
Model R R Square Adjusted R
Square
Std. Error of
the Estimate
1 .774a .598 .568 63.05290
a. Predictors: (Constant), NOL, Debt, Cash_ETR, Fixed_Assets,
ROA, Leverage, Firm_Size
ANOVAa
Model Sum of
Squares
df Mean Square F Sig.
1
Regression 539244.019 7 77034.860 19.377 .000b
Residual 361785.826 91 3975.668
Total 901029.845 98
a. Dependent Variable: Tobin_Q
b. Predictors: (Constant), NOL, Debt, Cash_ETR, Fixed_Assets, ROA, Leverage,
Firm_Size
Coefficientsa
Model Unstandardized Coefficients Standardized
Coefficients
t Sig.
B Std. Error Beta
1
(Constant) 1.123 46.566 .024 .981
Cash_ETR -.357 11.444 -.002 -.031 .975
Firm_Size .342 3.981 .008 .086 .932
Fixed_Assets 1.311 .126 .740 10.380 .000
ROA 4249.779 1642.013 .186 2.588 .011
Debt .426 .557 .052 .764 .447
Leverage -1.052E-005 .000 -.022 -.257 .798
NOL -6857.003 11550.001 -.040 -.594 .554
a. Dependent Variable: Tobin_Q
Paraphrase This Document
Need a fresh take? Get an instant paraphrase of this document with our AI Paraphraser
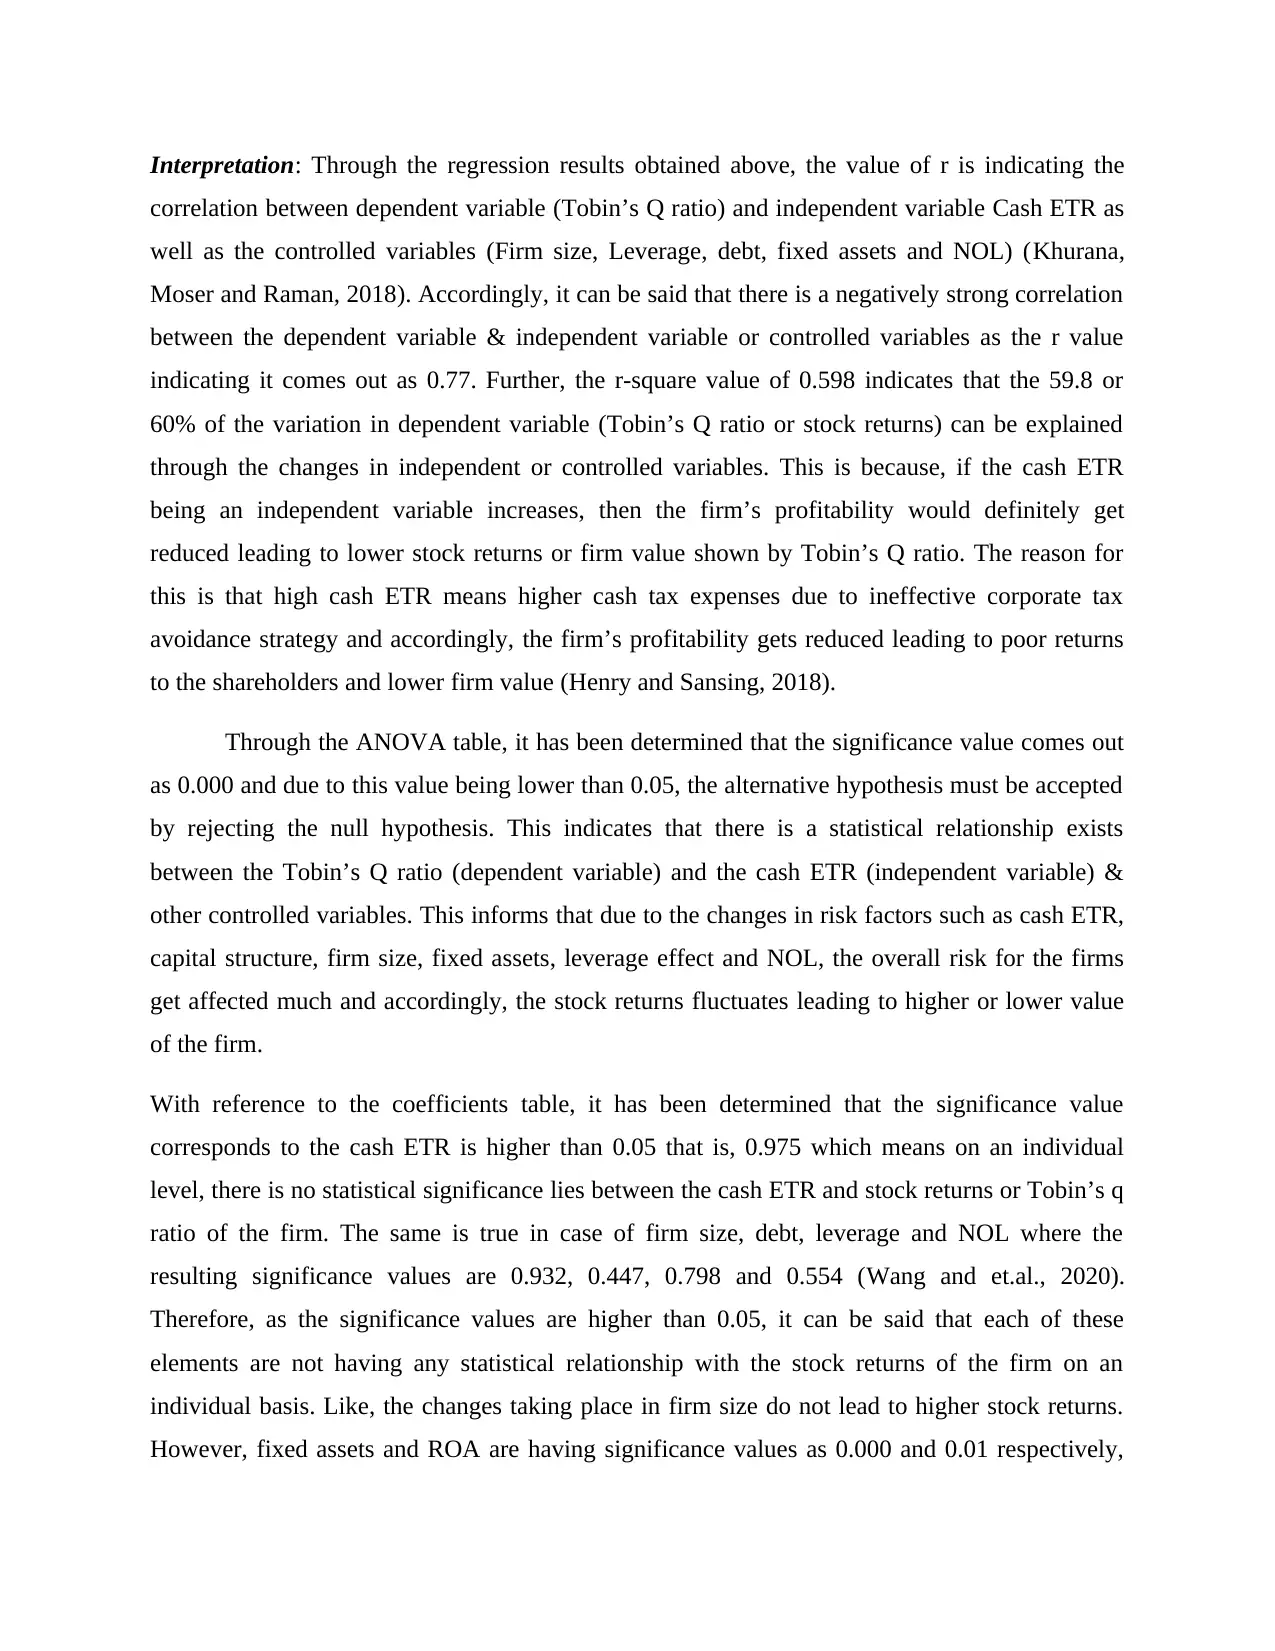
Interpretation: Through the regression results obtained above, the value of r is indicating the
correlation between dependent variable (Tobin’s Q ratio) and independent variable Cash ETR as
well as the controlled variables (Firm size, Leverage, debt, fixed assets and NOL) (Khurana,
Moser and Raman, 2018). Accordingly, it can be said that there is a negatively strong correlation
between the dependent variable & independent variable or controlled variables as the r value
indicating it comes out as 0.77. Further, the r-square value of 0.598 indicates that the 59.8 or
60% of the variation in dependent variable (Tobin’s Q ratio or stock returns) can be explained
through the changes in independent or controlled variables. This is because, if the cash ETR
being an independent variable increases, then the firm’s profitability would definitely get
reduced leading to lower stock returns or firm value shown by Tobin’s Q ratio. The reason for
this is that high cash ETR means higher cash tax expenses due to ineffective corporate tax
avoidance strategy and accordingly, the firm’s profitability gets reduced leading to poor returns
to the shareholders and lower firm value (Henry and Sansing, 2018).
Through the ANOVA table, it has been determined that the significance value comes out
as 0.000 and due to this value being lower than 0.05, the alternative hypothesis must be accepted
by rejecting the null hypothesis. This indicates that there is a statistical relationship exists
between the Tobin’s Q ratio (dependent variable) and the cash ETR (independent variable) &
other controlled variables. This informs that due to the changes in risk factors such as cash ETR,
capital structure, firm size, fixed assets, leverage effect and NOL, the overall risk for the firms
get affected much and accordingly, the stock returns fluctuates leading to higher or lower value
of the firm.
With reference to the coefficients table, it has been determined that the significance value
corresponds to the cash ETR is higher than 0.05 that is, 0.975 which means on an individual
level, there is no statistical significance lies between the cash ETR and stock returns or Tobin’s q
ratio of the firm. The same is true in case of firm size, debt, leverage and NOL where the
resulting significance values are 0.932, 0.447, 0.798 and 0.554 (Wang and et.al., 2020).
Therefore, as the significance values are higher than 0.05, it can be said that each of these
elements are not having any statistical relationship with the stock returns of the firm on an
individual basis. Like, the changes taking place in firm size do not lead to higher stock returns.
However, fixed assets and ROA are having significance values as 0.000 and 0.01 respectively,
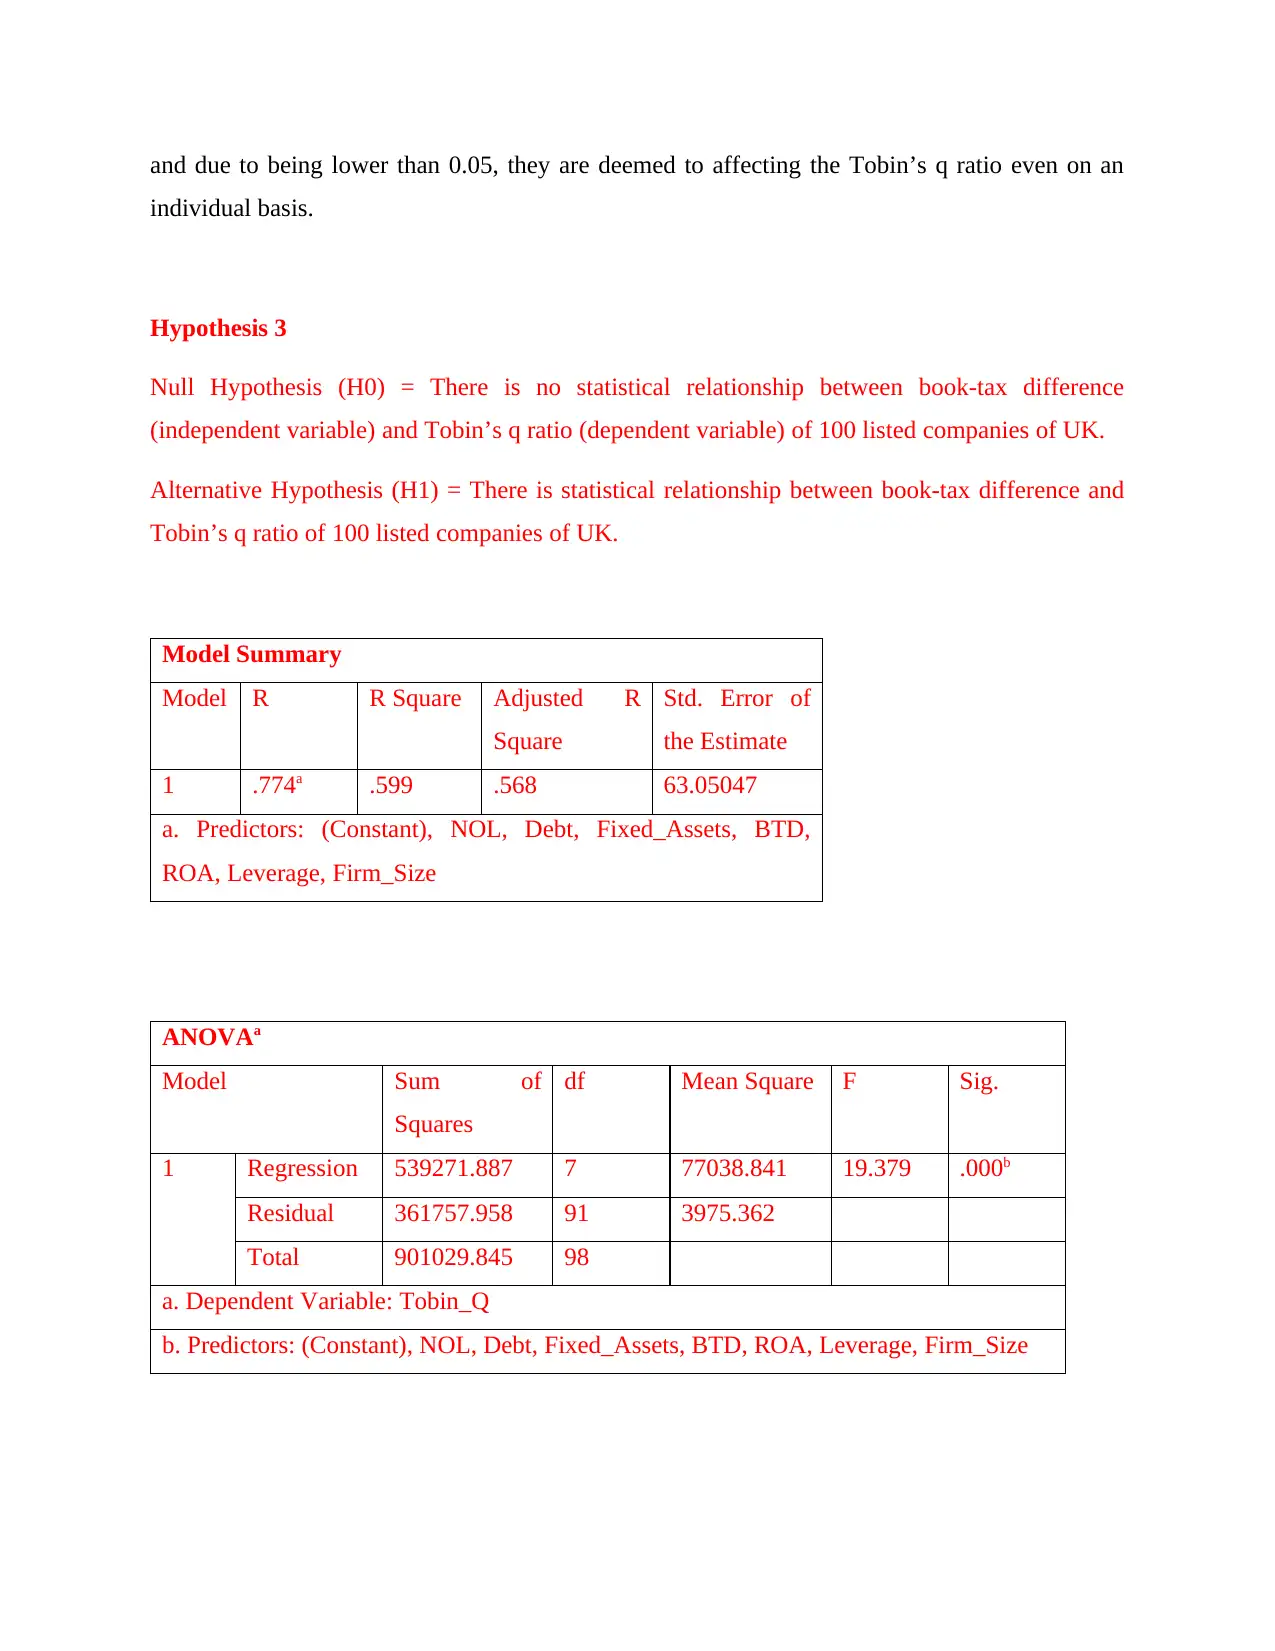
and due to being lower than 0.05, they are deemed to affecting the Tobin’s q ratio even on an
individual basis.
Hypothesis 3
Null Hypothesis (H0) = There is no statistical relationship between book-tax difference
(independent variable) and Tobin’s q ratio (dependent variable) of 100 listed companies of UK.
Alternative Hypothesis (H1) = There is statistical relationship between book-tax difference and
Tobin’s q ratio of 100 listed companies of UK.
Model Summary
Model R R Square Adjusted R
Square
Std. Error of
the Estimate
1 .774a .599 .568 63.05047
a. Predictors: (Constant), NOL, Debt, Fixed_Assets, BTD,
ROA, Leverage, Firm_Size
ANOVAa
Model Sum of
Squares
df Mean Square F Sig.
1 Regression 539271.887 7 77038.841 19.379 .000b
Residual 361757.958 91 3975.362
Total 901029.845 98
a. Dependent Variable: Tobin_Q
b. Predictors: (Constant), NOL, Debt, Fixed_Assets, BTD, ROA, Leverage, Firm_Size
Coefficientsa
Model Unstandardized Coefficients Standardized
Coefficients
t Sig.
B Std. Error Beta
1 (Constant) .874 46.593 .019 .985
BTD 1.073E-005 .000 .007 .089 .929
Firm_Size .369 3.979 .009 .093 .926
Fixed_Assets 1.311 .126 .740 10.391 .000
ROA 4240.225 1625.453 .186 2.609 .011
Debt .426 .557 .052 .764 .447
Leverage -8.847E-006 .000 -.018 -.196 .845
NOL -6878.022 11550.072 -.040 -.595 .553
a. Dependent Variable: Tobin_Q
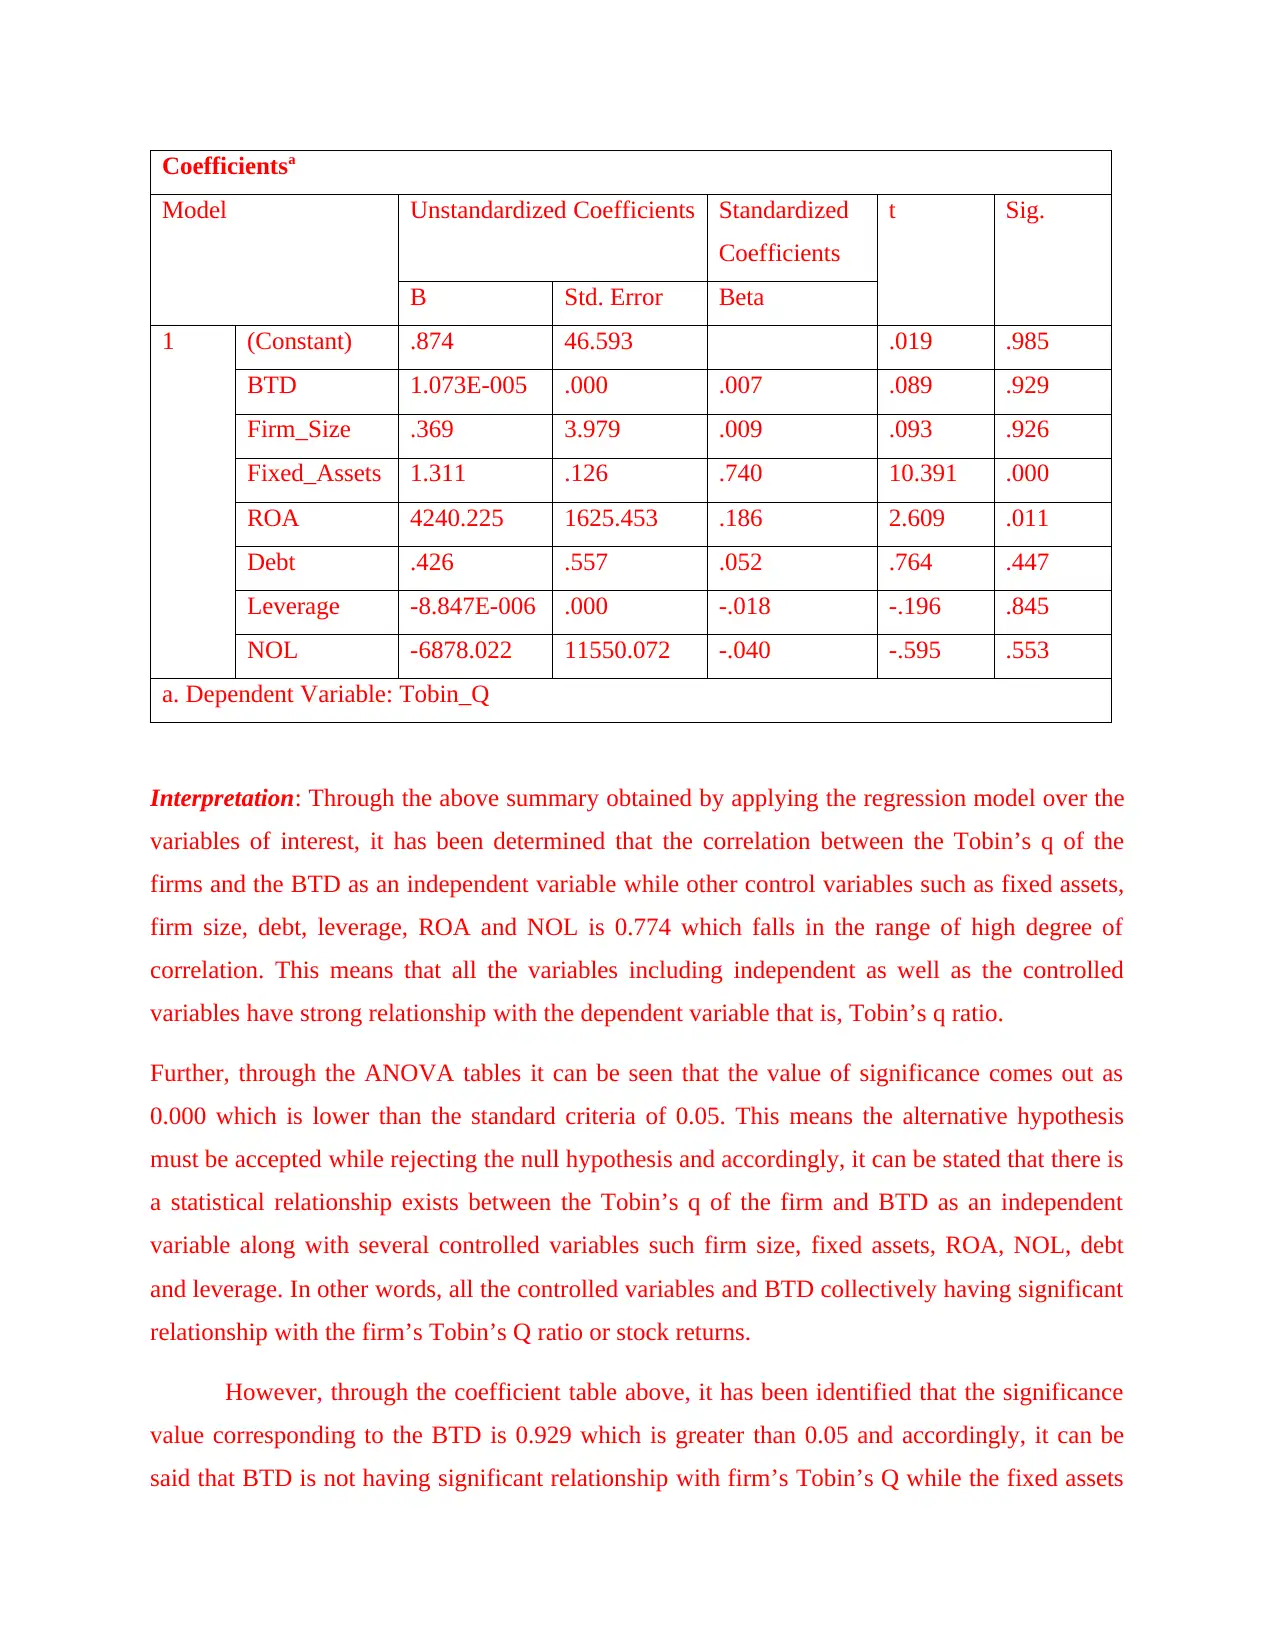
Interpretation: Through the above summary obtained by applying the regression model over the
variables of interest, it has been determined that the correlation between the Tobin’s q of the
firms and the BTD as an independent variable while other control variables such as fixed assets,
firm size, debt, leverage, ROA and NOL is 0.774 which falls in the range of high degree of
correlation. This means that all the variables including independent as well as the controlled
variables have strong relationship with the dependent variable that is, Tobin’s q ratio.
Further, through the ANOVA tables it can be seen that the value of significance comes out as
0.000 which is lower than the standard criteria of 0.05. This means the alternative hypothesis
must be accepted while rejecting the null hypothesis and accordingly, it can be stated that there is
a statistical relationship exists between the Tobin’s q of the firm and BTD as an independent
variable along with several controlled variables such firm size, fixed assets, ROA, NOL, debt
and leverage. In other words, all the controlled variables and BTD collectively having significant
relationship with the firm’s Tobin’s Q ratio or stock returns.
However, through the coefficient table above, it has been identified that the significance
value corresponding to the BTD is 0.929 which is greater than 0.05 and accordingly, it can be
said that BTD is not having significant relationship with firm’s Tobin’s Q while the fixed assets
Model Unstandardized Coefficients Standardized
Coefficients
t Sig.
B Std. Error Beta
1 (Constant) .874 46.593 .019 .985
BTD 1.073E-005 .000 .007 .089 .929
Firm_Size .369 3.979 .009 .093 .926
Fixed_Assets 1.311 .126 .740 10.391 .000
ROA 4240.225 1625.453 .186 2.609 .011
Debt .426 .557 .052 .764 .447
Leverage -8.847E-006 .000 -.018 -.196 .845
NOL -6878.022 11550.072 -.040 -.595 .553
a. Dependent Variable: Tobin_Q
Interpretation: Through the above summary obtained by applying the regression model over the
variables of interest, it has been determined that the correlation between the Tobin’s q of the
firms and the BTD as an independent variable while other control variables such as fixed assets,
firm size, debt, leverage, ROA and NOL is 0.774 which falls in the range of high degree of
correlation. This means that all the variables including independent as well as the controlled
variables have strong relationship with the dependent variable that is, Tobin’s q ratio.
Further, through the ANOVA tables it can be seen that the value of significance comes out as
0.000 which is lower than the standard criteria of 0.05. This means the alternative hypothesis
must be accepted while rejecting the null hypothesis and accordingly, it can be stated that there is
a statistical relationship exists between the Tobin’s q of the firm and BTD as an independent
variable along with several controlled variables such firm size, fixed assets, ROA, NOL, debt
and leverage. In other words, all the controlled variables and BTD collectively having significant
relationship with the firm’s Tobin’s Q ratio or stock returns.
However, through the coefficient table above, it has been identified that the significance
value corresponding to the BTD is 0.929 which is greater than 0.05 and accordingly, it can be
said that BTD is not having significant relationship with firm’s Tobin’s Q while the fixed assets
Secure Best Marks with AI Grader
Need help grading? Try our AI Grader for instant feedback on your assignments.

and ROA are having significance value of 0.000 and 0.011 respectively. Therefore, ROA and
fixed assets have statistical significance with the stock returns generated by the firms. Further,
there are several control variables such as firm size, Debt, leverage and NOL where no
significant relationship have been identified with respect to Tobin’s q on an individual basis as
they single handedly do not affect the firm’s risk.
REFERENCES
Books and Journals
Abdelfattah, T. and Aboud, A., 2020. Tax avoidance, corporate governance, and corporate social
responsibility: The case of the Egyptian capital market. Journal of International
Accounting, Auditing and Taxation, 38, p.100304.
Blaufus, K., Möhlmann, A. and Schwäbe, A. N., 2019. Stock price reactions to news about
corporate tax avoidance and evasion. Journal of Economic Psychology, 72, pp.278-292.
Chen, Y., and et.al., 2019. Stock liquidity and corporate tax avoidance. Review of Accounting
Studies, 24(1), pp.309-340.
He, G., Ren, H. M. and Taffler, R., 2020. The impact of corporate tax avoidance on analyst
coverage and forecasts. Review of Quantitative Finance and Accounting, 54(2), pp.447-
477.
Henry, E. and Sansing, R., 2018. Corporate tax avoidance: Data truncation and loss
firms. Review of Accounting Studies, 23(3), pp.1042-1070.
Khurana, I. K., Moser, W. J. and Raman, K. K., 2018. Tax avoidance, managerial ability, and
investment efficiency. Abacus, 54(4), pp.547-575.
Kovermann, J. and Velte, P., 2019. The impact of corporate governance on corporate tax
avoidance—A literature review. Journal of International Accounting, Auditing and
Taxation, 36, p.100270.
Mao, C. W., 2019. Effect of corporate social responsibility on corporate tax avoidance: evidence
from a matching approach. Quality & Quantity. 53(1). pp.49-67.
Oats, L. and Tuck, P., 2019. Corporate tax avoidance: is tax transparency the
solution?. Accounting and Business Research. 49(5). pp.565-583.
Ozili, P. K., 2020. Tax evasion and financial instability. Journal of Financial Crime.
Wang, F. and et.al., 2020. Corporate tax avoidance: A literature review and research
agenda. Journal of Economic Surveys. 34(4). pp.793-811.

Yee, C. S., Sapiei, N. S. and Abdullah, M., 2018. Tax avoidance, corporate governance and firm
value in the digital era. Journal of Accounting and Investment. 19(2). pp.160-175.
Zeng, T., 2018. Relationship between corporate social responsibility and tax avoidance:
international evidence. Social Responsibility Journal.
value in the digital era. Journal of Accounting and Investment. 19(2). pp.160-175.
Zeng, T., 2018. Relationship between corporate social responsibility and tax avoidance:
international evidence. Social Responsibility Journal.
1 out of 19
Related Documents


Your All-in-One AI-Powered Toolkit for Academic Success.
+13062052269
info@desklib.com
Available 24*7 on WhatsApp / Email
![[object Object]](/_next/static/media/star-bottom.7253800d.svg)
Unlock your academic potential
© 2024 | Zucol Services PVT LTD | All rights reserved.