logo

The Effect of Tax Avoidance on Firm Risk in the UK

19 Pages5289 Words50 Views
   

Added on  2023-06-07

About This Document

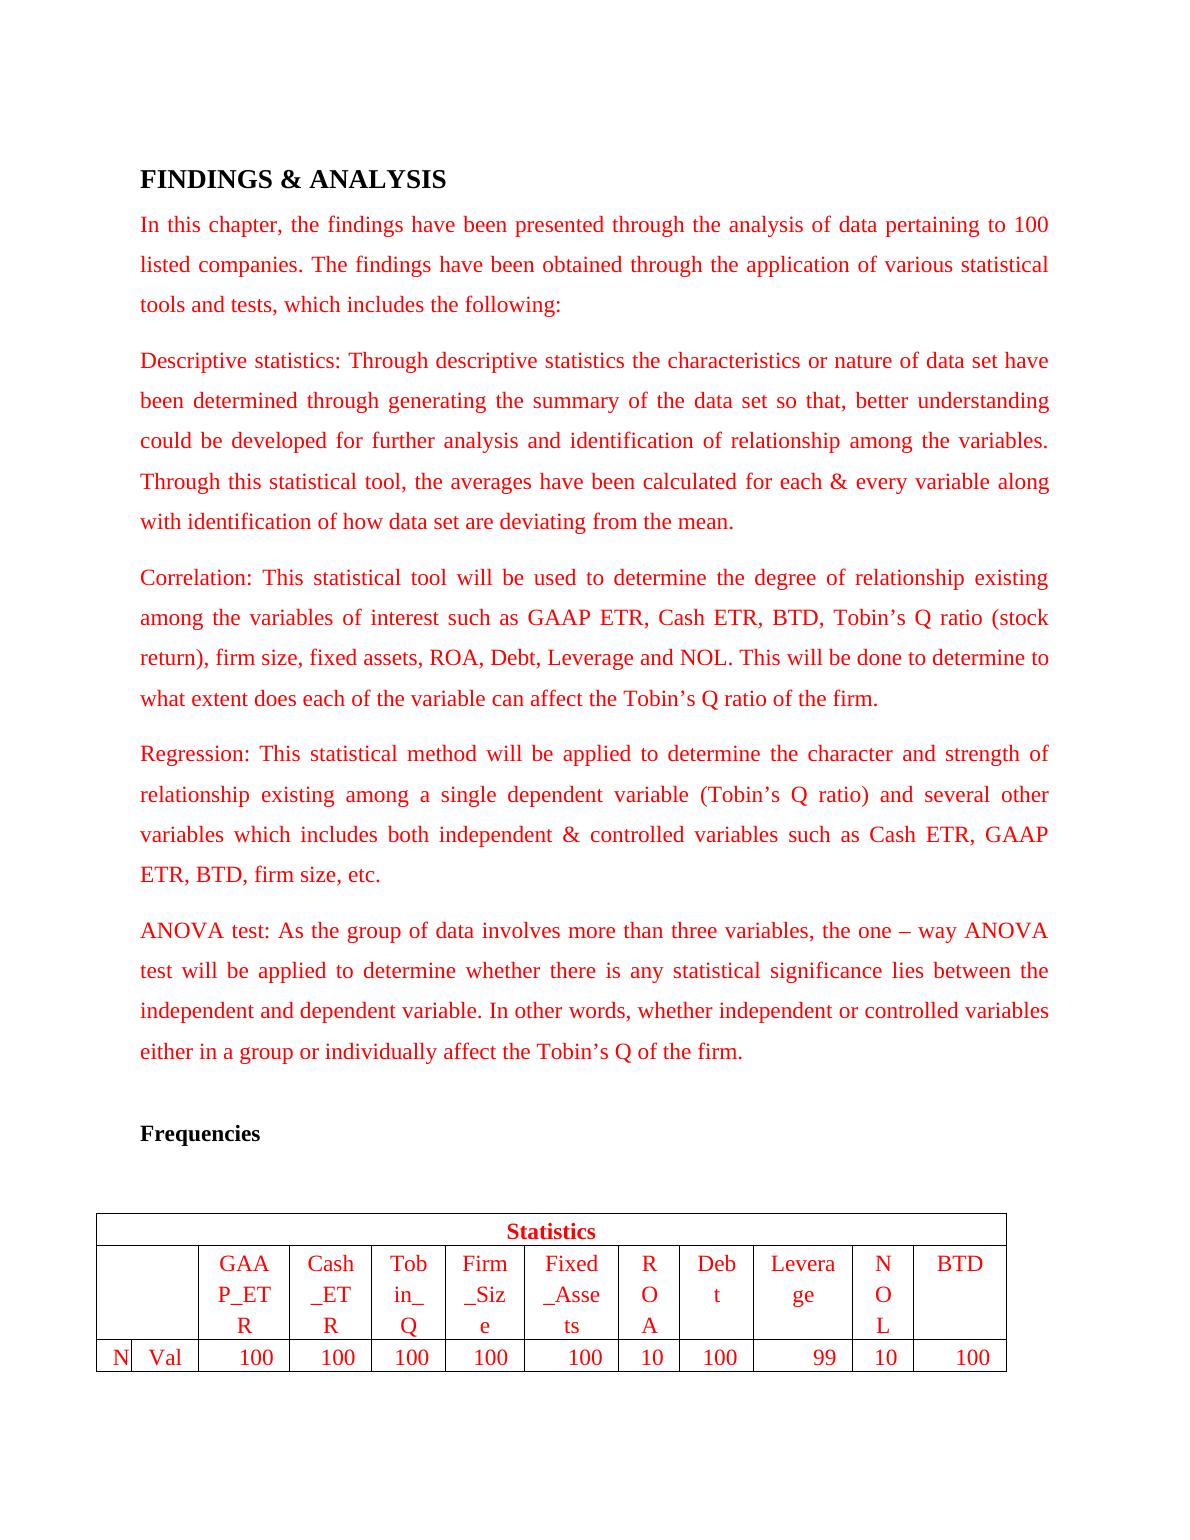
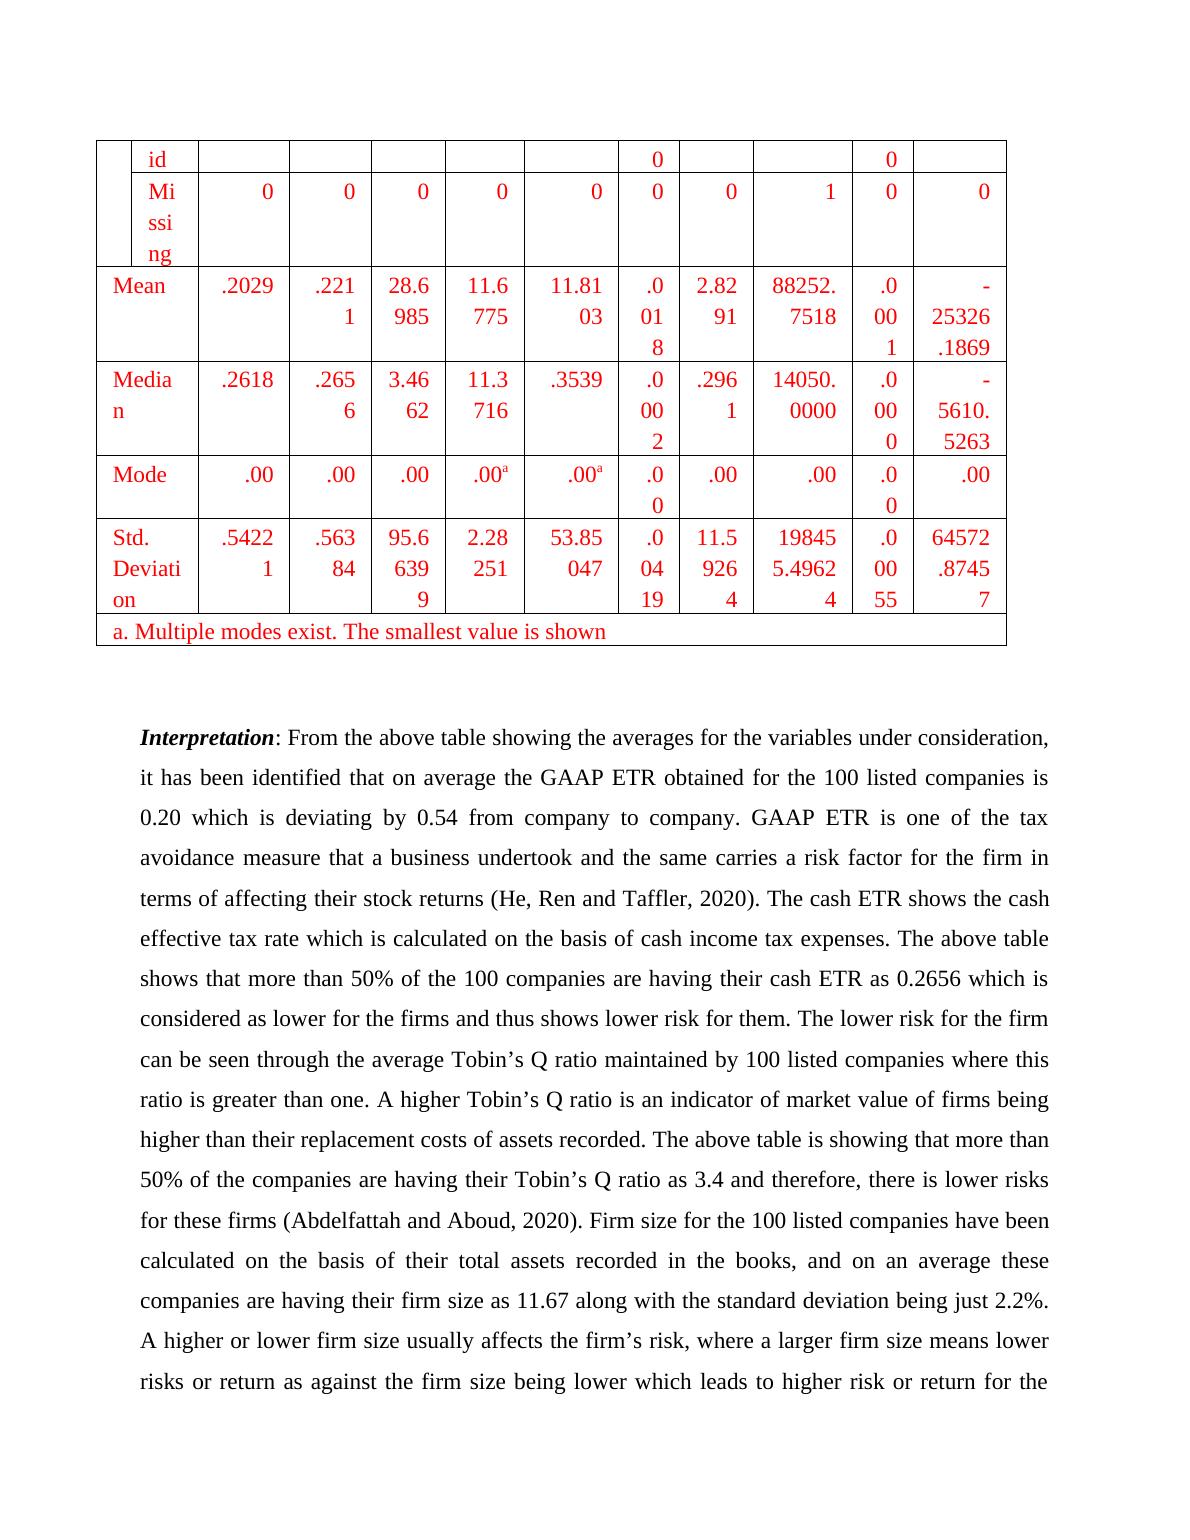
This study analyzes the impact of tax avoidance on firm risk in the UK through statistical analysis of data from 100 listed companies. The findings reveal correlations between GAAP ETR, Cash ETR, BTD, Tobin’s Q ratio, firm size, fixed assets, ROA, Debt, Leverage and NOL. Descriptive statistics, correlation, regression, ANOVA test and frequencies have been used to determine the degree of relationship among the variables of interest. The study concludes that tax avoidance measures such as GAAP ETR and BTD carry a risk factor for the firm in terms of affecting their stock returns.

The Effect of Tax Avoidance on Firm Risk in the UK

   Added on 2023-06-07

ShareRelated Documents
The effect of tax avoidance on
firm risk in the UK
The Effect of Tax Avoidance on Firm Risk in the UK_1
Table of Contents
FINDINGS & ANALYSIS..............................................................................................................3
REFERENCES..............................................................................................................................17
Books and Journals....................................................................................................................17
The Effect of Tax Avoidance on Firm Risk in the UK_2
FINDINGS & ANALYSIS
In this chapter, the findings have been presented through the analysis of data pertaining to 100
listed companies. The findings have been obtained through the application of various statistical
tools and tests, which includes the following:
Descriptive statistics: Through descriptive statistics the characteristics or nature of data set have
been determined through generating the summary of the data set so that, better understanding
could be developed for further analysis and identification of relationship among the variables.
Through this statistical tool, the averages have been calculated for each & every variable along
with identification of how data set are deviating from the mean.
Correlation: This statistical tool will be used to determine the degree of relationship existing
among the variables of interest such as GAAP ETR, Cash ETR, BTD, Tobin’s Q ratio (stock
return), firm size, fixed assets, ROA, Debt, Leverage and NOL. This will be done to determine to
what extent does each of the variable can affect the Tobin’s Q ratio of the firm.
Regression: This statistical method will be applied to determine the character and strength of
relationship existing among a single dependent variable (Tobin’s Q ratio) and several other
variables which includes both independent & controlled variables such as Cash ETR, GAAP
ETR, BTD, firm size, etc.
ANOVA test: As the group of data involves more than three variables, the one – way ANOVA
test will be applied to determine whether there is any statistical significance lies between the
independent and dependent variable. In other words, whether independent or controlled variables
either in a group or individually affect the Tobin’s Q of the firm.
Frequencies
Statistics
GAA
P_ET
R
Cash
_ET
R
Tob
in_
Q
Firm
_Siz
e
Fixed
_Asse
ts
R
O
A
Deb
t
Levera
ge
N
O
L
BTD
N Val 100 100 100 100 100 10 100 99 10 100
The Effect of Tax Avoidance on Firm Risk in the UK_3
id 0 0
Mi
ssi
ng
0 0 0 0 0 0 0 1 0 0
Mean .2029 .221
1
28.6
985
11.6
775
11.81
03
.0
01
8
2.82
91
88252.
7518
.0
00
1
-
25326
.1869
Media
n
.2618 .265
6
3.46
62
11.3
716
.3539 .0
00
2
.296
1
14050.
0000
.0
00
0
-
5610.
5263
Mode .00 .00 .00 .00a .00a .0
0
.00 .00 .0
0
.00
Std.
Deviati
on
.5422
1
.563
84
95.6
639
9
2.28
251
53.85
047
.0
04
19
11.5
926
4
19845
5.4962
4
.0
00
55
64572
.8745
7
a. Multiple modes exist. The smallest value is shown
Interpretation: From the above table showing the averages for the variables under consideration,
it has been identified that on average the GAAP ETR obtained for the 100 listed companies is
0.20 which is deviating by 0.54 from company to company. GAAP ETR is one of the tax
avoidance measure that a business undertook and the same carries a risk factor for the firm in
terms of affecting their stock returns (He, Ren and Taffler, 2020). The cash ETR shows the cash
effective tax rate which is calculated on the basis of cash income tax expenses. The above table
shows that more than 50% of the 100 companies are having their cash ETR as 0.2656 which is
considered as lower for the firms and thus shows lower risk for them. The lower risk for the firm
can be seen through the average Tobin’s Q ratio maintained by 100 listed companies where this
ratio is greater than one. A higher Tobin’s Q ratio is an indicator of market value of firms being
higher than their replacement costs of assets recorded. The above table is showing that more than
50% of the companies are having their Tobin’s Q ratio as 3.4 and therefore, there is lower risks
for these firms (Abdelfattah and Aboud, 2020). Firm size for the 100 listed companies have been
calculated on the basis of their total assets recorded in the books, and on an average these
companies are having their firm size as 11.67 along with the standard deviation being just 2.2%.
A higher or lower firm size usually affects the firm’s risk, where a larger firm size means lower
risks or return as against the firm size being lower which leads to higher risk or return for the
The Effect of Tax Avoidance on Firm Risk in the UK_4

End of preview

Want to access all the pages? Upload your documents or become a member.

Related Documents
SPSS Data Collection - Assignment
|11
|1734
|19

Regression Analysis in SPSS
|16
|1866
|25

Steps to Perform Regression Analysis
|4
|717
|426

Statistical Analysis of Room Prices in UK Hotels
|7
|530
|140

Analytical Methods for Monthly Prices of Index and Stock
|8
|660
|98

Statistics | ANOVA | Assignment
|11
|724
|26