Statistics for Business Decision
Added on 2023-03-24
15 Pages2799 Words48 Views
Statistics for Business Decision

TABLE OF CONTENTS
INTRODUCTION...........................................................................................................................1
TASK 1............................................................................................................................................1
1. Assessing mean, median, mode, range, variance and standard deviation for each business...1
2...................................................................................................................................................2
a. Stating frequency and relative distribution for each business type construct..........................2
b. Presenting a relative frequency histogram...............................................................................2
3. Discussing results....................................................................................................................2
4. Testing significant differences in the starting cost of each type of business...........................3
TASK 2............................................................................................................................................6
1. Presenting output with the estimated regression equation.......................................................6
2. Stating the extent to which model fits to the data....................................................................7
3. Testing hypothesis by considering both dependent and independent variables......................8
4. Interpreting individual slope coefficients................................................................................9
5. Constructing 95% confidence interval for the slope coefficient of individual variables........9
6. Testing estimated slope coefficients........................................................................................9
7. Re-estimation of model by removing all insignificant variables.............................................9
8. Predicting annual sales for franchisee...................................................................................11
CONCLUSION..............................................................................................................................11
REFERENCES..............................................................................................................................12
INTRODUCTION
In the present era, business units lay high level of emphasis on using statistical tools for
effectual decision making. Moreover, statistical tools and techniques help in summarizing the
large data set and thereby give input for the development of competent as well as strategic
framework. The present report is based on different case situations which will provide deeper
insight about the manner in which regression and T test helps in finding significant differences
between the assessed variables. It will also shed light on the ways through which analyst can
assess insignificant variable and re-estimate the effectual one.
TASK 1
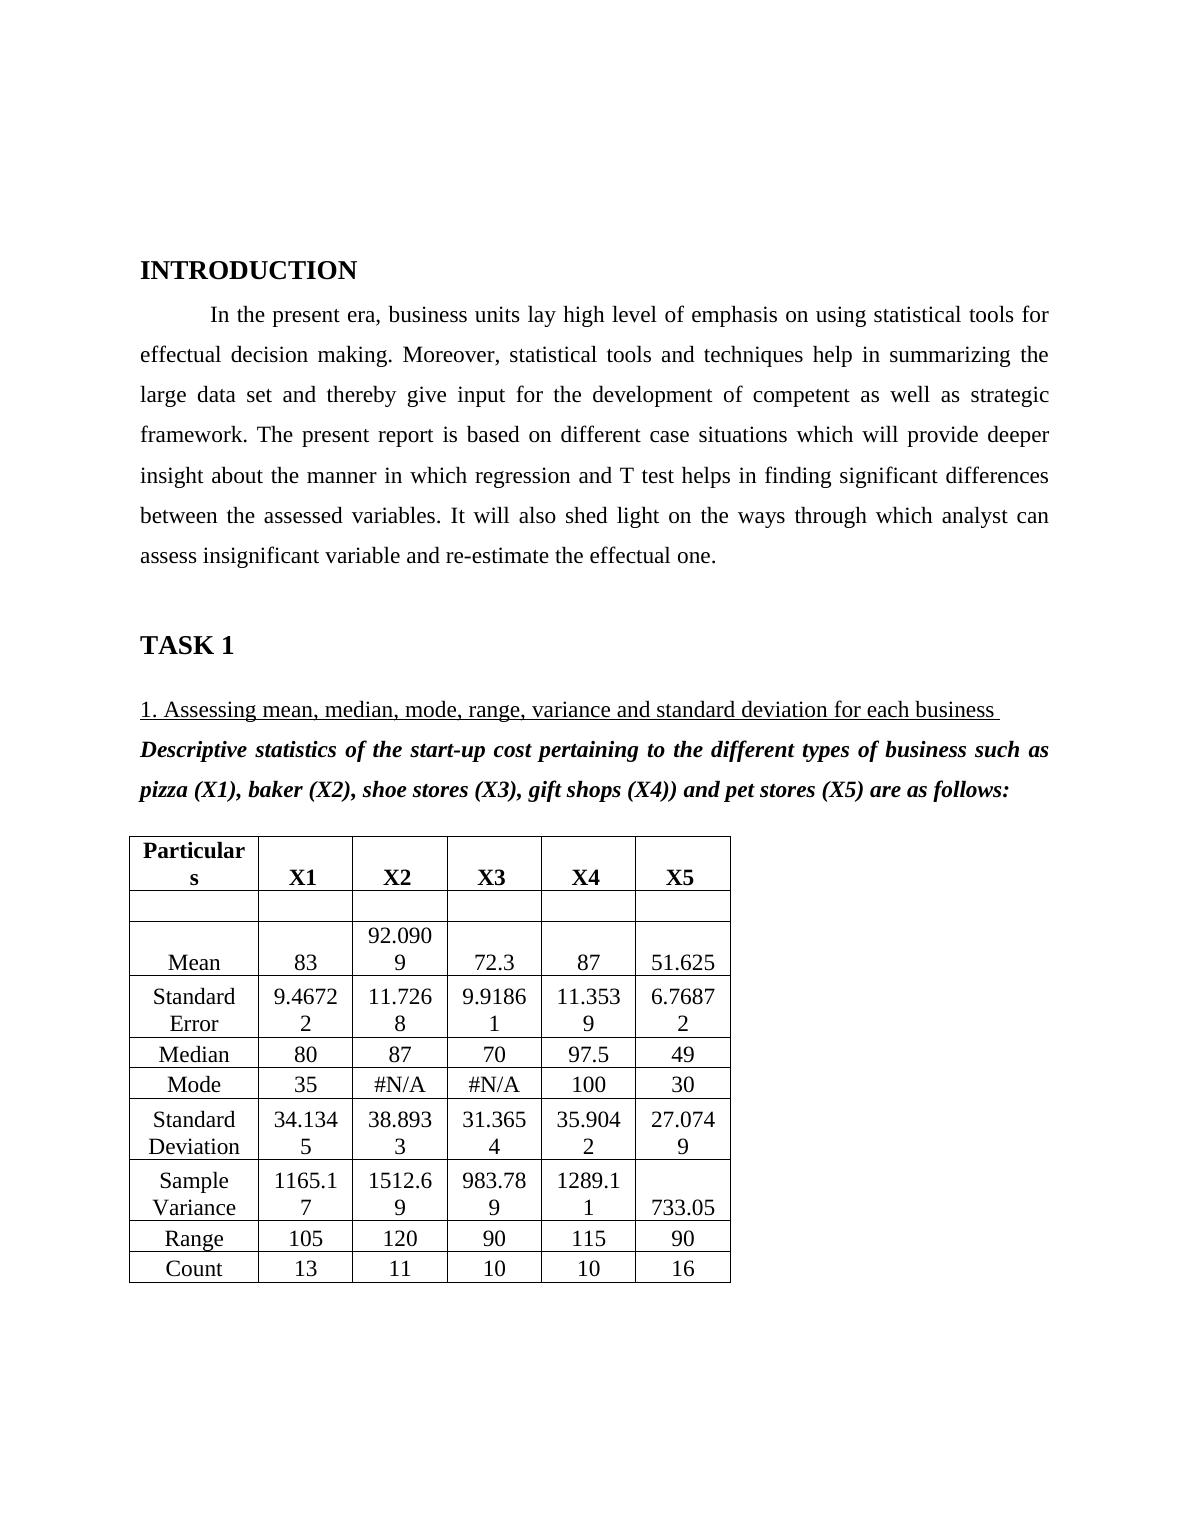
1. Assessing mean, median, mode, range, variance and standard deviation for each business
Descriptive statistics of the start-up cost pertaining to the different types of business such as
pizza (X1), baker (X2), shoe stores (X3), gift shops (X4)) and pet stores (X5) are as follows:
Particular
s X1 X2 X3 X4 X5
Mean 83
92.090
9 72.3 87 51.625
Standard
Error
9.4672
2
11.726
8
9.9186
1
11.353
9
6.7687
2
Median 80 87 70 97.5 49
Mode 35 #N/A #N/A 100 30
Standard
Deviation
34.134
5
38.893
3
31.365
4
35.904
2
27.074
9
Sample
Variance
1165.1
7
1512.6
9
983.78
9
1289.1
1 733.05
Range 105 120 90 115 90
Count 13 11 10 10 16
In the present era, business units lay high level of emphasis on using statistical tools for
effectual decision making. Moreover, statistical tools and techniques help in summarizing the
large data set and thereby give input for the development of competent as well as strategic
framework. The present report is based on different case situations which will provide deeper
insight about the manner in which regression and T test helps in finding significant differences
between the assessed variables. It will also shed light on the ways through which analyst can
assess insignificant variable and re-estimate the effectual one.
TASK 1
1. Assessing mean, median, mode, range, variance and standard deviation for each business
Descriptive statistics of the start-up cost pertaining to the different types of business such as
pizza (X1), baker (X2), shoe stores (X3), gift shops (X4)) and pet stores (X5) are as follows:
Particular
s X1 X2 X3 X4 X5
Mean 83
92.090
9 72.3 87 51.625
Standard
Error
9.4672
2
11.726
8
9.9186
1
11.353
9
6.7687
2
Median 80 87 70 97.5 49
Mode 35 #N/A #N/A 100 30
Standard
Deviation
34.134
5
38.893
3
31.365
4
35.904
2
27.074
9
Sample
Variance
1165.1
7
1512.6
9
983.78
9
1289.1
1 733.05
Range 105 120 90 115 90
Count 13 11 10 10 16
2.
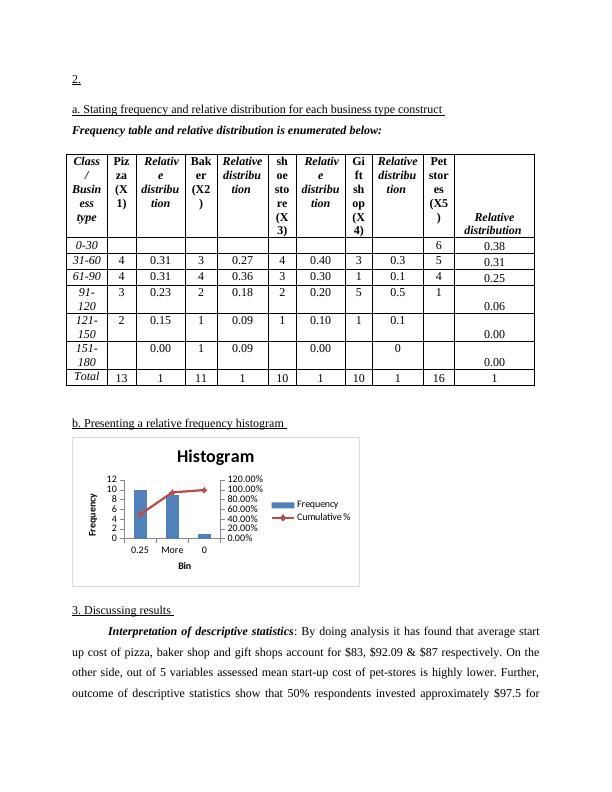
a. Stating frequency and relative distribution for each business type construct
Frequency table and relative distribution is enumerated below:
Class
/
Busin
ess
type
Piz
za
(X
1)
Relativ
e
distribu
tion
Bak
er
(X2
)
Relative
distribu
tion
sh
oe
sto
re
(X
3)
Relativ
e
distribu
tion
Gi
ft
sh
op
(X
4)
Relative
distribu
tion
Pet
stor
es
(X5
) Relative
distribution
0-30 6 0.38
31-60 4 0.31 3 0.27 4 0.40 3 0.3 5 0.31
61-90 4 0.31 4 0.36 3 0.30 1 0.1 4 0.25
91-
120
3 0.23 2 0.18 2 0.20 5 0.5 1
0.06
121-
150
2 0.15 1 0.09 1 0.10 1 0.1
0.00
151-
180
0.00 1 0.09 0.00 0
0.00
Total 13 1 11 1 10 1 10 1 16 1
b. Presenting a relative frequency histogram
0.25 More 0
0
2
4
6
8
10
12
0.00%
20.00%
40.00%
60.00%
80.00%
100.00%
120.00%
Histogram
Frequency
Cumulative %
Bin
Frequency
3. Discussing results
Interpretation of descriptive statistics: By doing analysis it has found that average start
up cost of pizza, baker shop and gift shops account for $83, $92.09 & $87 respectively. On the
other side, out of 5 variables assessed mean start-up cost of pet-stores is highly lower. Further,
outcome of descriptive statistics show that 50% respondents invested approximately $97.5 for
End of preview
Want to access all the pages? Upload your documents or become a member.
Related Documents
Statistics for Business Decision Assignment Samplelg...
|15
|2576
|164
HI6007 Statistics and Research Methods for Businesslg...
|10
|1180
|65
Descriptive Statistics Name of the University Authorlg...
|11
|1247
|493
QUAN102 - Statistics In Business Assignmentlg...
|7
|1209
|67
Assignment on Statistics Of Costing Using MS Excellg...
|5
|1956
|202
Statistics HI6007 Group Assignmentlg...
|11
|662
|430