Econometrics: Time Series Analysis of Monetary Policy VAR Model
VerifiedAdded on 2023/06/16
|16
|1123
|479
Homework Assignment
AI Summary
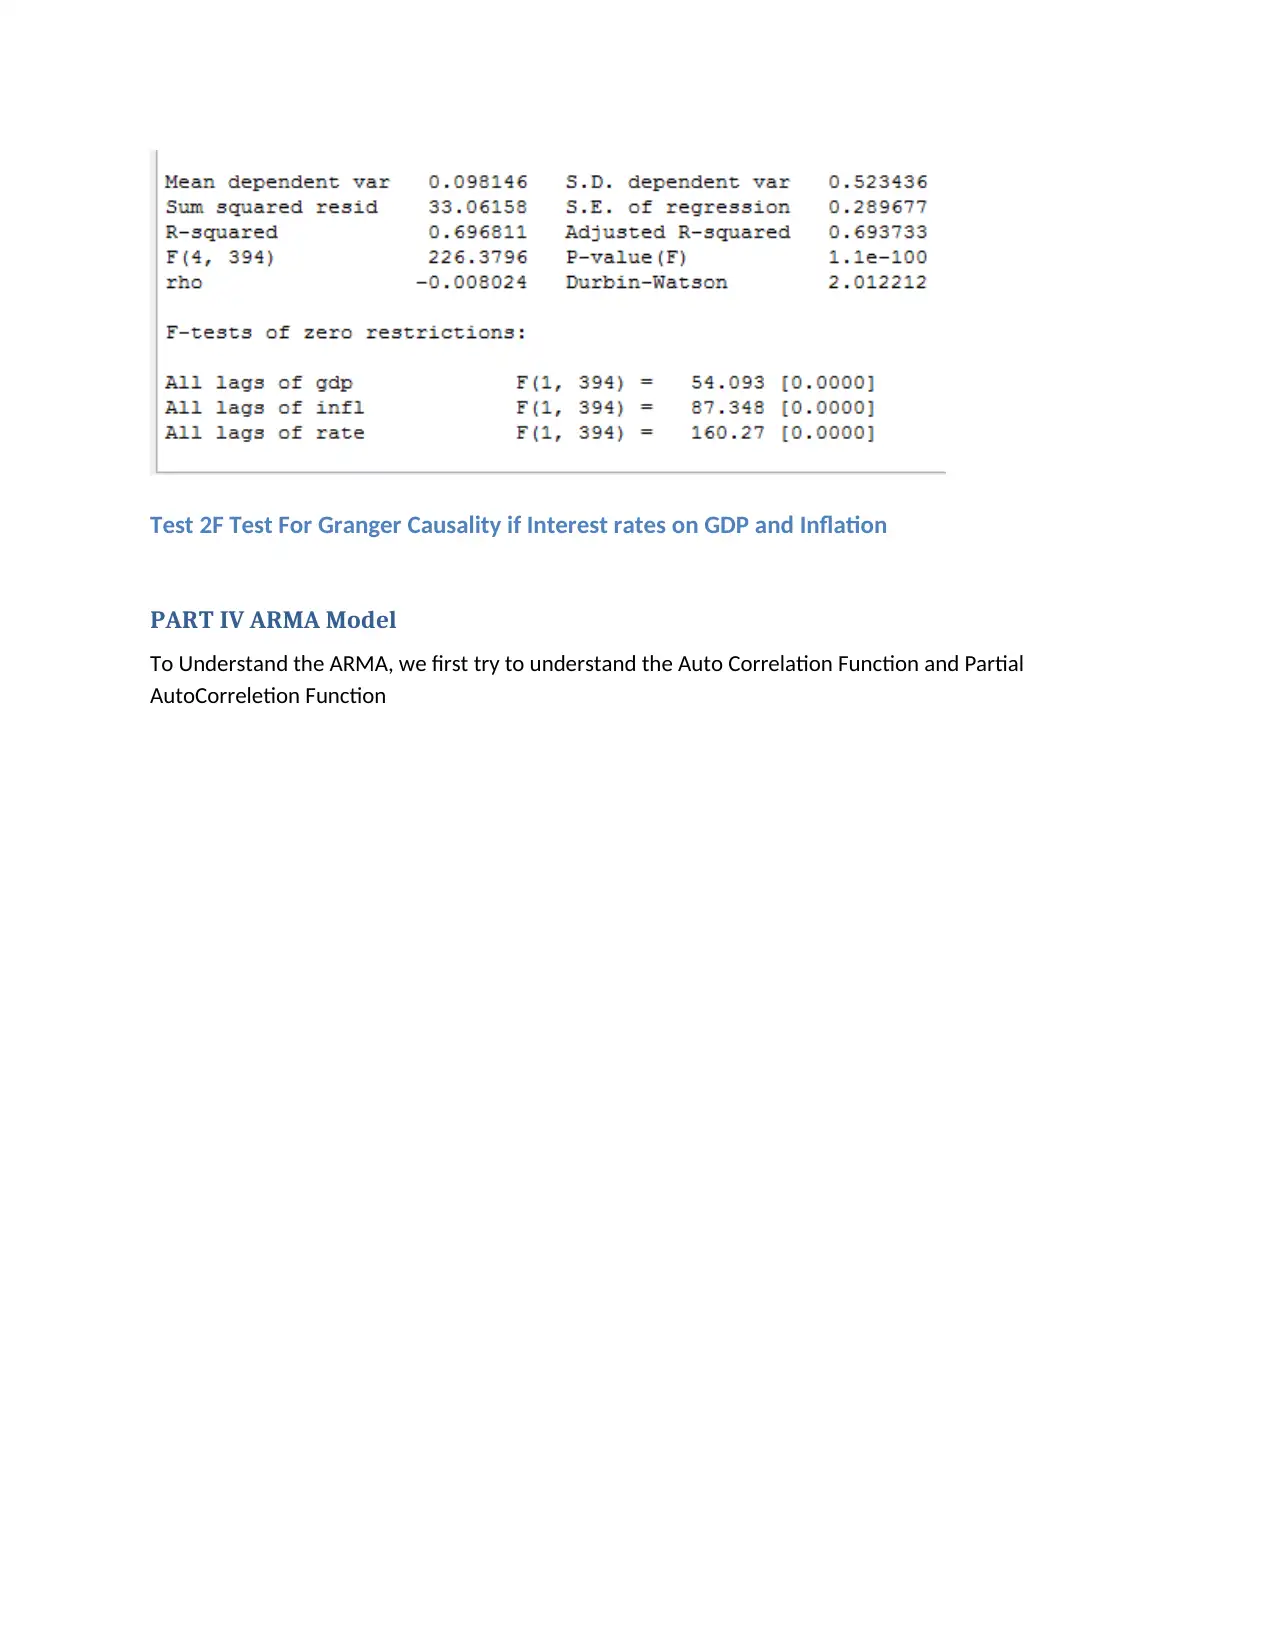
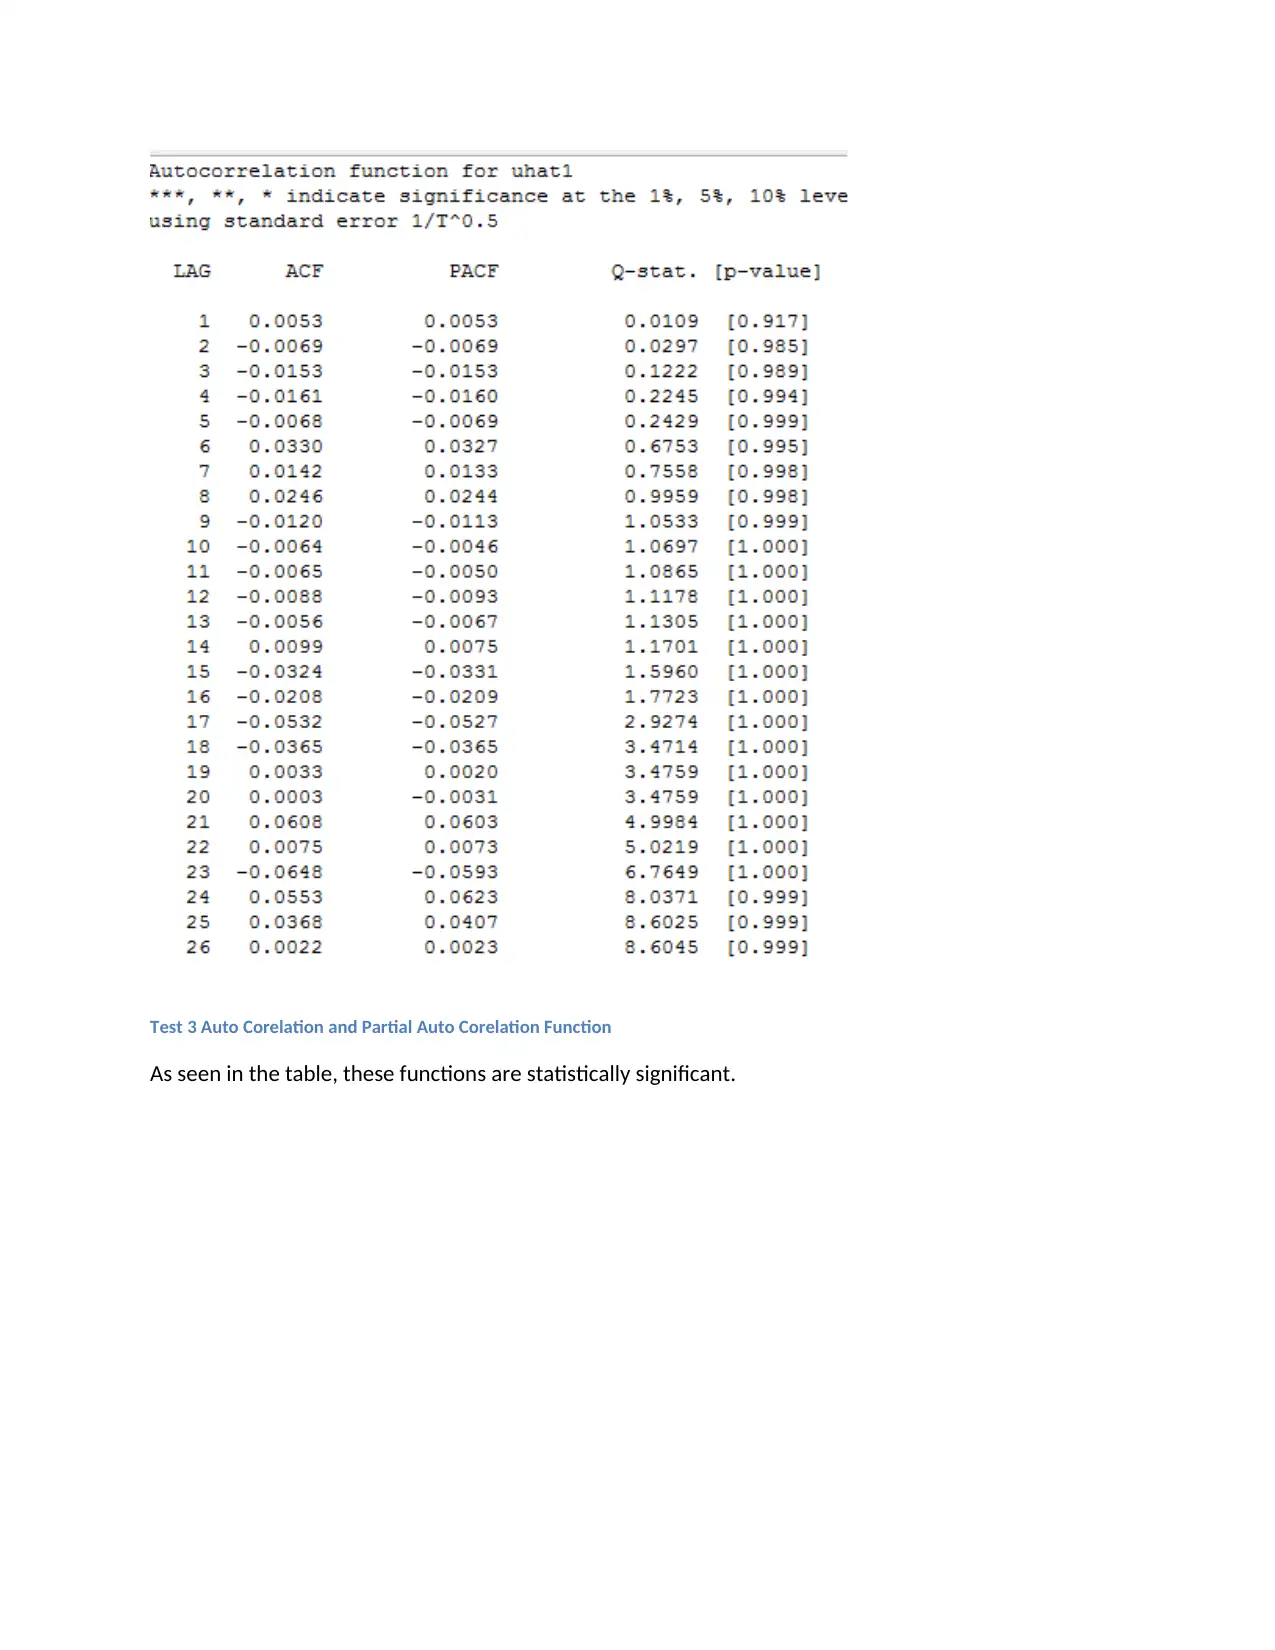
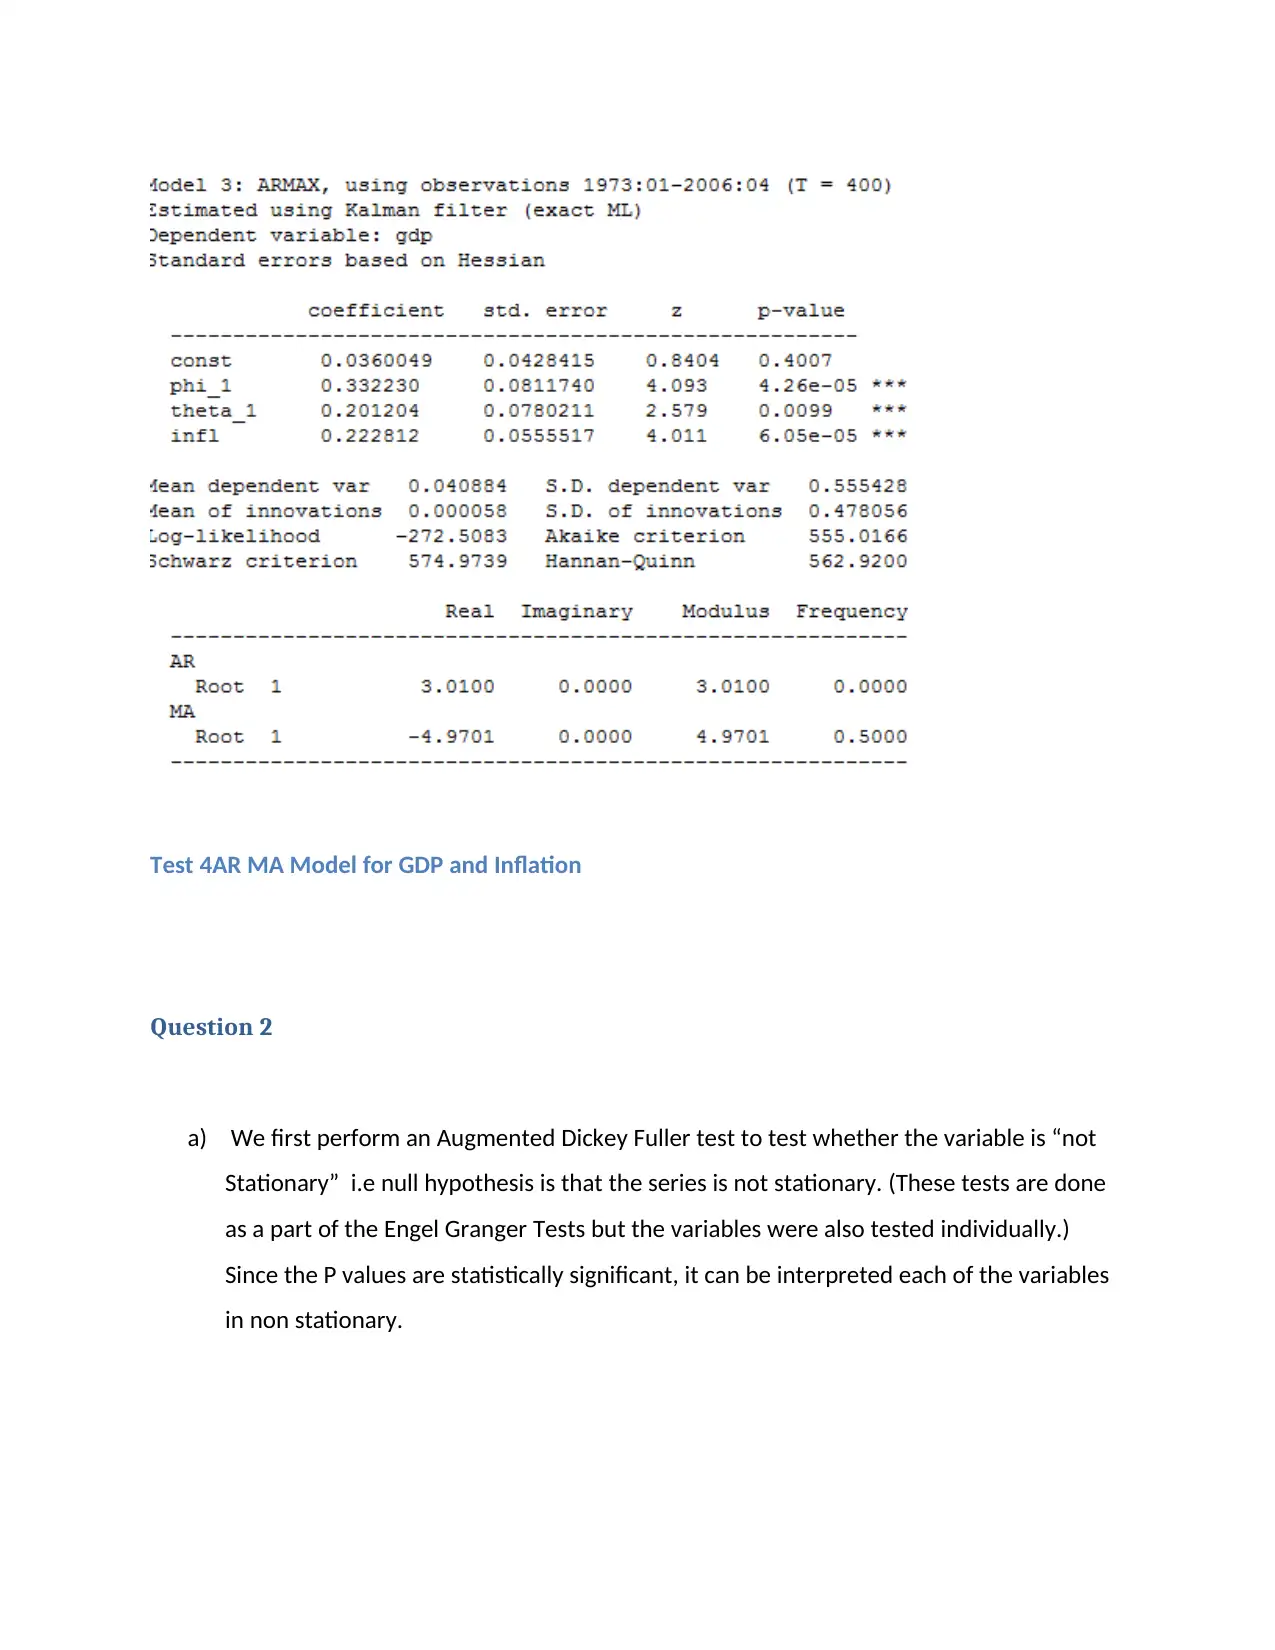
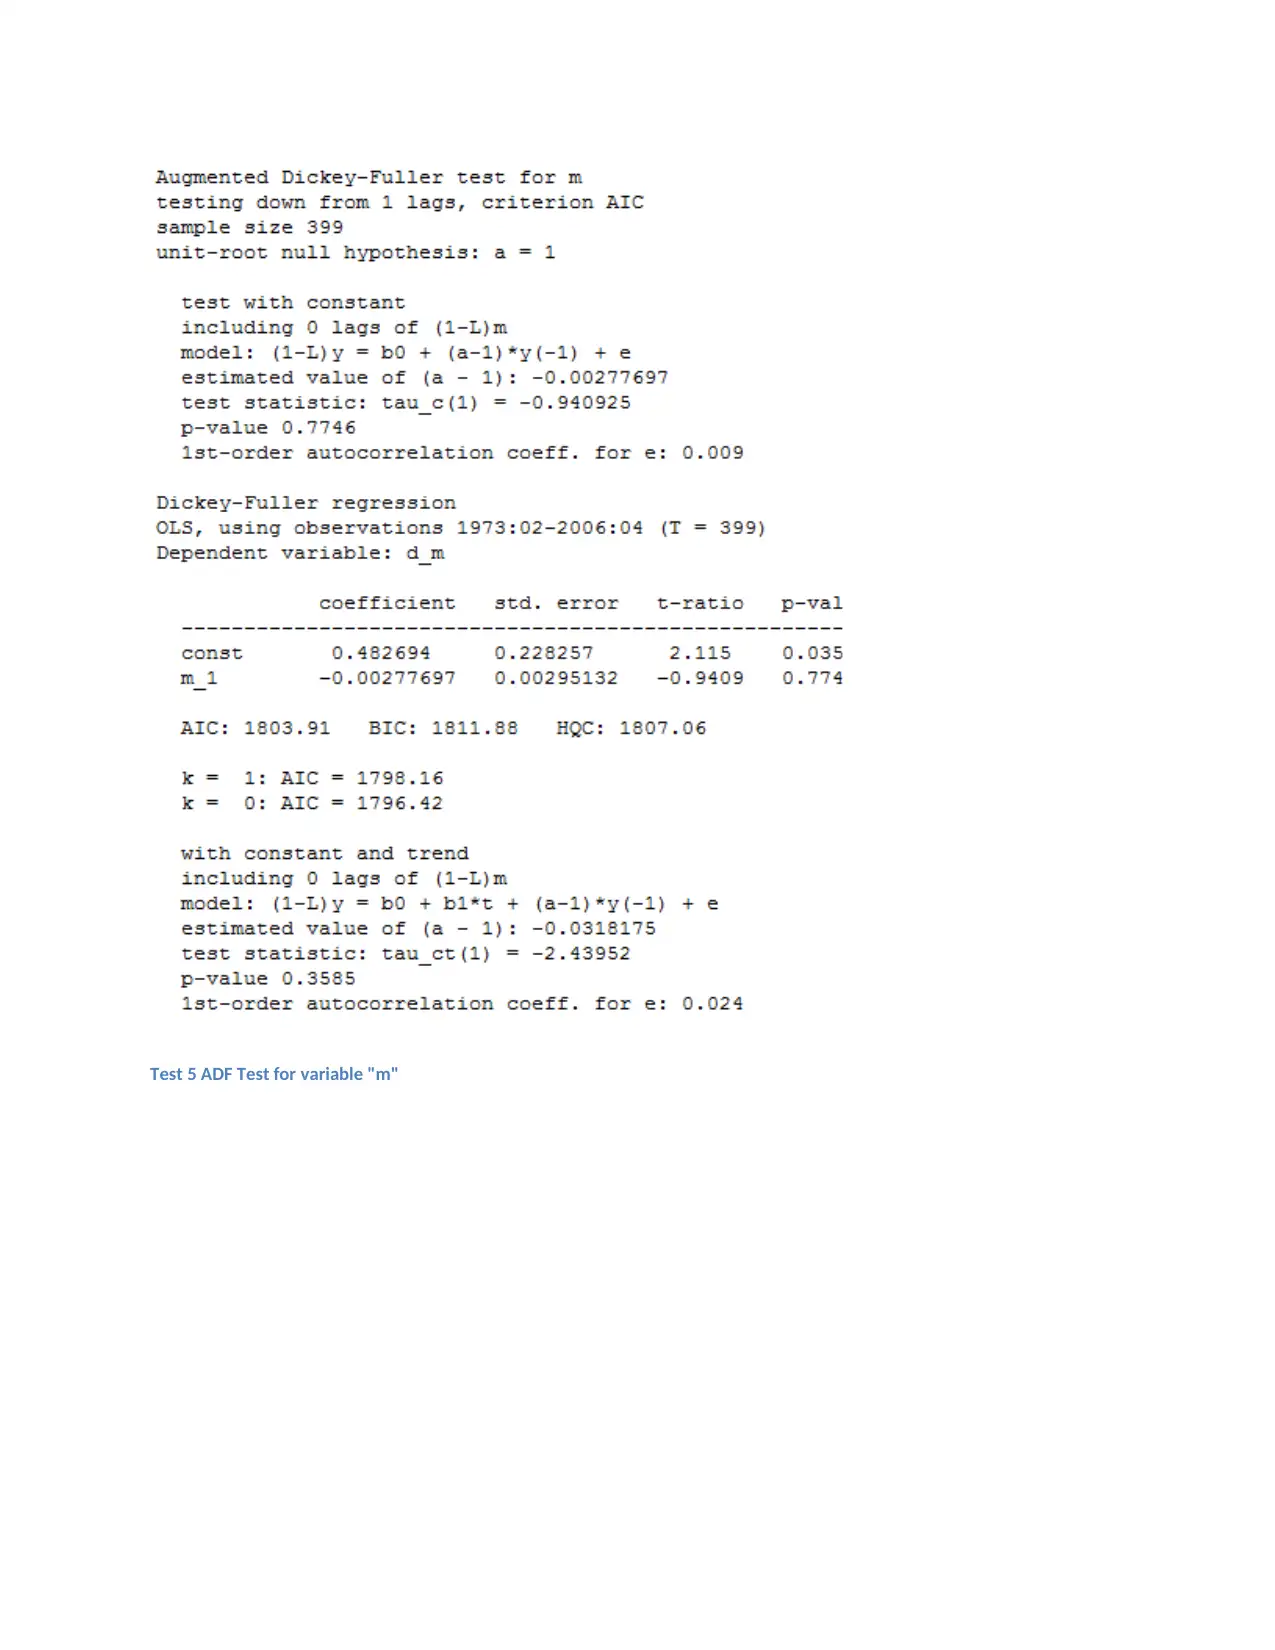
This assignment provides a comprehensive analysis of monetary policy transmission using a Vector Autoregression (VAR) model. It begins by assessing the stationarity of the time series data through visual inspection and formal tests like the Augmented Dickey-Fuller (ADF) and KPSS tests. The VAR model is constructed with appropriate lag selection, followed by structural analysis using impulse response functions to understand the dynamic interactions between GDP growth rate, inflation rate, and policy interest rate. Granger causality tests are performed to determine the causal relationships between the variables. Additionally, an ARMA model is employed, and cointegration tests, such as the Engle-Granger test, are conducted to assess the long-run equilibrium relationships between variables. The analysis includes interpretations of the impulse responses, Granger causality test results, and cointegration test outcomes, providing insights into the transmission mechanism of monetary policy.
1 out of 16


Your All-in-One AI-Powered Toolkit for Academic Success.
+13062052269
info@desklib.com
Available 24*7 on WhatsApp / Email
![[object Object]](/_next/static/media/star-bottom.7253800d.svg)
Copyright © 2020–2025 A2Z Services. All Rights Reserved. Developed and managed by ZUCOL.