Financial Evaluation of Unilever plc
VerifiedAdded on 2023/06/15
|29
|5833
|304
AI Summary
This report evaluates the financial position, financial performance, competitor position and the investment opportunity of Unilever plc. Financial evaluation over an organization is significant as it assists the company to make better decision about the position and the performance of the company. The report explains that the financial performance of the company could be analyzed on the basis of annual report, financial statements of the company, stock price of the company, competitor position of the company and the worth of the company.
Contribute Materials
Your contribution can guide someone’s learning journey. Share your
documents today.
Running Head: Finance
1
Project Report: Finance
1
Project Report: Finance
Secure Best Marks with AI Grader
Need help grading? Try our AI Grader for instant feedback on your assignments.
Finance
2
Contents
Introduction.......................................................................................................................4
Company overview...........................................................................................................4
Financial performance and financial position...................................................................4
Profitability ratio...........................................................................................................5
Return on shareholder’s fund....................................................................................5
Operating profit margin............................................................................................6
Gross profit margin...................................................................................................7
Liquidity ratio...............................................................................................................8
(Morningstar, 2018)..................................................................................................8
Current ratio..............................................................................................................8
Acid Test ratio..........................................................................................................9
Efficiency ratio...........................................................................................................11
Receivable collection period...................................................................................11
Payable payment days.............................................................................................12
Inventory days........................................................................................................13
Gearing ratio...............................................................................................................14
Investment ratio..........................................................................................................15
Earnings per share...................................................................................................16
Price earnings ratio.................................................................................................16
Initiative to enhance company’s performance................................................................17
Competitor’s stake in the company................................................................................18
Recommendation............................................................................................................19
References.......................................................................................................................21
Appendix.........................................................................................................................23
Finance
3
Figure 1: return on shareholders’ Fund............................................................................6
Figure 2: Operating profit margin.....................................................................................7
Figure 3: Gross Profit margin...........................................................................................8
Figure 4: Current ratio......................................................................................................9
Figure 5: Acid Test Ratio...............................................................................................10
Figure 6: Receivable collection period...........................................................................12
Figure 7: Payable collection period................................................................................13
Figure 8: Inventory days.................................................................................................14
Figure 9: Gearing ratio....................................................................................................15
Figure 10: Earnings per share.........................................................................................16
Finance
4
Introduction:
This report paper has been prepared to evaluate the financial position, financial
performance, competitor position and the investment opportunity of Unilever plc. Financial
evaluation over an organization is significant as it assists the company to make better
decision about the position and the performance of the company. This report explains that it
becomes easier for the company and the stakeholders of the company to evaluate the position
of the organization and make better conclusion about the position, investment opportunity
and performance of the company. Further, it explains that the financial performance of the
company could be analyzed on the basis of annual report, financial statements of the
company, stock price of the company, competitor position of the company and the worth of
the company.
For this report, financial data of Unilever plc of last 5 years have been analyzed and
the ratio study has been conducted. Further, the competitors financial performance has been
compare with the financial performance of Uniliver plc and lastly, the stock performance and
the investment opportunity of the company has been evaluated.
Company overview:
Unilever plc is one of the fastest growing organizations in consumer goods market.
This company operates its business through foods, home care, personal care refreshment
segment etc. The company has diversified its market among 112 countries and the market
share of the company is huge. Personal segment of the company provides hair care and
skincare products, oral care products and deodorants. Food segment provides sauces, soup,
mayonnaise, margarines, salad dressings, spreads etc. the company has been founded in 1885.
Headquarter of the company is in London, UK (Home, 2018). The financial performance and
the position expresses about various positive and impressive changes into the organization.
Financial performance and financial position:
Financial performance and financial position of an organization could be evaluated
and measured through the financial statement and the market worth of the company.
Basically, it is a process in which the results of an organization are measured through
identifying the policies and the activities of the company in monetary terms (Davies and
Secure Best Marks with AI Grader
Need help grading? Try our AI Grader for instant feedback on your assignments.
Finance
5
Crawford, 2011). The study of financial performance and position of the Unilever plc is as
follows:
Profitability ratio:
Profitability ratio of the company has been evaluated firstly to identify the financial
performance and position of the company. Profitability ratios are the measurement of profit
position of the company. This explains about the profitability capacity of the company.
Following is the calculations of profitability ratio of the company:
Description Formula Unilever Plc
2017 2016 2015 2014
201
3
Profitabilit
y
Return on
shareholder
funds
NPAT/
Total
equity 31.70% 31.80% 37.88% 33.76%
29.5
5%
Operating
profit
margin
Operating
net profit /
Sales
100.00
% 100.00% 100.00% 100.00%
100.
00%
Gross Profit
Margin
Gross
Profit /
Sales 50.00% 50.00% 50.00% 50.00%
50.0
0%
(Breuer, Rieger and Soypak, 2014)
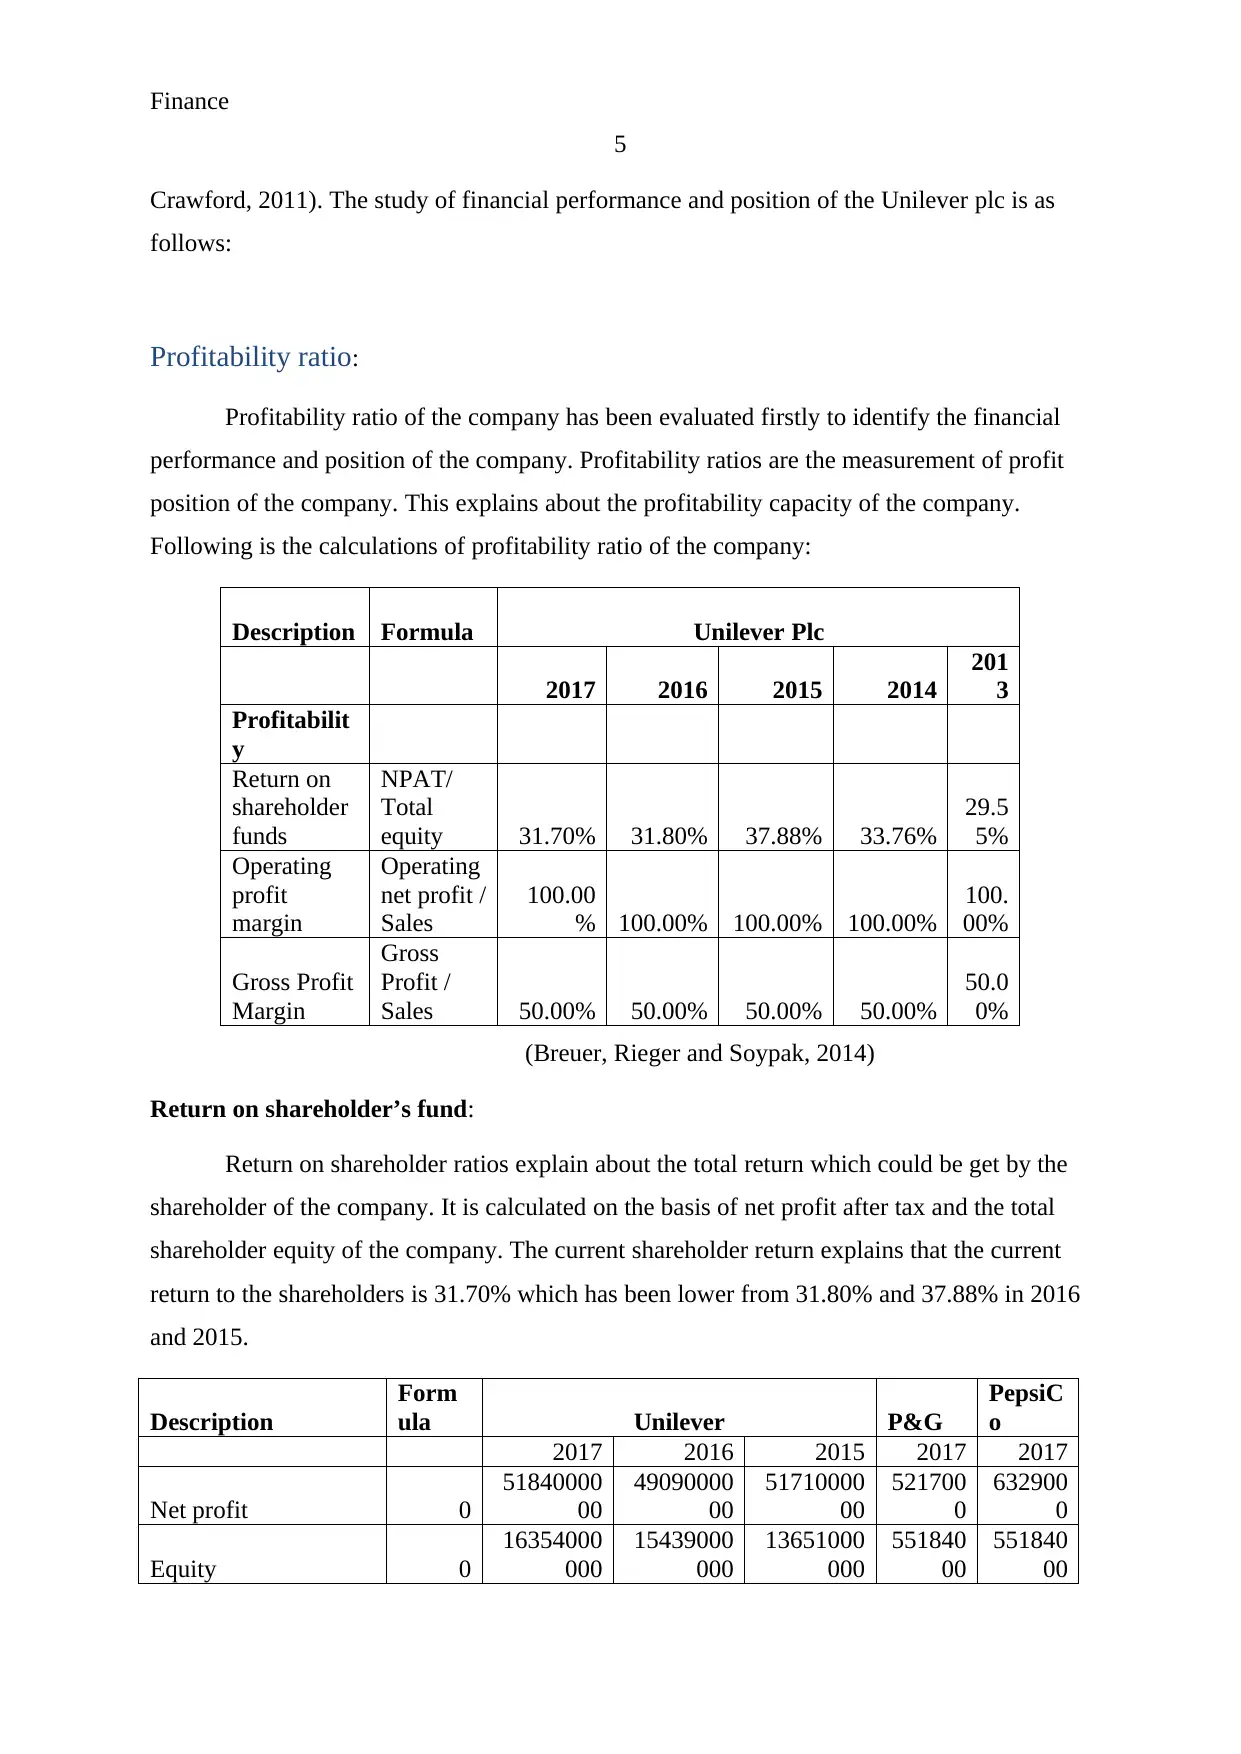
Return on shareholder’s fund:
Return on shareholder ratios explain about the total return which could be get by the
shareholder of the company. It is calculated on the basis of net profit after tax and the total
shareholder equity of the company. The current shareholder return explains that the current
return to the shareholders is 31.70% which has been lower from 31.80% and 37.88% in 2016
and 2015.
Description
Form
ula Unilever P&G
PepsiC
o
2017 2016 2015 2017 2017
Net profit 0
51840000
00
49090000
00
51710000
00
521700
0
632900
0
Equity 0
16354000
000
15439000
000
13651000
000
551840
00
551840
00
5
Crawford, 2011). The study of financial performance and position of the Unilever plc is as
follows:
Profitability ratio:
Profitability ratio of the company has been evaluated firstly to identify the financial
performance and position of the company. Profitability ratios are the measurement of profit
position of the company. This explains about the profitability capacity of the company.
Following is the calculations of profitability ratio of the company:
Description Formula Unilever Plc
2017 2016 2015 2014
201
3
Profitabilit
y
Return on
shareholder
funds
NPAT/
Total
equity 31.70% 31.80% 37.88% 33.76%
29.5
5%
Operating
profit
margin
Operating
net profit /
Sales
100.00
% 100.00% 100.00% 100.00%
100.
00%
Gross Profit
Margin
Gross
Profit /
Sales 50.00% 50.00% 50.00% 50.00%
50.0
0%
(Breuer, Rieger and Soypak, 2014)
Return on shareholder’s fund:
Return on shareholder ratios explain about the total return which could be get by the
shareholder of the company. It is calculated on the basis of net profit after tax and the total
shareholder equity of the company. The current shareholder return explains that the current
return to the shareholders is 31.70% which has been lower from 31.80% and 37.88% in 2016
and 2015.
Description
Form
ula Unilever P&G
PepsiC
o
2017 2016 2015 2017 2017
Net profit 0
51840000
00
49090000
00
51710000
00
521700
0
632900
0
Equity 0
16354000
000
15439000
000
13651000
000
551840
00
551840
00
Finance
6
Return on shareholder
funds
NPAT/
Total
equity 31.70% 31.80% 37.88% 9.45% 11.47%
Figure 1: return on shareholders’ Fund
The return on shareholder of its competitive company, P&G and PepsiCo have been
evaluated and it has been found that the return on capital employed position of both the
companies are 9.45% and 56.28% which explains that the current position of the company is
quite competitive and it is according to the industry rules. It explains that the profitability
position of the company is quite better (Bodie, 2013).
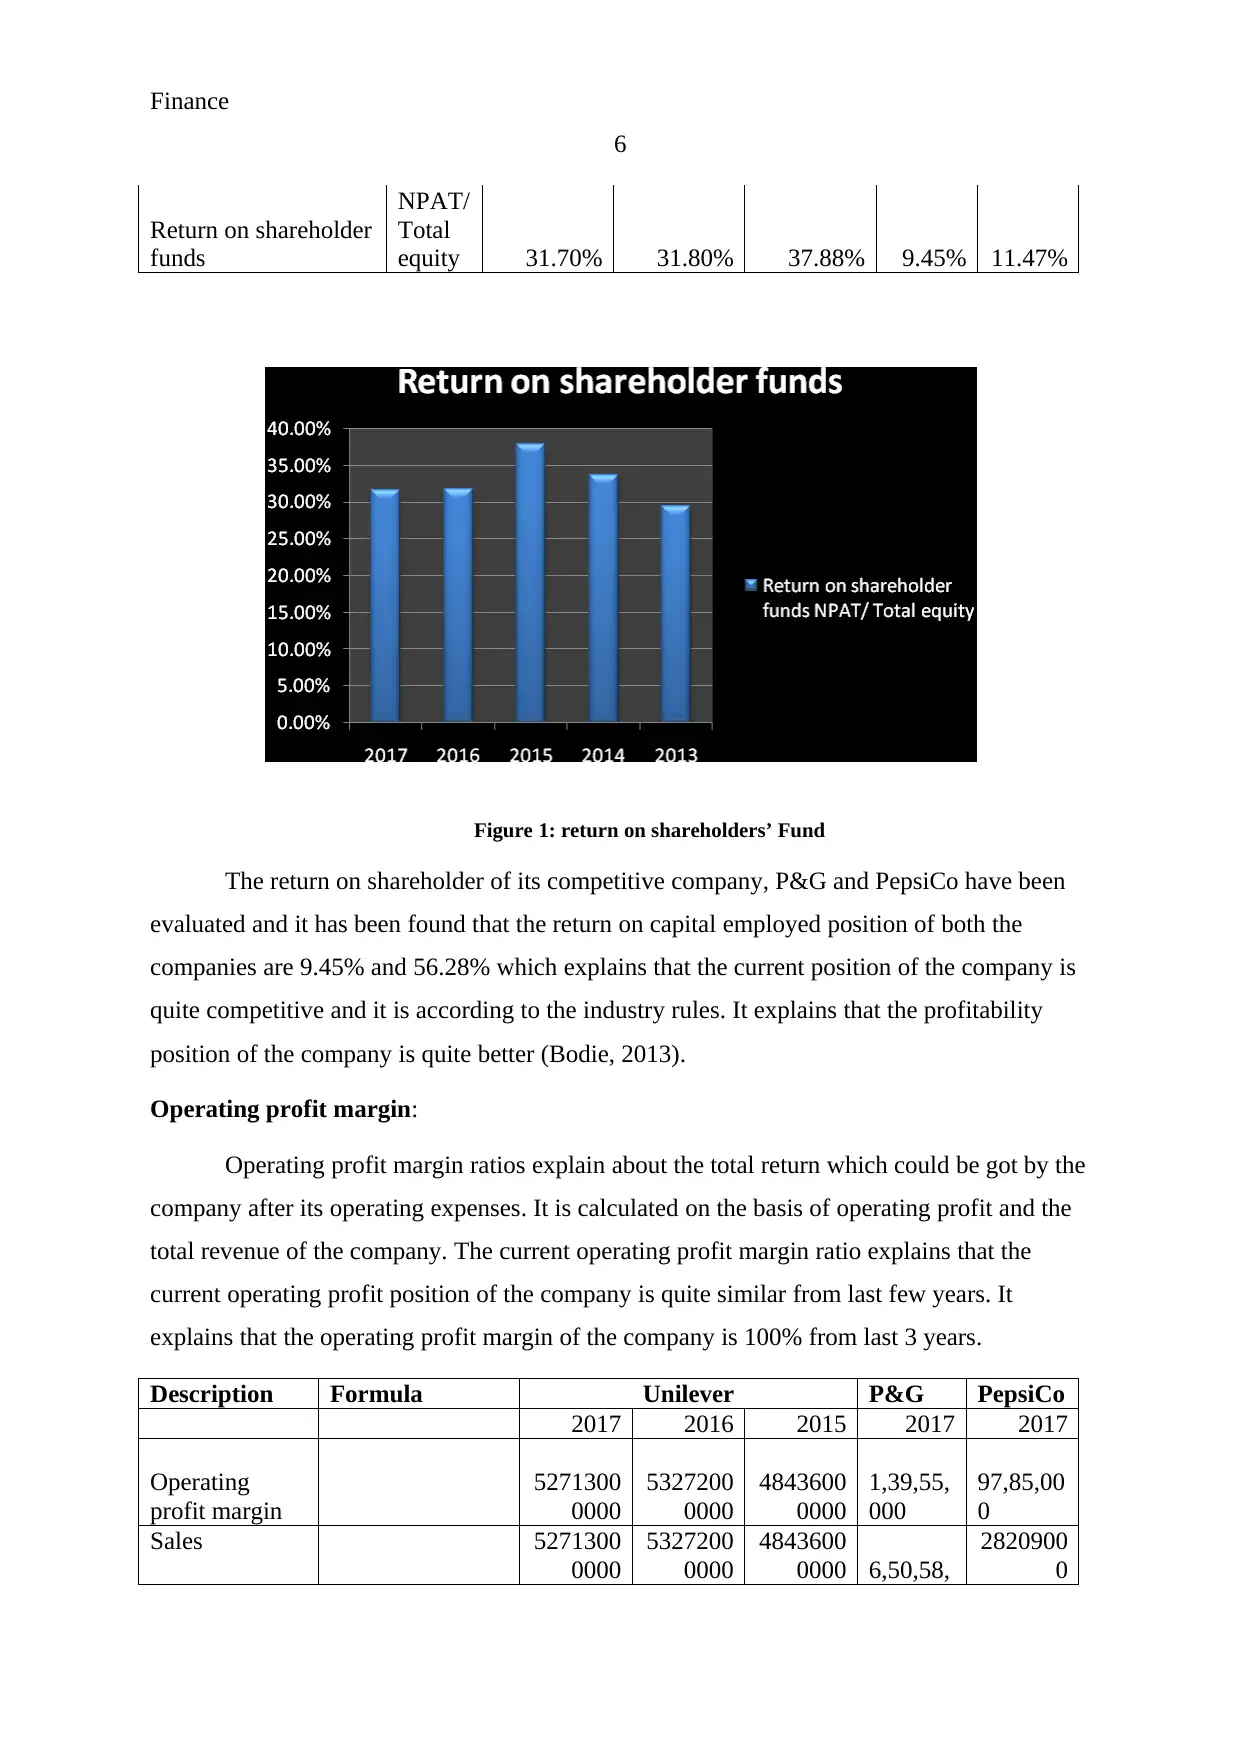
Operating profit margin:
Operating profit margin ratios explain about the total return which could be got by the
company after its operating expenses. It is calculated on the basis of operating profit and the
total revenue of the company. The current operating profit margin ratio explains that the
current operating profit position of the company is quite similar from last few years. It
explains that the operating profit margin of the company is 100% from last 3 years.
Description Formula Unilever P&G PepsiCo
2017 2016 2015 2017 2017
Operating
profit margin
5271300
0000
5327200
0000
4843600
0000
1,39,55,
000
97,85,00
0
Sales 5271300
0000
5327200
0000
4843600
0000 6,50,58,
2820900
0
6
Return on shareholder
funds
NPAT/
Total
equity 31.70% 31.80% 37.88% 9.45% 11.47%
Figure 1: return on shareholders’ Fund
The return on shareholder of its competitive company, P&G and PepsiCo have been
evaluated and it has been found that the return on capital employed position of both the
companies are 9.45% and 56.28% which explains that the current position of the company is
quite competitive and it is according to the industry rules. It explains that the profitability
position of the company is quite better (Bodie, 2013).
Operating profit margin:
Operating profit margin ratios explain about the total return which could be got by the
company after its operating expenses. It is calculated on the basis of operating profit and the
total revenue of the company. The current operating profit margin ratio explains that the
current operating profit position of the company is quite similar from last few years. It
explains that the operating profit margin of the company is 100% from last 3 years.
Description Formula Unilever P&G PepsiCo
2017 2016 2015 2017 2017
Operating
profit margin
5271300
0000
5327200
0000
4843600
0000
1,39,55,
000
97,85,00
0
Sales 5271300
0000
5327200
0000
4843600
0000 6,50,58,
2820900
0
Finance
7
000
Operating
profit margin
Operating net
profit / Sales 100.00% 100.00% 100.00% 21.45% 34.69%
Figure 2: Operating profit margin
The operating profit position of company has been evaluated with its competitive
company, P&G and PepsiCo and it has been found that the operating profit margin position
of both the companies are 21.45% and 15.58% which explains that the current position of the
company is quite competitive and quite higher than all the competitive companies. It explains
that the profitability position of the company is quite better.
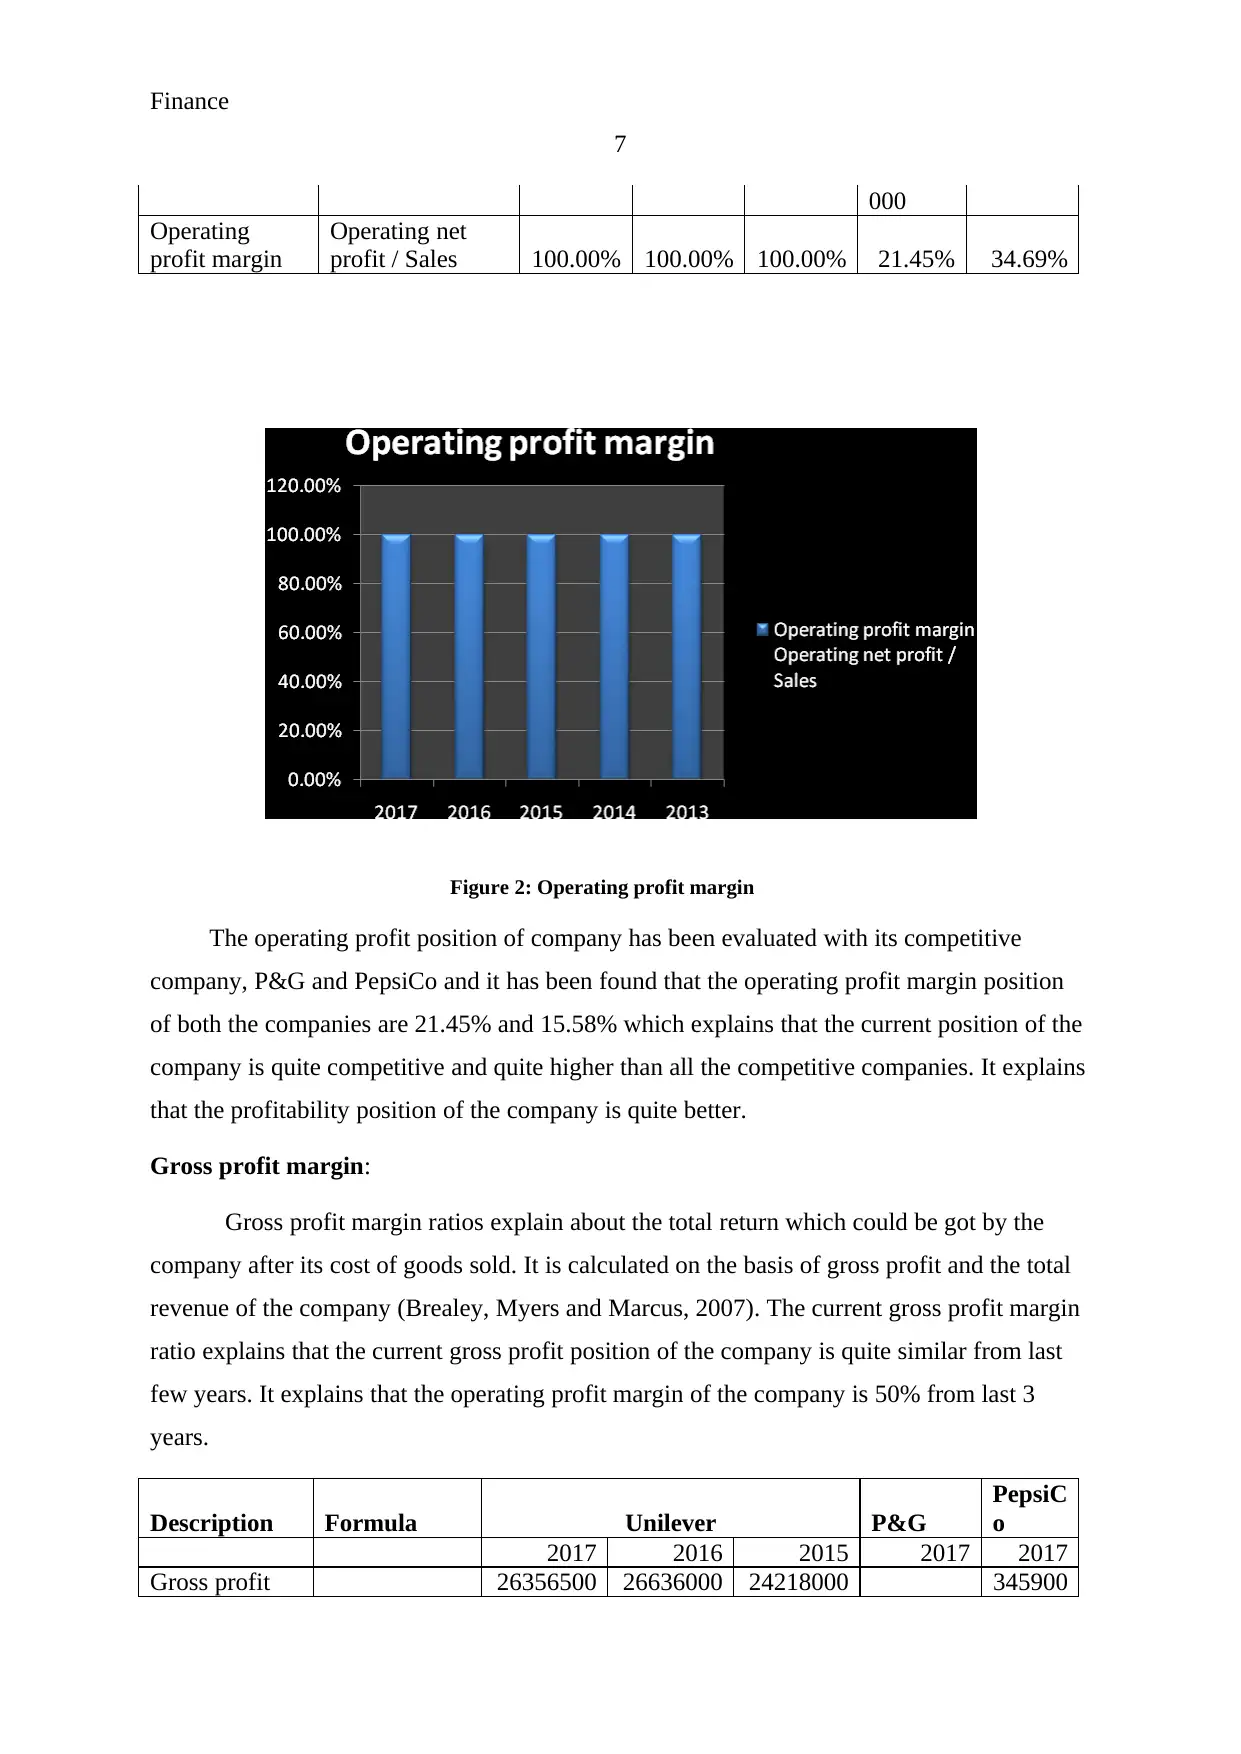
Gross profit margin:
Gross profit margin ratios explain about the total return which could be got by the
company after its cost of goods sold. It is calculated on the basis of gross profit and the total
revenue of the company (Brealey, Myers and Marcus, 2007). The current gross profit margin
ratio explains that the current gross profit position of the company is quite similar from last
few years. It explains that the operating profit margin of the company is 50% from last 3
years.
Description Formula Unilever P&G
PepsiC
o
2017 2016 2015 2017 2017
Gross profit 26356500 26636000 24218000 345900
7
000
Operating
profit margin
Operating net
profit / Sales 100.00% 100.00% 100.00% 21.45% 34.69%
Figure 2: Operating profit margin
The operating profit position of company has been evaluated with its competitive
company, P&G and PepsiCo and it has been found that the operating profit margin position
of both the companies are 21.45% and 15.58% which explains that the current position of the
company is quite competitive and quite higher than all the competitive companies. It explains
that the profitability position of the company is quite better.
Gross profit margin:
Gross profit margin ratios explain about the total return which could be got by the
company after its cost of goods sold. It is calculated on the basis of gross profit and the total
revenue of the company (Brealey, Myers and Marcus, 2007). The current gross profit margin
ratio explains that the current gross profit position of the company is quite similar from last
few years. It explains that the operating profit margin of the company is 50% from last 3
years.
Description Formula Unilever P&G
PepsiC
o
2017 2016 2015 2017 2017
Gross profit 26356500 26636000 24218000 345900
Paraphrase This Document
Need a fresh take? Get an instant paraphrase of this document with our AI Paraphraser
Finance
8
000 000 000
3,25,23,0
00 00
Sales
52713000
000
53272000
000
48436000
000
6505800
0
282090
00
Gross Profit
Margin
Gross Profit /
Sales 50.00% 50.00% 50.00% 49.99%
122.62
%
Figure 3: Gross Profit margin
The gross profit position of company has been evaluated with its competitive
company, P&G and PepsiCo and it has been found that the gross profit margin position of
both the companies are 49.99% and 55.08% which explains that the current position of the
company is quite competitive (Barman, 2008). It explains that the profitability position of the
company is quite better and company is managing all its activities in better manner.
Liquidity ratio:
Liquidity ratio of the company has been evaluated further to identify the financial
performance and stability position of the company. Liquidity ratios are the measurement of
short term debt obligation of the company. This explains about the capacity of the company
to repay all the current borrowings. Following is the calculations of liquidity ratio of the
company:
Liquid
ity 2017 2016 2015 2014
201
3
Finance
9
Current
ratio
Current
assets/curre
nt liabilities 0.68 0.63 0.63 0.70 0.77
Acid
test
ratios
Current
assets-
Inventory/cu
rrent
liabilities 0.47 0.63 0.63 0.47 0.49
(Morningstar, 2018)
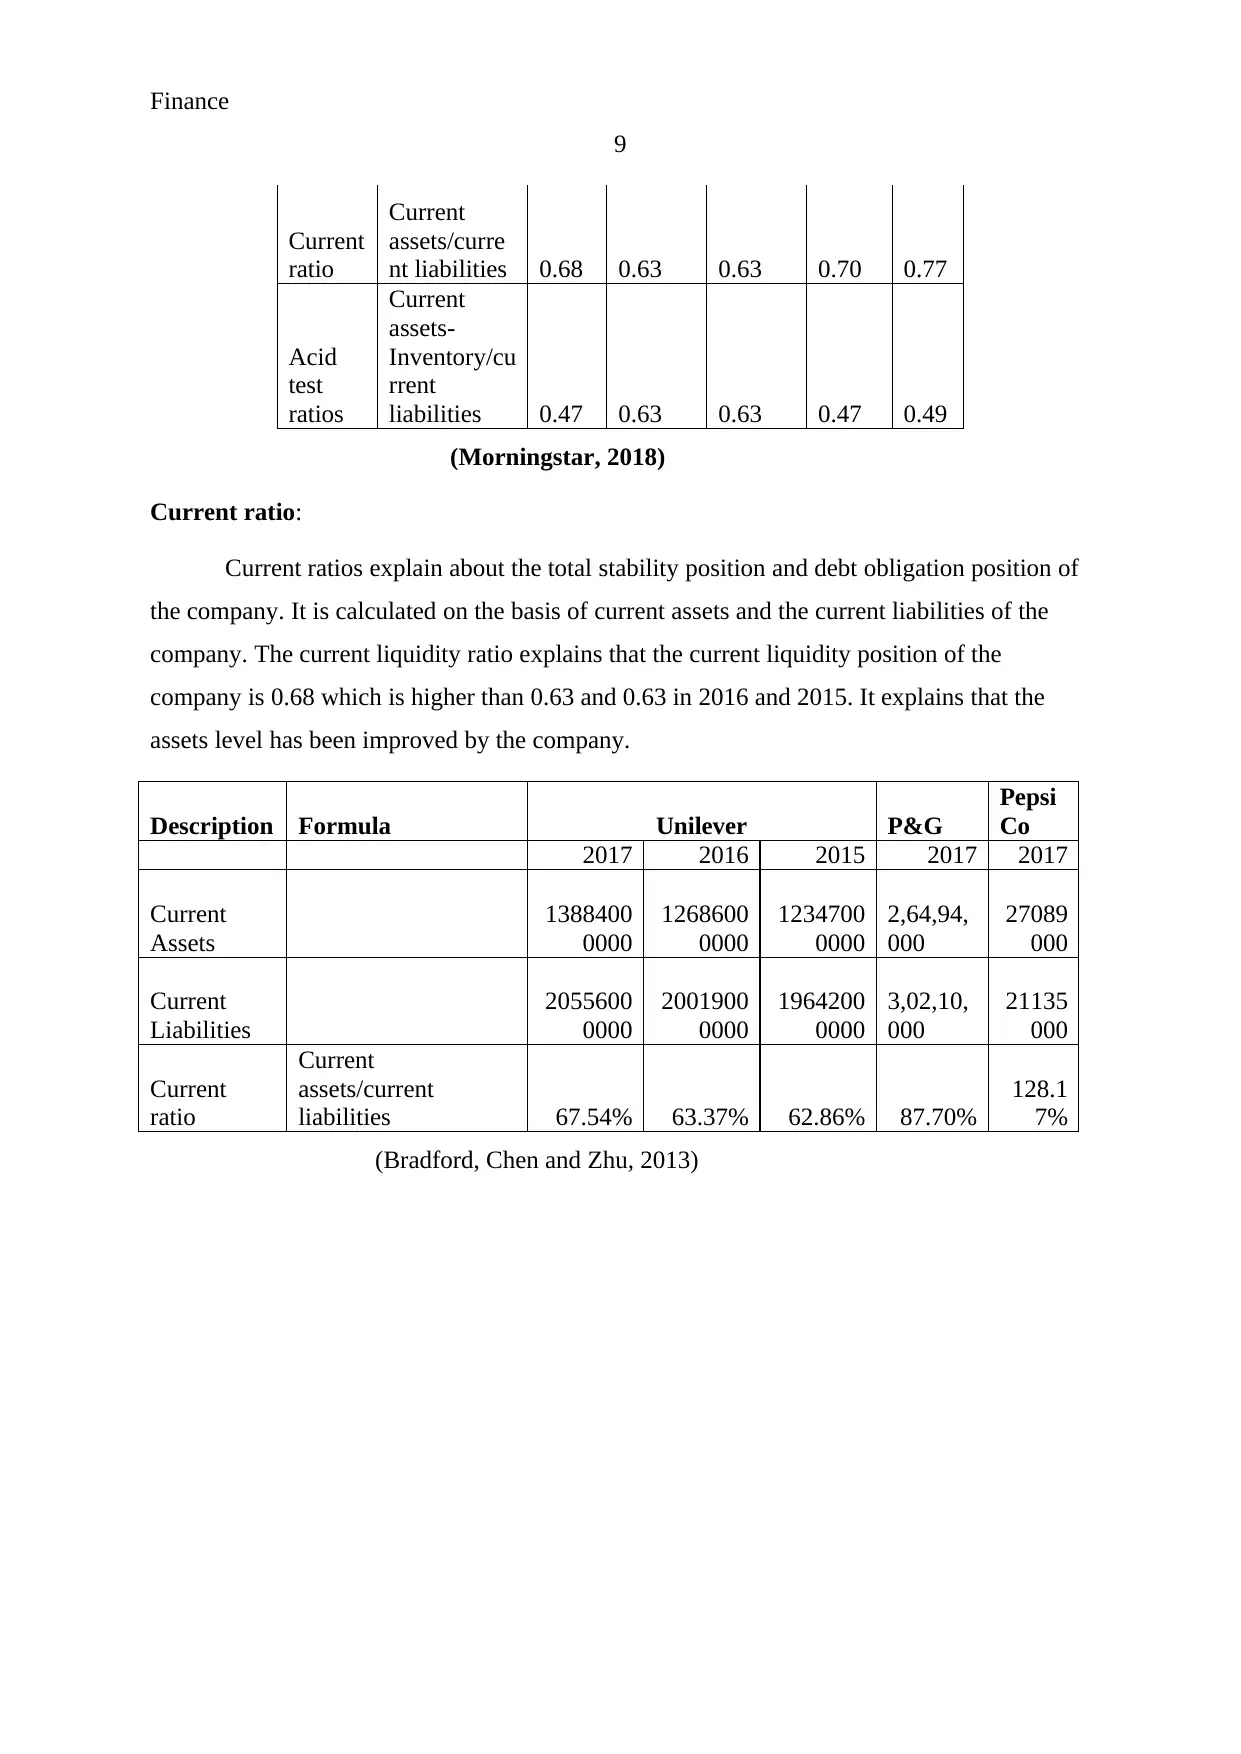
Current ratio:
Current ratios explain about the total stability position and debt obligation position of
the company. It is calculated on the basis of current assets and the current liabilities of the
company. The current liquidity ratio explains that the current liquidity position of the
company is 0.68 which is higher than 0.63 and 0.63 in 2016 and 2015. It explains that the
assets level has been improved by the company.
Description Formula Unilever P&G
Pepsi
Co
2017 2016 2015 2017 2017
Current
Assets
1388400
0000
1268600
0000
1234700
0000
2,64,94,
000
27089
000
Current
Liabilities
2055600
0000
2001900
0000
1964200
0000
3,02,10,
000
21135
000
Current
ratio
Current
assets/current
liabilities 67.54% 63.37% 62.86% 87.70%
128.1
7%
(Bradford, Chen and Zhu, 2013)
9
Current
ratio
Current
assets/curre
nt liabilities 0.68 0.63 0.63 0.70 0.77
Acid
test
ratios
Current
assets-
Inventory/cu
rrent
liabilities 0.47 0.63 0.63 0.47 0.49
(Morningstar, 2018)
Current ratio:
Current ratios explain about the total stability position and debt obligation position of
the company. It is calculated on the basis of current assets and the current liabilities of the
company. The current liquidity ratio explains that the current liquidity position of the
company is 0.68 which is higher than 0.63 and 0.63 in 2016 and 2015. It explains that the
assets level has been improved by the company.
Description Formula Unilever P&G
Pepsi
Co
2017 2016 2015 2017 2017
Current
Assets
1388400
0000
1268600
0000
1234700
0000
2,64,94,
000
27089
000
Current
Liabilities
2055600
0000
2001900
0000
1964200
0000
3,02,10,
000
21135
000
Current
ratio
Current
assets/current
liabilities 67.54% 63.37% 62.86% 87.70%
128.1
7%
(Bradford, Chen and Zhu, 2013)
Finance
10
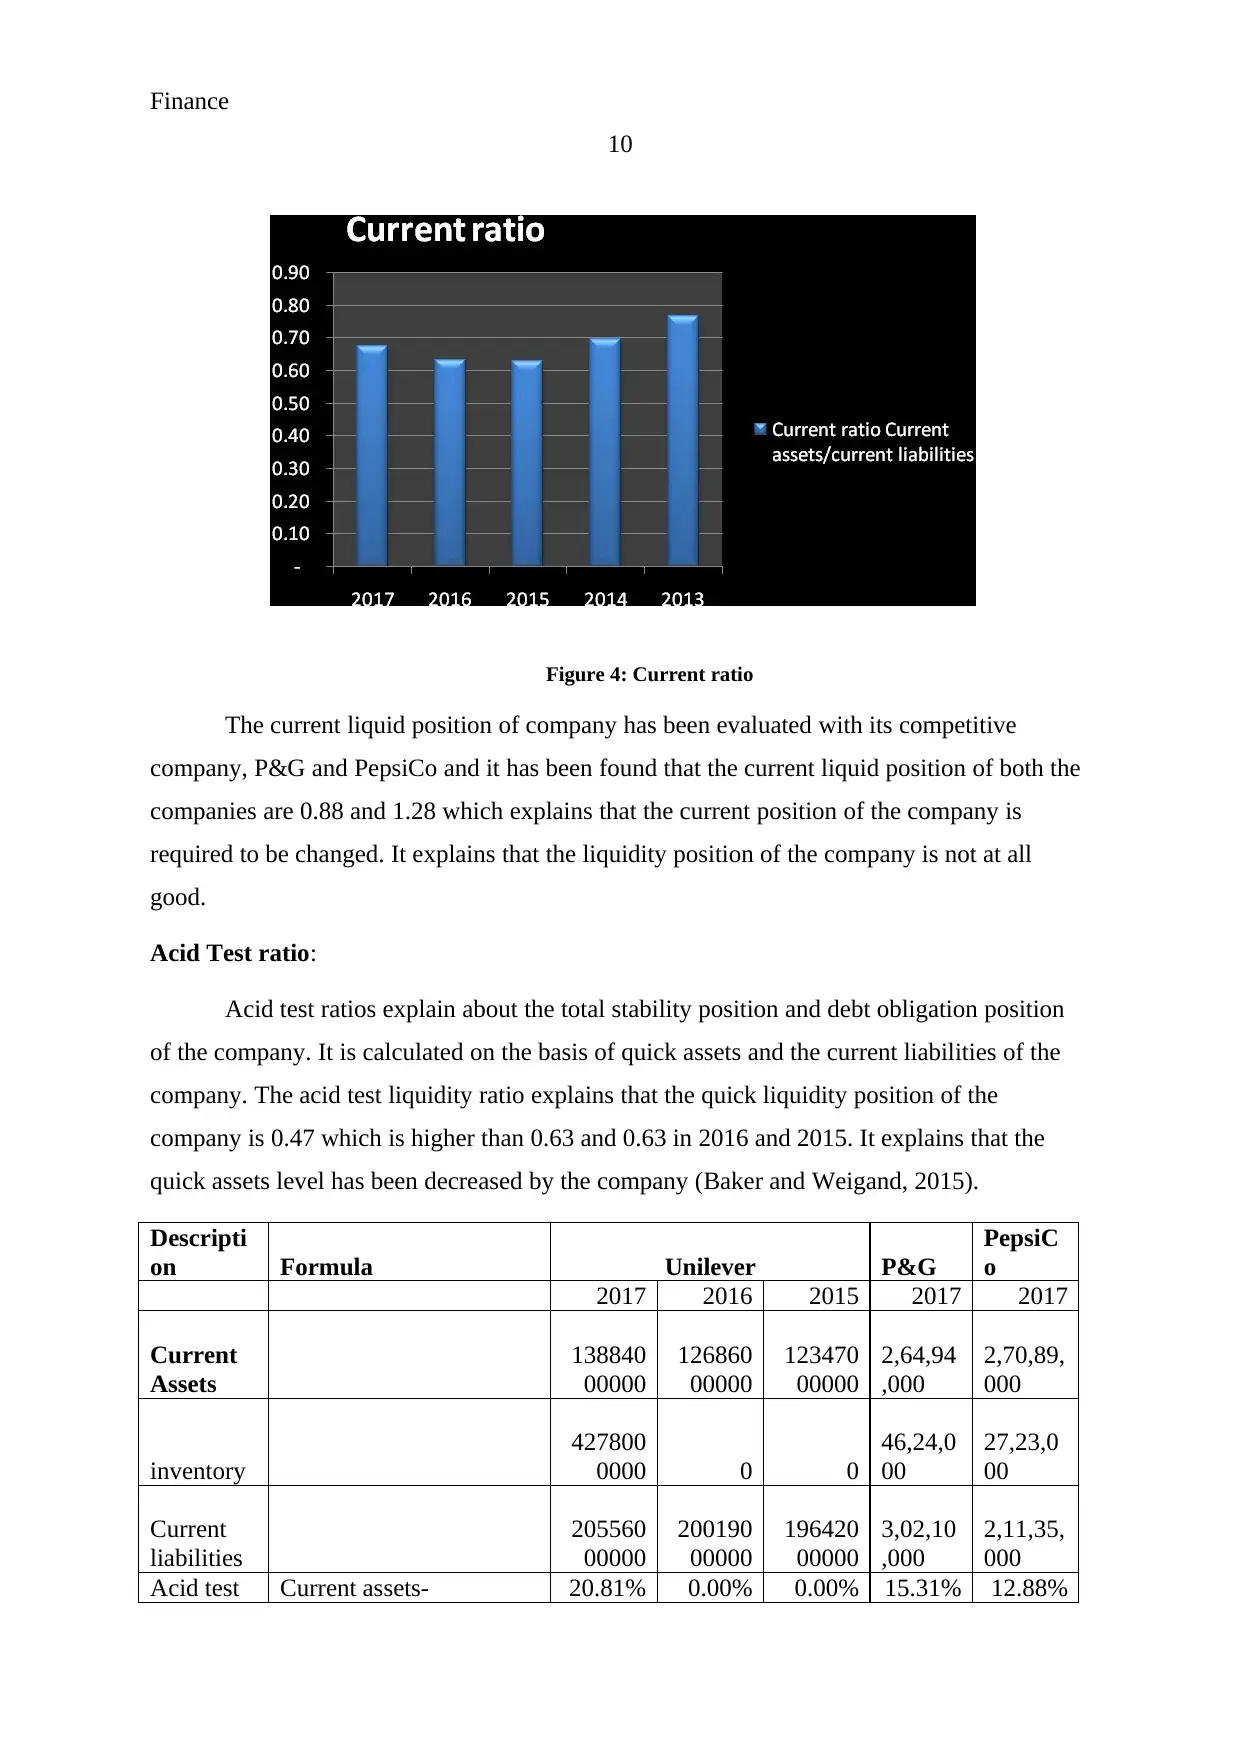
Figure 4: Current ratio
The current liquid position of company has been evaluated with its competitive
company, P&G and PepsiCo and it has been found that the current liquid position of both the
companies are 0.88 and 1.28 which explains that the current position of the company is
required to be changed. It explains that the liquidity position of the company is not at all
good.
Acid Test ratio:
Acid test ratios explain about the total stability position and debt obligation position
of the company. It is calculated on the basis of quick assets and the current liabilities of the
company. The acid test liquidity ratio explains that the quick liquidity position of the
company is 0.47 which is higher than 0.63 and 0.63 in 2016 and 2015. It explains that the
quick assets level has been decreased by the company (Baker and Weigand, 2015).
Descripti
on Formula Unilever P&G
PepsiC
o
2017 2016 2015 2017 2017
Current
Assets
138840
00000
126860
00000
123470
00000
2,64,94
,000
2,70,89,
000
inventory
427800
0000 0 0
46,24,0
00
27,23,0
00
Current
liabilities
205560
00000
200190
00000
196420
00000
3,02,10
,000
2,11,35,
000
Acid test Current assets- 20.81% 0.00% 0.00% 15.31% 12.88%
10
Figure 4: Current ratio
The current liquid position of company has been evaluated with its competitive
company, P&G and PepsiCo and it has been found that the current liquid position of both the
companies are 0.88 and 1.28 which explains that the current position of the company is
required to be changed. It explains that the liquidity position of the company is not at all
good.
Acid Test ratio:
Acid test ratios explain about the total stability position and debt obligation position
of the company. It is calculated on the basis of quick assets and the current liabilities of the
company. The acid test liquidity ratio explains that the quick liquidity position of the
company is 0.47 which is higher than 0.63 and 0.63 in 2016 and 2015. It explains that the
quick assets level has been decreased by the company (Baker and Weigand, 2015).
Descripti
on Formula Unilever P&G
PepsiC
o
2017 2016 2015 2017 2017
Current
Assets
138840
00000
126860
00000
123470
00000
2,64,94
,000
2,70,89,
000
inventory
427800
0000 0 0
46,24,0
00
27,23,0
00
Current
liabilities
205560
00000
200190
00000
196420
00000
3,02,10
,000
2,11,35,
000
Acid test Current assets- 20.81% 0.00% 0.00% 15.31% 12.88%
Secure Best Marks with AI Grader
Need help grading? Try our AI Grader for instant feedback on your assignments.
Finance
11
ratios
Inventory/current
liabilities
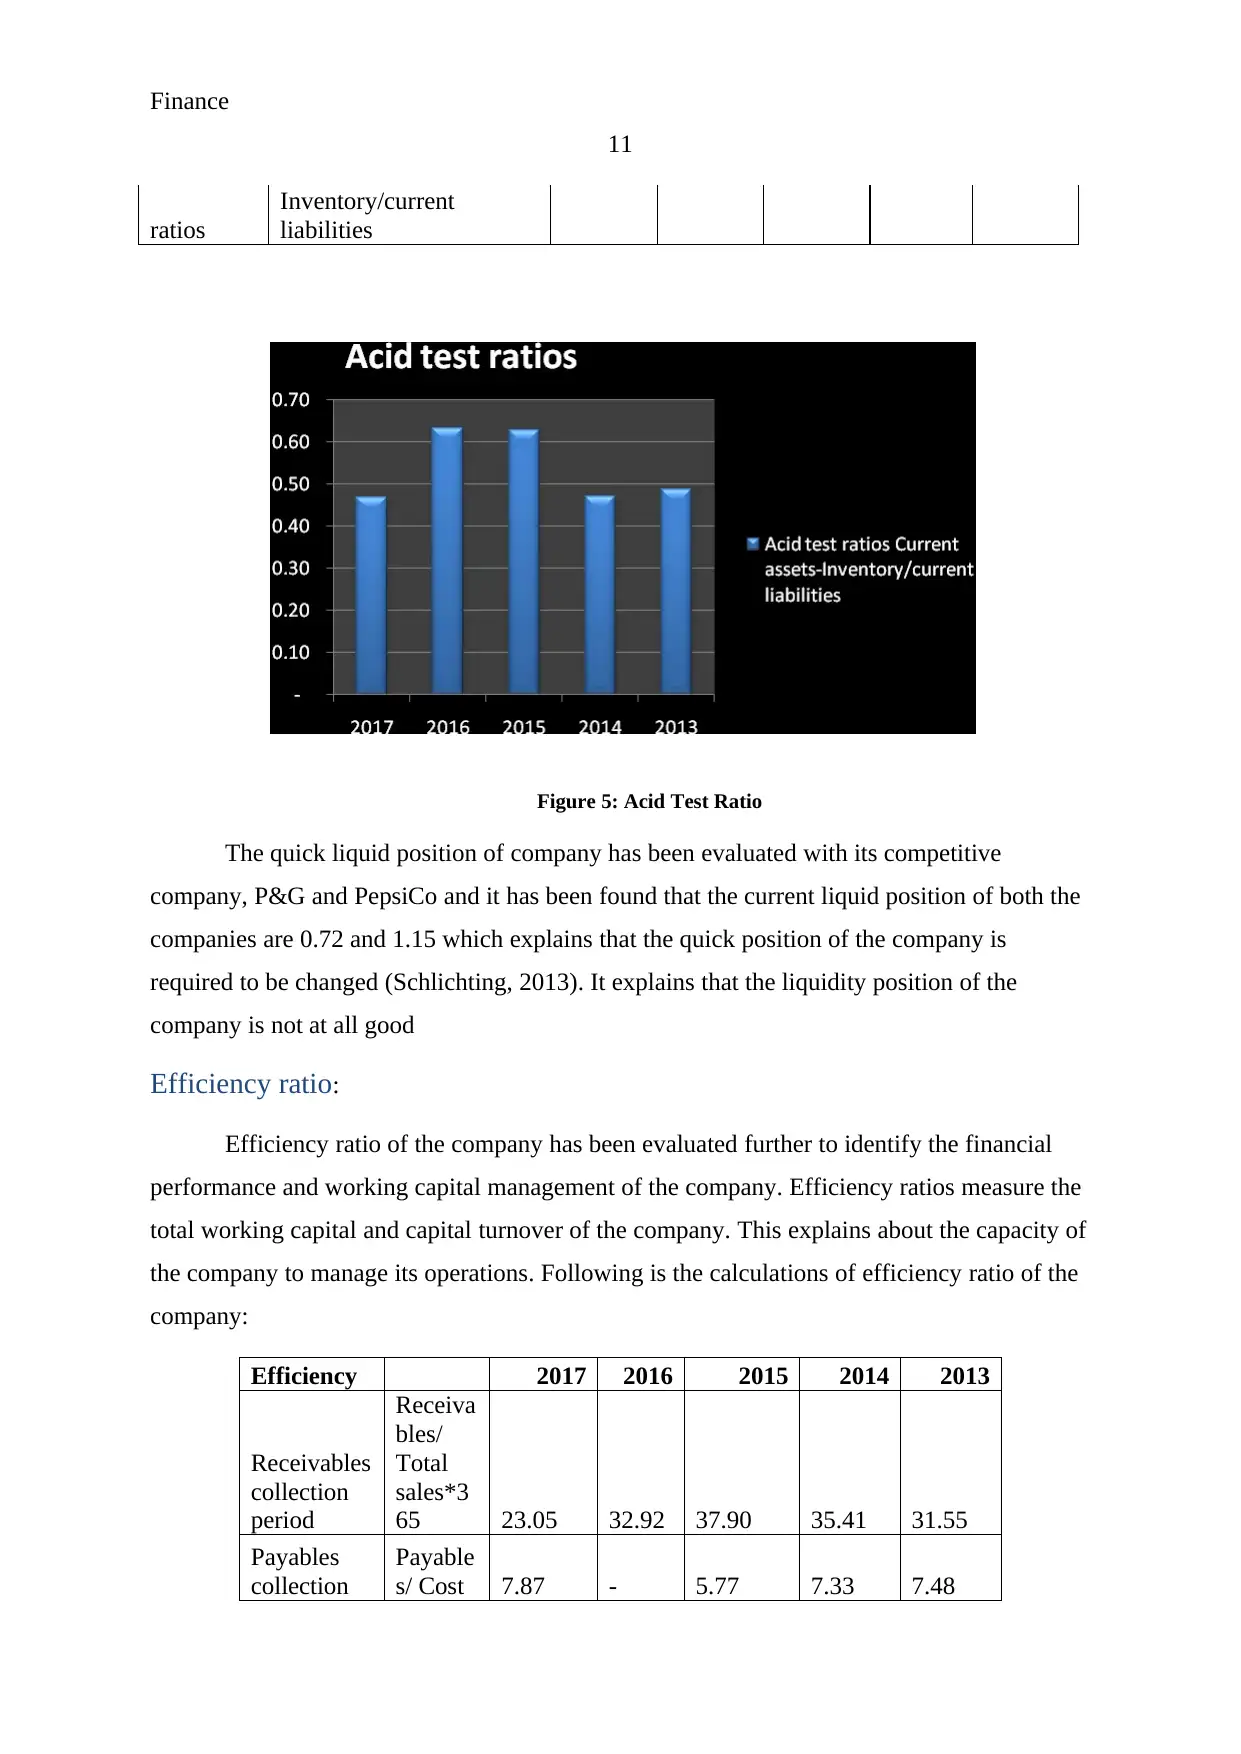
Figure 5: Acid Test Ratio
The quick liquid position of company has been evaluated with its competitive
company, P&G and PepsiCo and it has been found that the current liquid position of both the
companies are 0.72 and 1.15 which explains that the quick position of the company is
required to be changed (Schlichting, 2013). It explains that the liquidity position of the
company is not at all good
Efficiency ratio:
Efficiency ratio of the company has been evaluated further to identify the financial
performance and working capital management of the company. Efficiency ratios measure the
total working capital and capital turnover of the company. This explains about the capacity of
the company to manage its operations. Following is the calculations of efficiency ratio of the
company:
Efficiency 2017 2016 2015 2014 2013
Receivables
collection
period
Receiva
bles/
Total
sales*3
65 23.05 32.92 37.90 35.41 31.55
Payables
collection
Payable
s/ Cost 7.87 - 5.77 7.33 7.48
11
ratios
Inventory/current
liabilities
Figure 5: Acid Test Ratio
The quick liquid position of company has been evaluated with its competitive
company, P&G and PepsiCo and it has been found that the current liquid position of both the
companies are 0.72 and 1.15 which explains that the quick position of the company is
required to be changed (Schlichting, 2013). It explains that the liquidity position of the
company is not at all good
Efficiency ratio:
Efficiency ratio of the company has been evaluated further to identify the financial
performance and working capital management of the company. Efficiency ratios measure the
total working capital and capital turnover of the company. This explains about the capacity of
the company to manage its operations. Following is the calculations of efficiency ratio of the
company:
Efficiency 2017 2016 2015 2014 2013
Receivables
collection
period
Receiva
bles/
Total
sales*3
65 23.05 32.92 37.90 35.41 31.55
Payables
collection
Payable
s/ Cost 7.87 - 5.77 7.33 7.48
Finance
12
period
of
sales*3
65
Inventory
days
Invento
ry/ cost
of
goods
sold
*365 59.24 - - 57.71 63.09
.
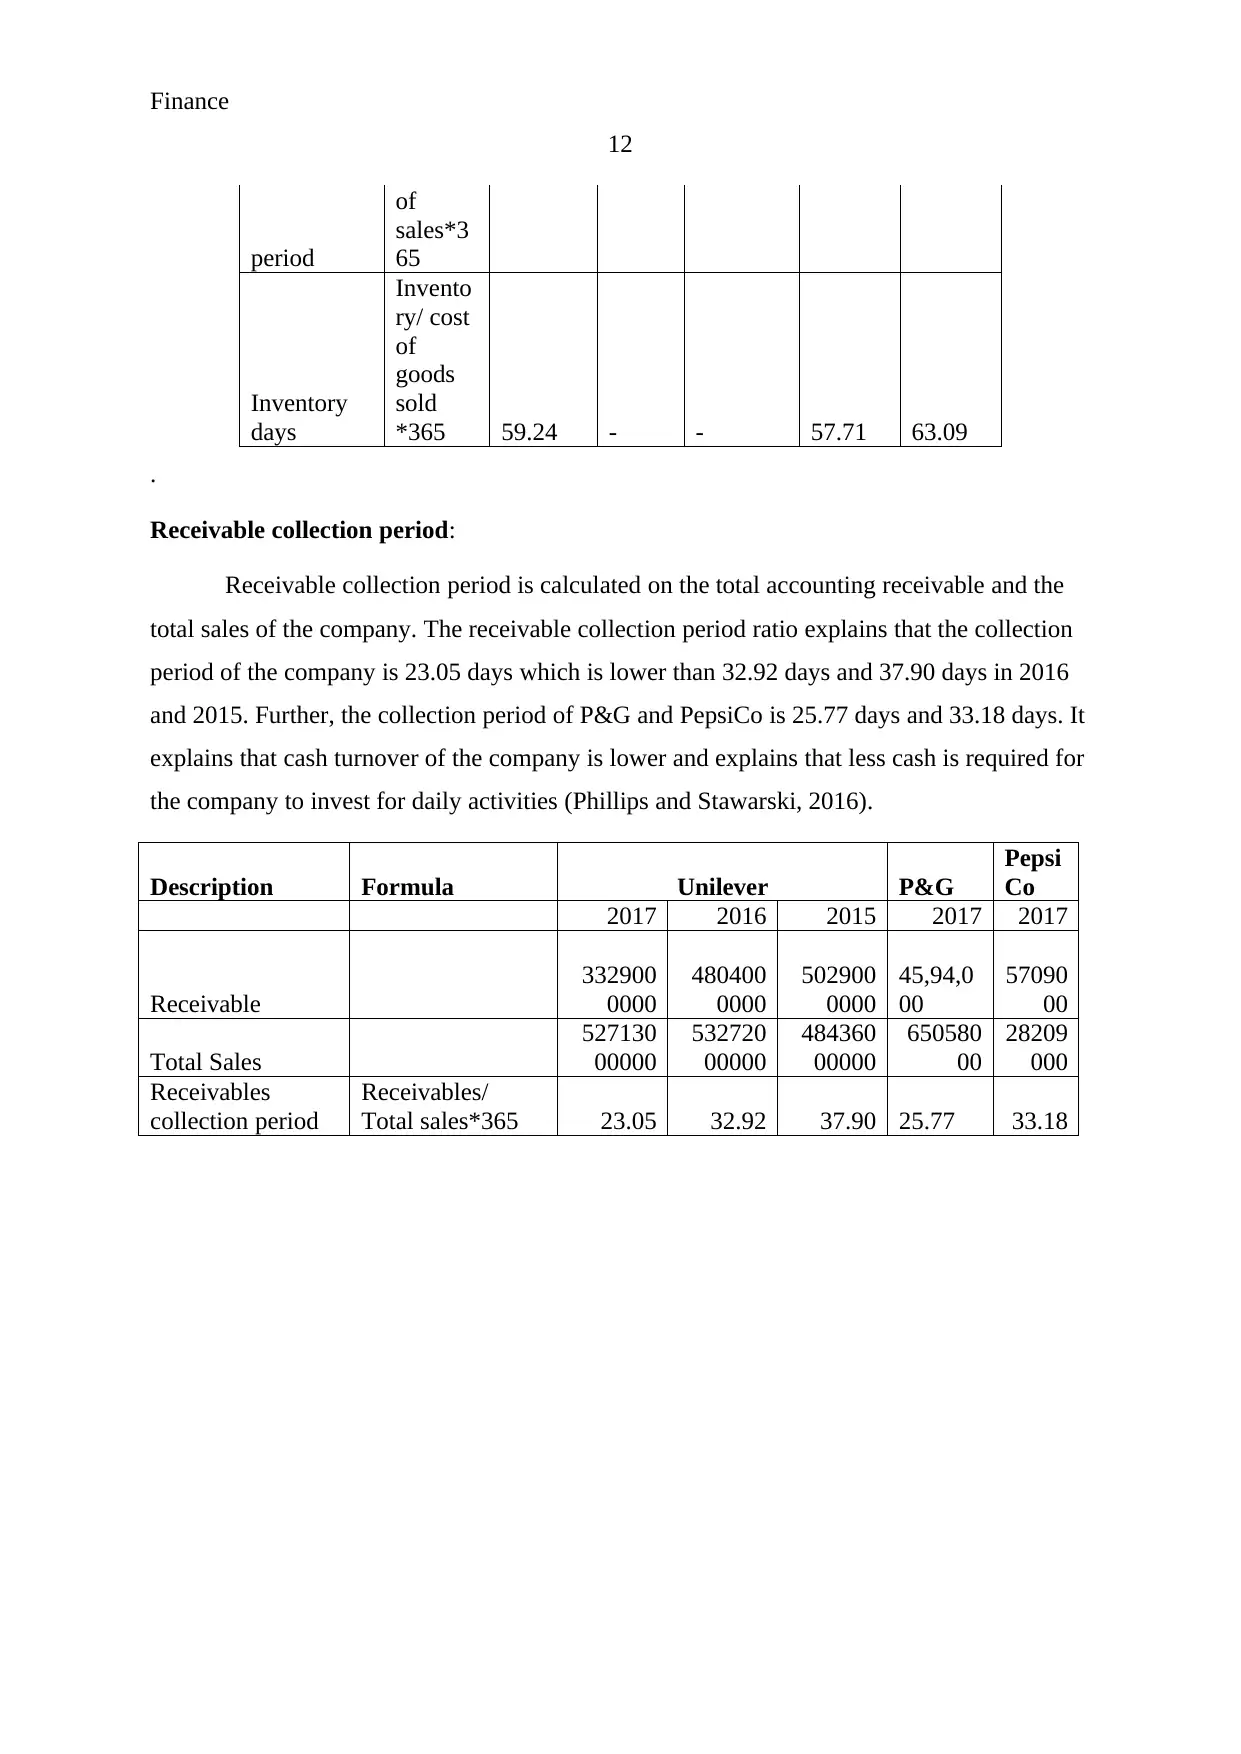
Receivable collection period:
Receivable collection period is calculated on the total accounting receivable and the
total sales of the company. The receivable collection period ratio explains that the collection
period of the company is 23.05 days which is lower than 32.92 days and 37.90 days in 2016
and 2015. Further, the collection period of P&G and PepsiCo is 25.77 days and 33.18 days. It
explains that cash turnover of the company is lower and explains that less cash is required for
the company to invest for daily activities (Phillips and Stawarski, 2016).
Description Formula Unilever P&G
Pepsi
Co
2017 2016 2015 2017 2017
Receivable
332900
0000
480400
0000
502900
0000
45,94,0
00
57090
00
Total Sales
527130
00000
532720
00000
484360
00000
650580
00
28209
000
Receivables
collection period
Receivables/
Total sales*365 23.05 32.92 37.90 25.77 33.18
12
period
of
sales*3
65
Inventory
days
Invento
ry/ cost
of
goods
sold
*365 59.24 - - 57.71 63.09
.
Receivable collection period:
Receivable collection period is calculated on the total accounting receivable and the
total sales of the company. The receivable collection period ratio explains that the collection
period of the company is 23.05 days which is lower than 32.92 days and 37.90 days in 2016
and 2015. Further, the collection period of P&G and PepsiCo is 25.77 days and 33.18 days. It
explains that cash turnover of the company is lower and explains that less cash is required for
the company to invest for daily activities (Phillips and Stawarski, 2016).
Description Formula Unilever P&G
Pepsi
Co
2017 2016 2015 2017 2017
Receivable
332900
0000
480400
0000
502900
0000
45,94,0
00
57090
00
Total Sales
527130
00000
532720
00000
484360
00000
650580
00
28209
000
Receivables
collection period
Receivables/
Total sales*365 23.05 32.92 37.90 25.77 33.18
Finance
13
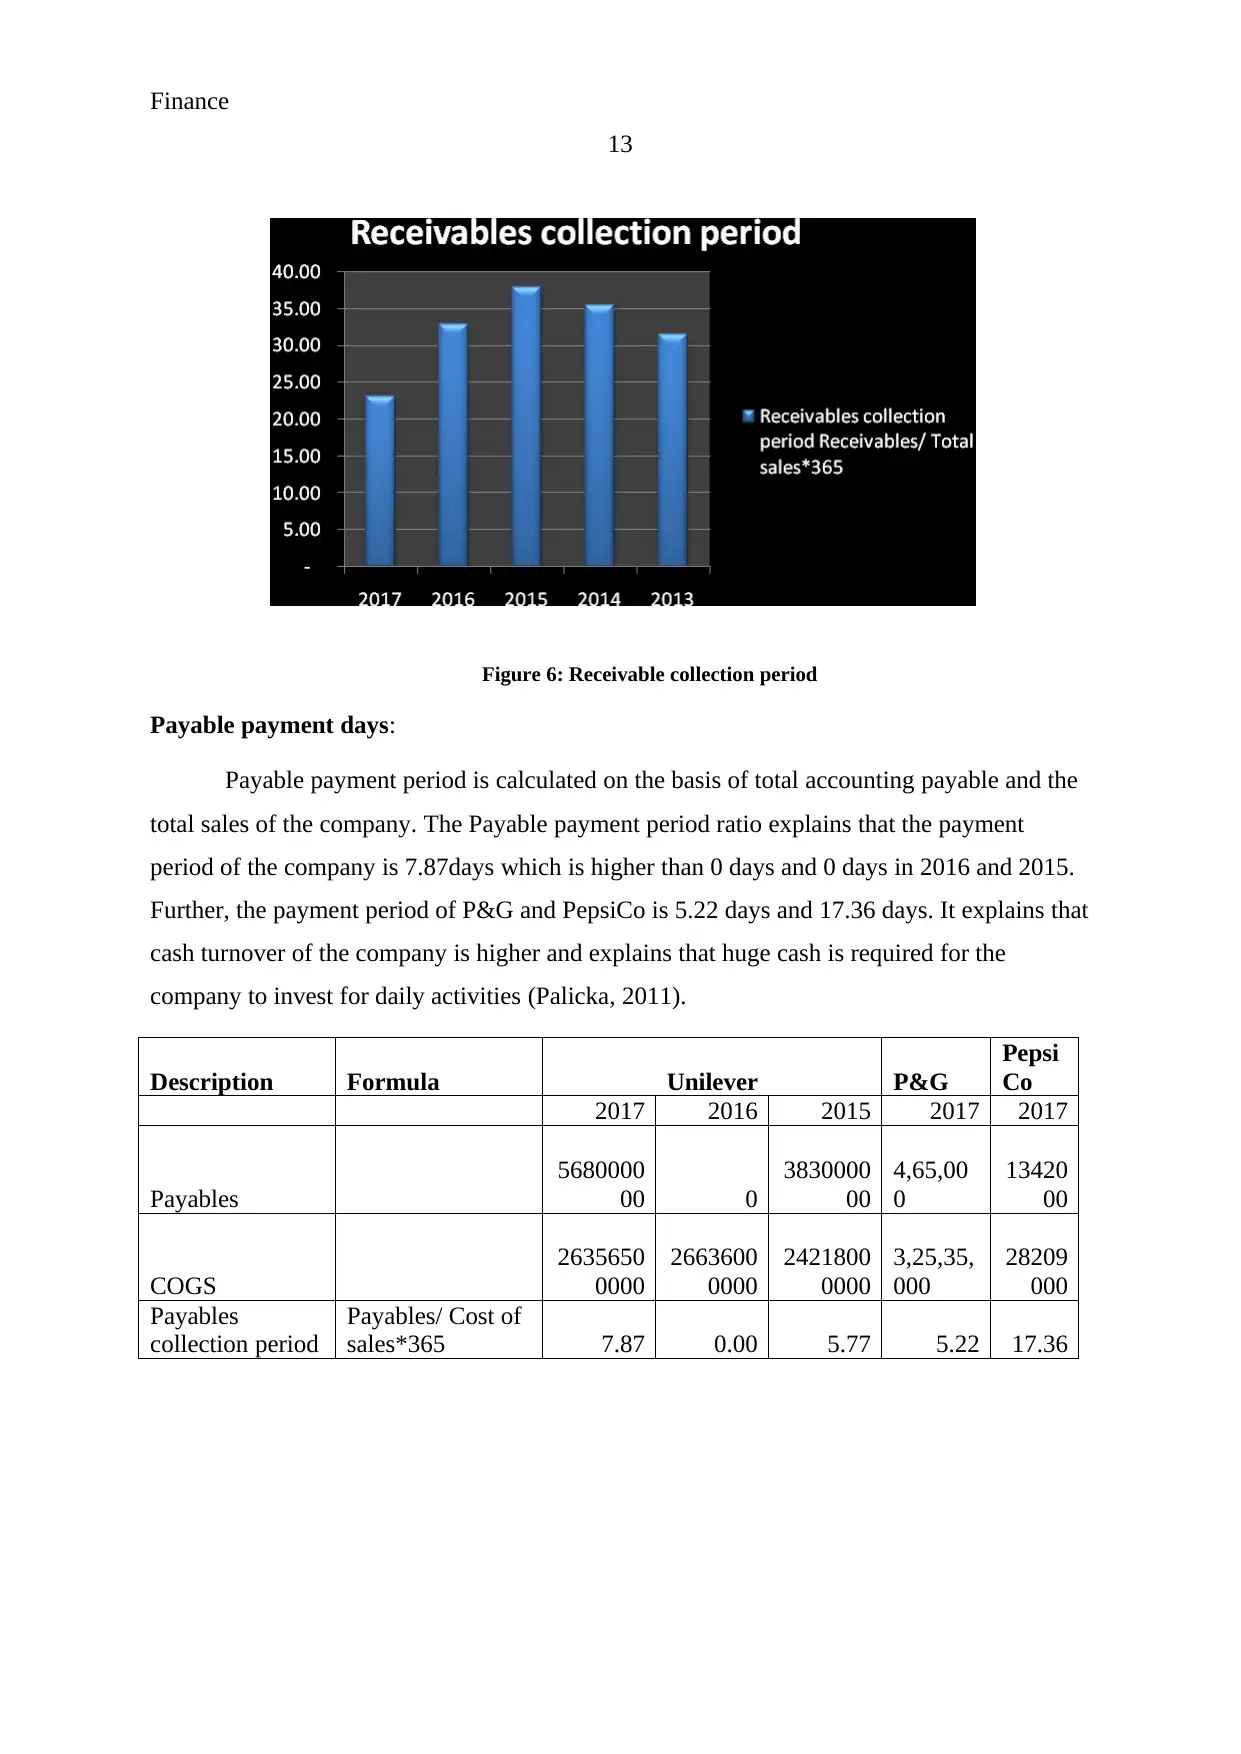
Figure 6: Receivable collection period
Payable payment days:
Payable payment period is calculated on the basis of total accounting payable and the
total sales of the company. The Payable payment period ratio explains that the payment
period of the company is 7.87days which is higher than 0 days and 0 days in 2016 and 2015.
Further, the payment period of P&G and PepsiCo is 5.22 days and 17.36 days. It explains that
cash turnover of the company is higher and explains that huge cash is required for the
company to invest for daily activities (Palicka, 2011).
Description Formula Unilever P&G
Pepsi
Co
2017 2016 2015 2017 2017
Payables
5680000
00 0
3830000
00
4,65,00
0
13420
00
COGS
2635650
0000
2663600
0000
2421800
0000
3,25,35,
000
28209
000
Payables
collection period
Payables/ Cost of
sales*365 7.87 0.00 5.77 5.22 17.36
13
Figure 6: Receivable collection period
Payable payment days:
Payable payment period is calculated on the basis of total accounting payable and the
total sales of the company. The Payable payment period ratio explains that the payment
period of the company is 7.87days which is higher than 0 days and 0 days in 2016 and 2015.
Further, the payment period of P&G and PepsiCo is 5.22 days and 17.36 days. It explains that
cash turnover of the company is higher and explains that huge cash is required for the
company to invest for daily activities (Palicka, 2011).
Description Formula Unilever P&G
Pepsi
Co
2017 2016 2015 2017 2017
Payables
5680000
00 0
3830000
00
4,65,00
0
13420
00
COGS
2635650
0000
2663600
0000
2421800
0000
3,25,35,
000
28209
000
Payables
collection period
Payables/ Cost of
sales*365 7.87 0.00 5.77 5.22 17.36
Paraphrase This Document
Need a fresh take? Get an instant paraphrase of this document with our AI Paraphraser
Finance
14
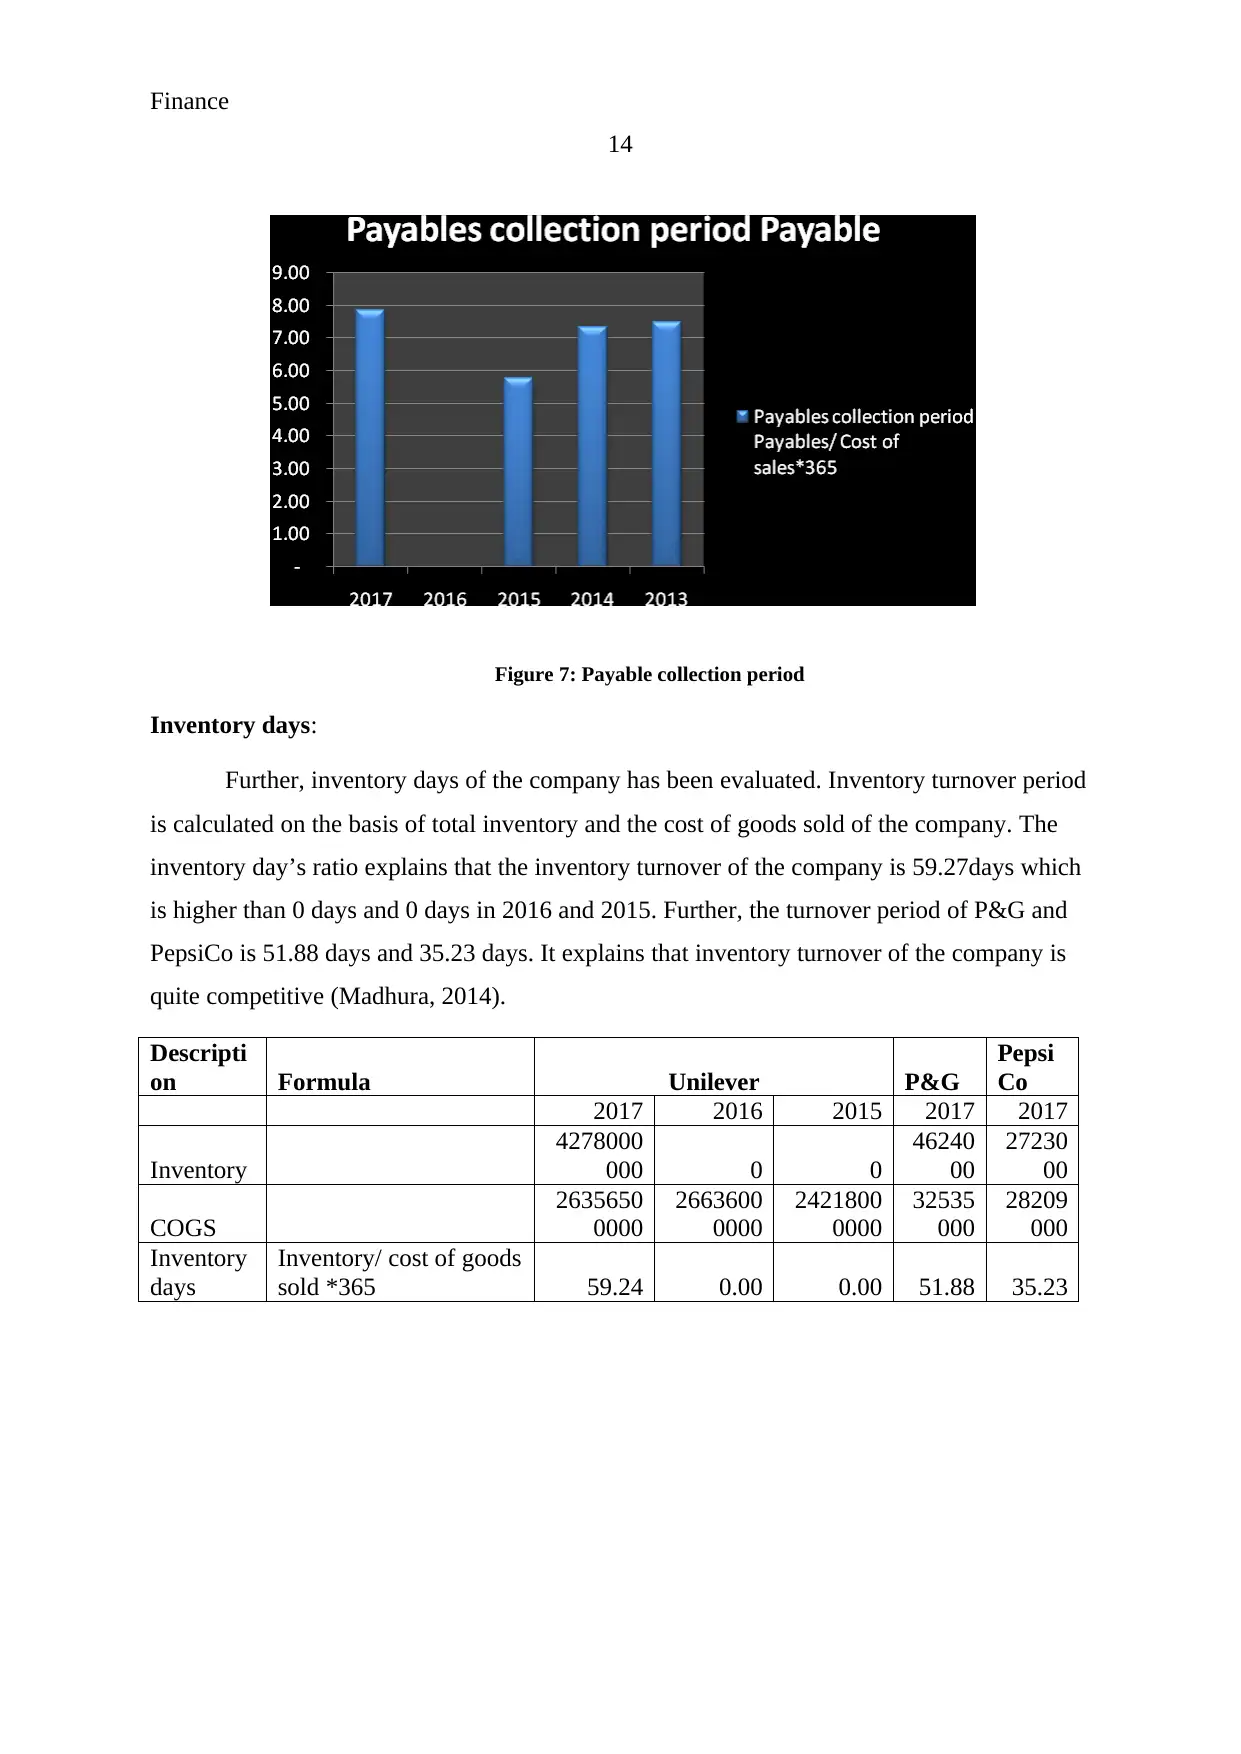
Figure 7: Payable collection period
Inventory days:
Further, inventory days of the company has been evaluated. Inventory turnover period
is calculated on the basis of total inventory and the cost of goods sold of the company. The
inventory day’s ratio explains that the inventory turnover of the company is 59.27days which
is higher than 0 days and 0 days in 2016 and 2015. Further, the turnover period of P&G and
PepsiCo is 51.88 days and 35.23 days. It explains that inventory turnover of the company is
quite competitive (Madhura, 2014).
Descripti
on Formula Unilever P&G
Pepsi
Co
2017 2016 2015 2017 2017
Inventory
4278000
000 0 0
46240
00
27230
00
COGS
2635650
0000
2663600
0000
2421800
0000
32535
000
28209
000
Inventory
days
Inventory/ cost of goods
sold *365 59.24 0.00 0.00 51.88 35.23
14
Figure 7: Payable collection period
Inventory days:
Further, inventory days of the company has been evaluated. Inventory turnover period
is calculated on the basis of total inventory and the cost of goods sold of the company. The
inventory day’s ratio explains that the inventory turnover of the company is 59.27days which
is higher than 0 days and 0 days in 2016 and 2015. Further, the turnover period of P&G and
PepsiCo is 51.88 days and 35.23 days. It explains that inventory turnover of the company is
quite competitive (Madhura, 2014).
Descripti
on Formula Unilever P&G
Pepsi
Co
2017 2016 2015 2017 2017
Inventory
4278000
000 0 0
46240
00
27230
00
COGS
2635650
0000
2663600
0000
2421800
0000
32535
000
28209
000
Inventory
days
Inventory/ cost of goods
sold *365 59.24 0.00 0.00 51.88 35.23
Finance
15
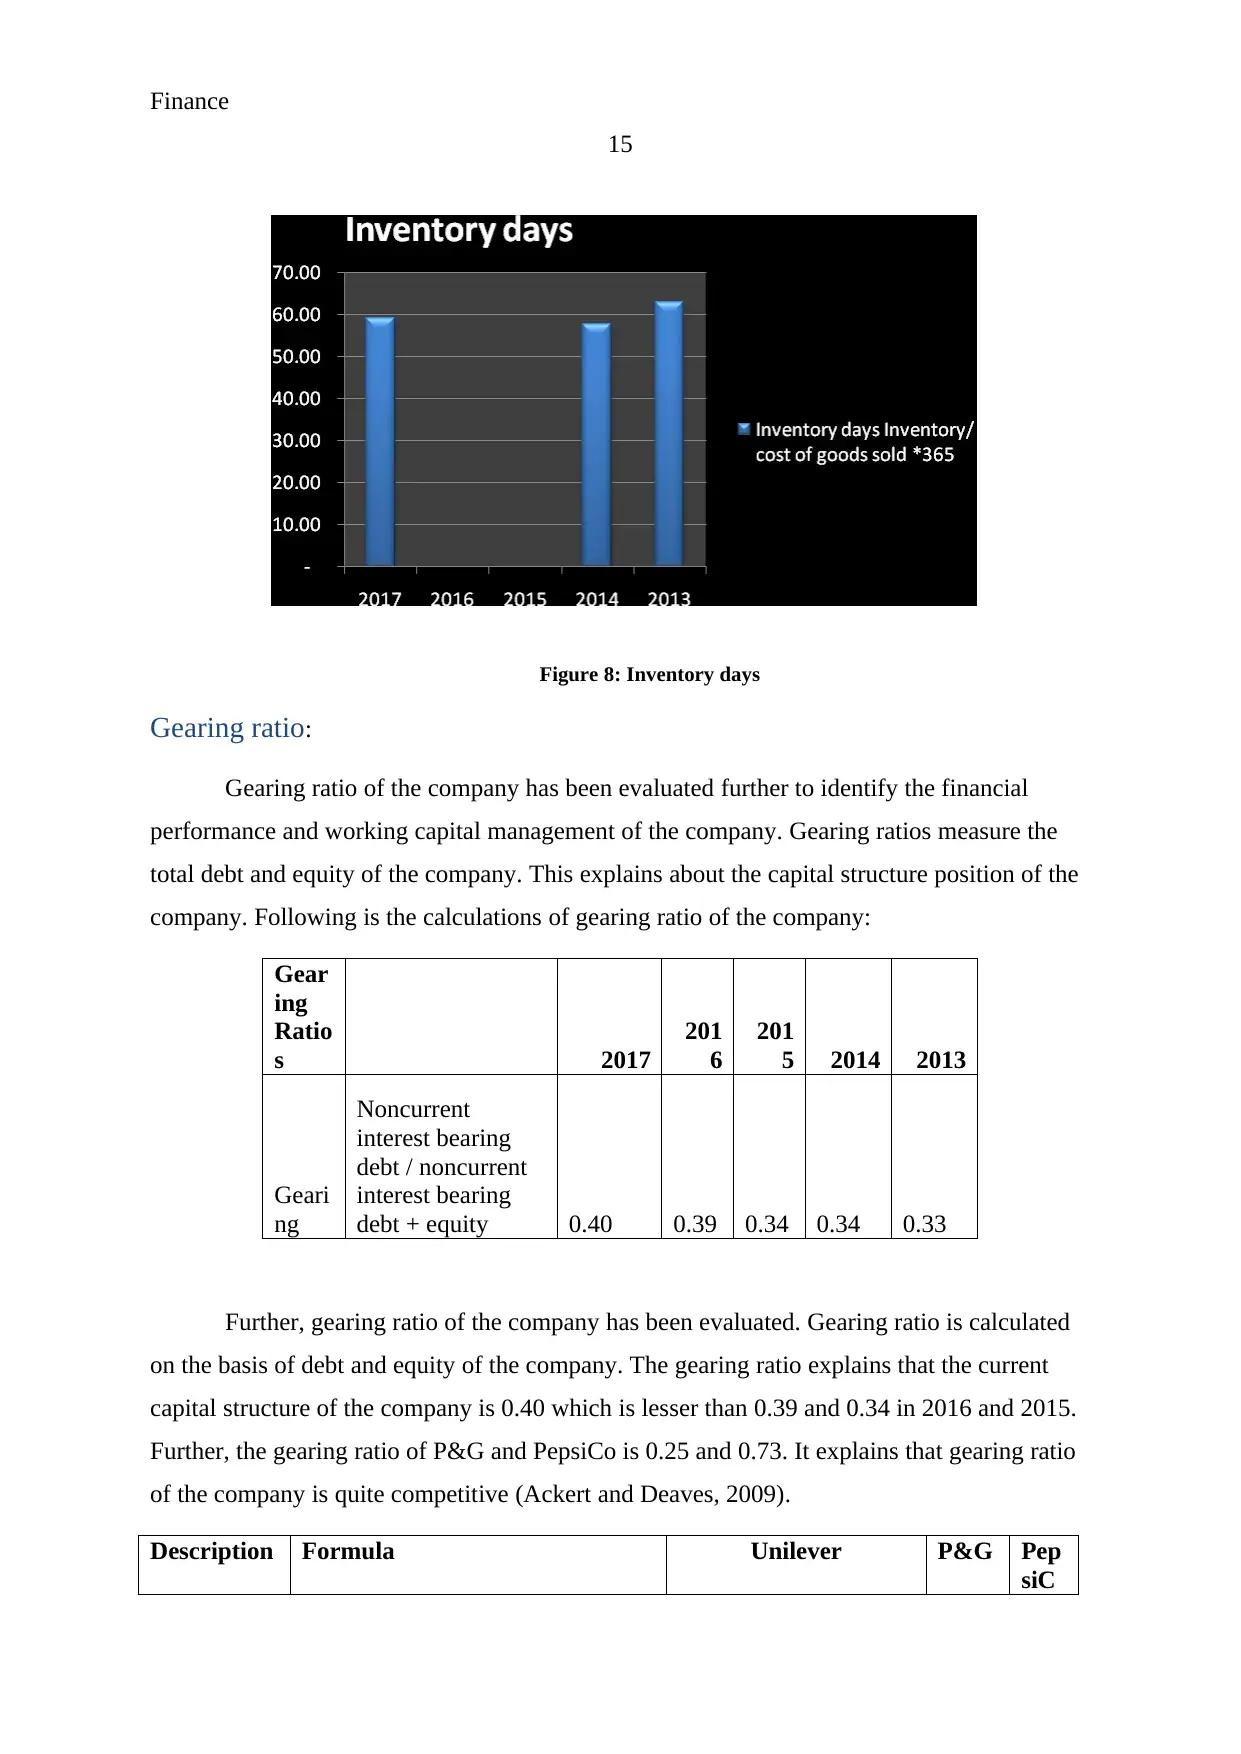
Figure 8: Inventory days
Gearing ratio:
Gearing ratio of the company has been evaluated further to identify the financial
performance and working capital management of the company. Gearing ratios measure the
total debt and equity of the company. This explains about the capital structure position of the
company. Following is the calculations of gearing ratio of the company:
Gear
ing
Ratio
s 2017
201
6
201
5 2014 2013
Geari
ng
Noncurrent
interest bearing
debt / noncurrent
interest bearing
debt + equity 0.40 0.39 0.34 0.34 0.33
Further, gearing ratio of the company has been evaluated. Gearing ratio is calculated
on the basis of debt and equity of the company. The gearing ratio explains that the current
capital structure of the company is 0.40 which is lesser than 0.39 and 0.34 in 2016 and 2015.
Further, the gearing ratio of P&G and PepsiCo is 0.25 and 0.73. It explains that gearing ratio
of the company is quite competitive (Ackert and Deaves, 2009).
Description Formula Unilever P&G Pep
siC
15
Figure 8: Inventory days
Gearing ratio:
Gearing ratio of the company has been evaluated further to identify the financial
performance and working capital management of the company. Gearing ratios measure the
total debt and equity of the company. This explains about the capital structure position of the
company. Following is the calculations of gearing ratio of the company:
Gear
ing
Ratio
s 2017
201
6
201
5 2014 2013
Geari
ng
Noncurrent
interest bearing
debt / noncurrent
interest bearing
debt + equity 0.40 0.39 0.34 0.34 0.33
Further, gearing ratio of the company has been evaluated. Gearing ratio is calculated
on the basis of debt and equity of the company. The gearing ratio explains that the current
capital structure of the company is 0.40 which is lesser than 0.39 and 0.34 in 2016 and 2015.
Further, the gearing ratio of P&G and PepsiCo is 0.25 and 0.73. It explains that gearing ratio
of the company is quite competitive (Ackert and Deaves, 2009).
Description Formula Unilever P&G Pep
siC
Finance
16
o
2017 2016 2015 2017
201
7
Noncurrent
interesting
debt
10933
00000
0
98540
00000
71860
00000
1,80,
38,00
0
300
530
00
Equity
16354
00000
0
15439
00000
0
13651
00000
0
5,51,
84,00
0
112
460
00
Gearing
Noncurrent interest bearing debt /
noncurrent interest bearing debt +
equity
40.07
%
38.96
%
34.49
%
24.63
%
72.7
7%
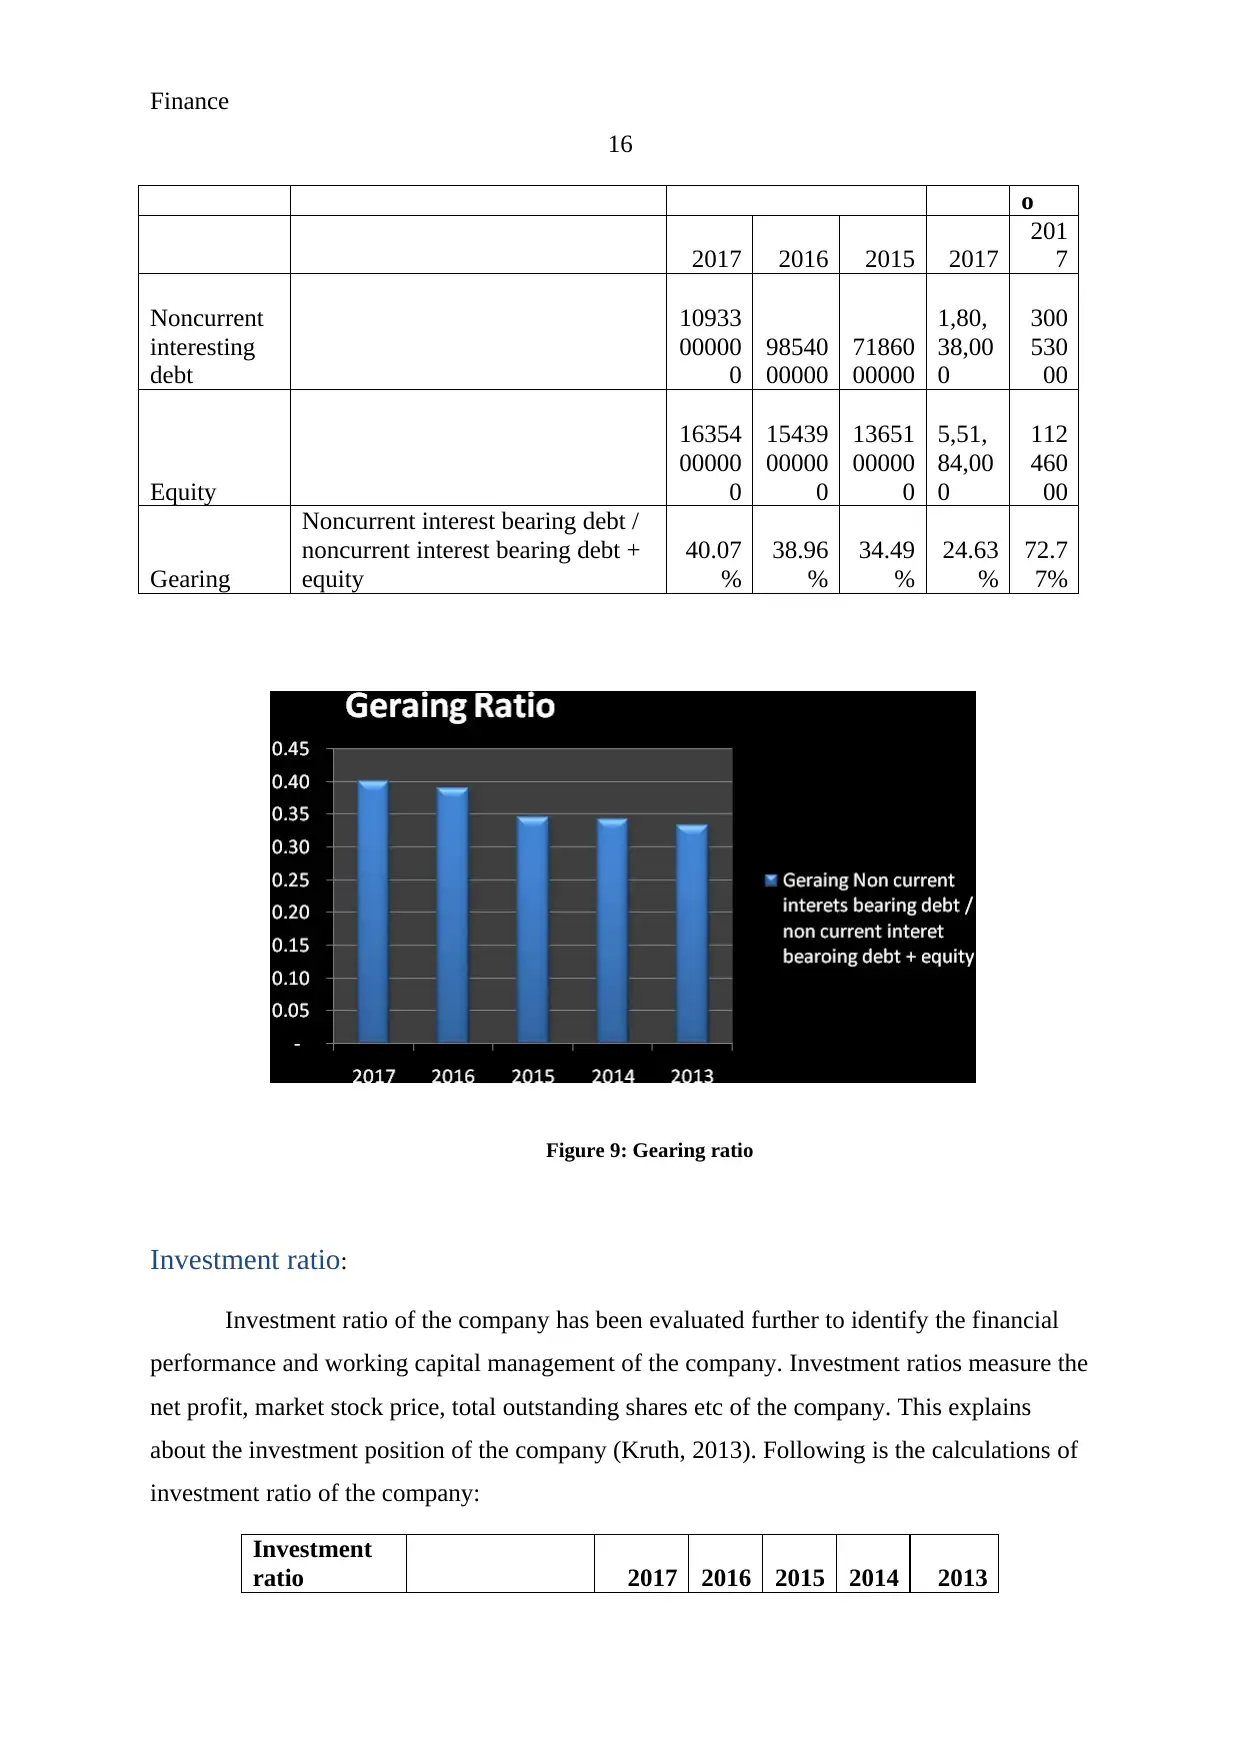
Figure 9: Gearing ratio
Investment ratio:
Investment ratio of the company has been evaluated further to identify the financial
performance and working capital management of the company. Investment ratios measure the
net profit, market stock price, total outstanding shares etc of the company. This explains
about the investment position of the company (Kruth, 2013). Following is the calculations of
investment ratio of the company:
Investment
ratio 2017 2016 2015 2014 2013
16
o
2017 2016 2015 2017
201
7
Noncurrent
interesting
debt
10933
00000
0
98540
00000
71860
00000
1,80,
38,00
0
300
530
00
Equity
16354
00000
0
15439
00000
0
13651
00000
0
5,51,
84,00
0
112
460
00
Gearing
Noncurrent interest bearing debt /
noncurrent interest bearing debt +
equity
40.07
%
38.96
%
34.49
%
24.63
%
72.7
7%
Figure 9: Gearing ratio
Investment ratio:
Investment ratio of the company has been evaluated further to identify the financial
performance and working capital management of the company. Investment ratios measure the
net profit, market stock price, total outstanding shares etc of the company. This explains
about the investment position of the company (Kruth, 2013). Following is the calculations of
investment ratio of the company:
Investment
ratio 2017 2016 2015 2014 2013
Secure Best Marks with AI Grader
Need help grading? Try our AI Grader for instant feedback on your assignments.
Finance
17
Earnings per
share
NPAT/ Number
of ordinary
shares 1.83 1.73 1.82 1.71 1.58
Price earnings
ratio
Market price
per share /
earnings per
share 31.68
(Morningstar, 2018)
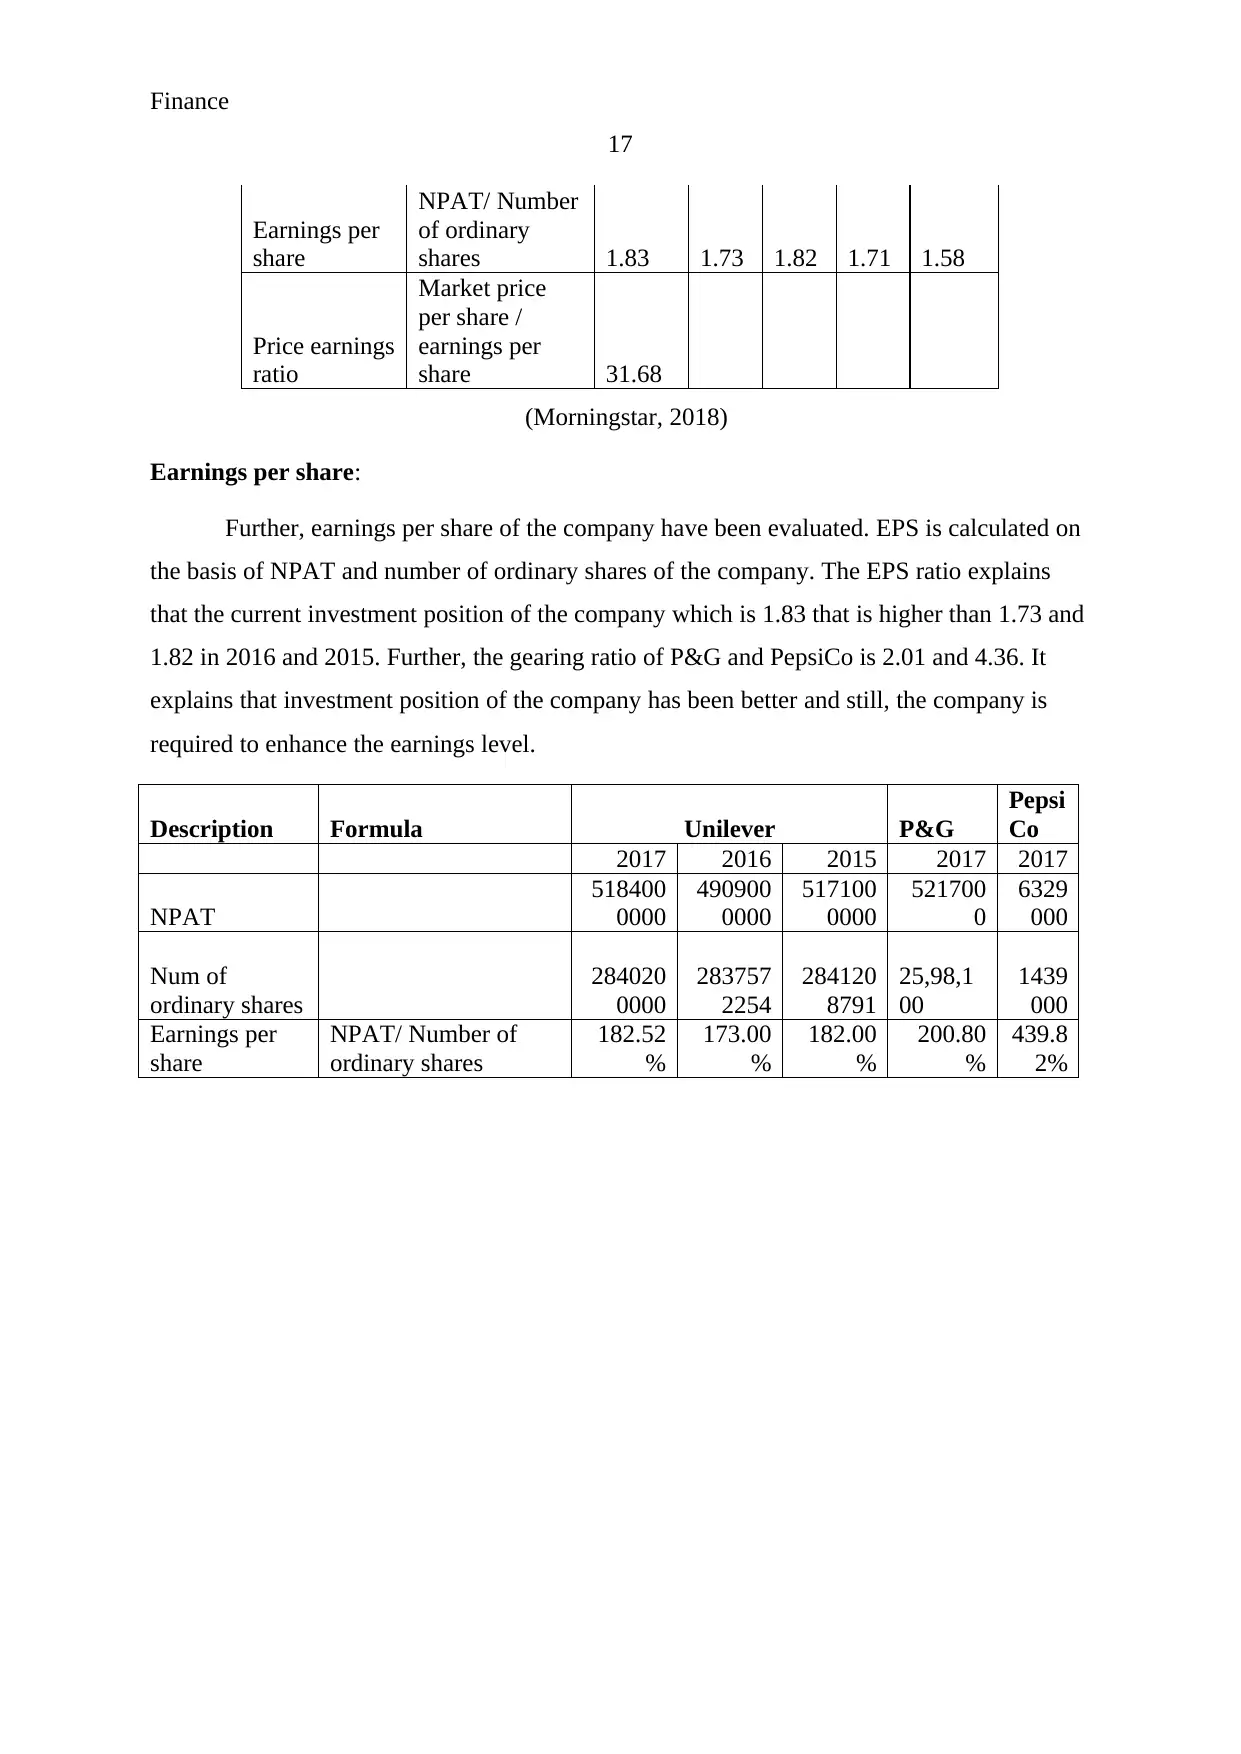
Earnings per share:
Further, earnings per share of the company have been evaluated. EPS is calculated on
the basis of NPAT and number of ordinary shares of the company. The EPS ratio explains
that the current investment position of the company which is 1.83 that is higher than 1.73 and
1.82 in 2016 and 2015. Further, the gearing ratio of P&G and PepsiCo is 2.01 and 4.36. It
explains that investment position of the company has been better and still, the company is
required to enhance the earnings level.
Description Formula Unilever P&G
Pepsi
Co
2017 2016 2015 2017 2017
NPAT
518400
0000
490900
0000
517100
0000
521700
0
6329
000
Num of
ordinary shares
284020
0000
283757
2254
284120
8791
25,98,1
00
1439
000
Earnings per
share
NPAT/ Number of
ordinary shares
182.52
%
173.00
%
182.00
%
200.80
%
439.8
2%
17
Earnings per
share
NPAT/ Number
of ordinary
shares 1.83 1.73 1.82 1.71 1.58
Price earnings
ratio
Market price
per share /
earnings per
share 31.68
(Morningstar, 2018)
Earnings per share:
Further, earnings per share of the company have been evaluated. EPS is calculated on
the basis of NPAT and number of ordinary shares of the company. The EPS ratio explains
that the current investment position of the company which is 1.83 that is higher than 1.73 and
1.82 in 2016 and 2015. Further, the gearing ratio of P&G and PepsiCo is 2.01 and 4.36. It
explains that investment position of the company has been better and still, the company is
required to enhance the earnings level.
Description Formula Unilever P&G
Pepsi
Co
2017 2016 2015 2017 2017
NPAT
518400
0000
490900
0000
517100
0000
521700
0
6329
000
Num of
ordinary shares
284020
0000
283757
2254
284120
8791
25,98,1
00
1439
000
Earnings per
share
NPAT/ Number of
ordinary shares
182.52
%
173.00
%
182.00
%
200.80
%
439.8
2%
Finance
18
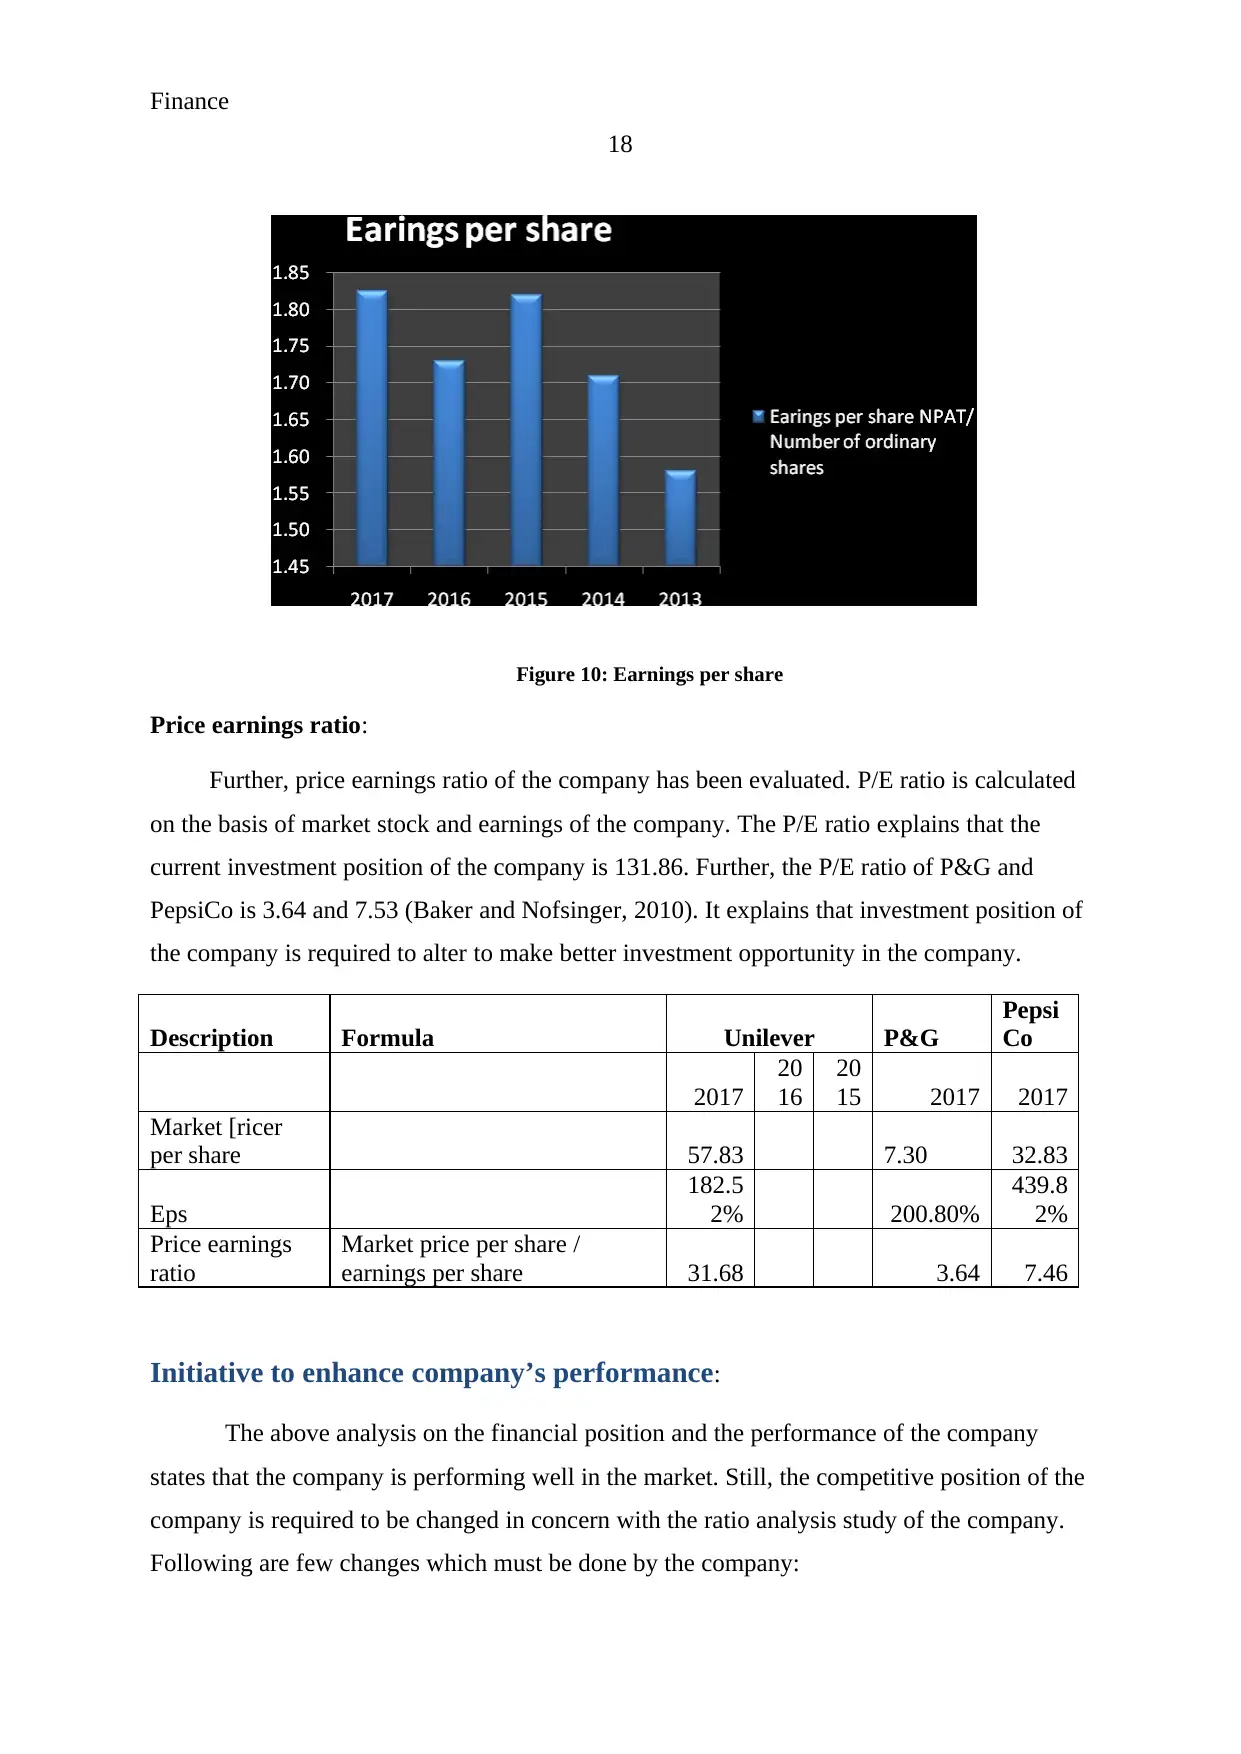
Figure 10: Earnings per share
Price earnings ratio:
Further, price earnings ratio of the company has been evaluated. P/E ratio is calculated
on the basis of market stock and earnings of the company. The P/E ratio explains that the
current investment position of the company is 131.86. Further, the P/E ratio of P&G and
PepsiCo is 3.64 and 7.53 (Baker and Nofsinger, 2010). It explains that investment position of
the company is required to alter to make better investment opportunity in the company.
Description Formula Unilever P&G
Pepsi
Co
2017
20
16
20
15 2017 2017
Market [ricer
per share 57.83 7.30 32.83
Eps
182.5
2% 200.80%
439.8
2%
Price earnings
ratio
Market price per share /
earnings per share 31.68 3.64 7.46
Initiative to enhance company’s performance:
The above analysis on the financial position and the performance of the company
states that the company is performing well in the market. Still, the competitive position of the
company is required to be changed in concern with the ratio analysis study of the company.
Following are few changes which must be done by the company:
18
Figure 10: Earnings per share
Price earnings ratio:
Further, price earnings ratio of the company has been evaluated. P/E ratio is calculated
on the basis of market stock and earnings of the company. The P/E ratio explains that the
current investment position of the company is 131.86. Further, the P/E ratio of P&G and
PepsiCo is 3.64 and 7.53 (Baker and Nofsinger, 2010). It explains that investment position of
the company is required to alter to make better investment opportunity in the company.
Description Formula Unilever P&G
Pepsi
Co
2017
20
16
20
15 2017 2017
Market [ricer
per share 57.83 7.30 32.83
Eps
182.5
2% 200.80%
439.8
2%
Price earnings
ratio
Market price per share /
earnings per share 31.68 3.64 7.46
Initiative to enhance company’s performance:
The above analysis on the financial position and the performance of the company
states that the company is performing well in the market. Still, the competitive position of the
company is required to be changed in concern with the ratio analysis study of the company.
Following are few changes which must be done by the company:

Finance
19
Description Initiatives
Profitability
Return on
shareholder funds
Return on shareholder ratio of the company explains that the
current performance of the company is enough competitive and
the company is required to maintain this level.
Operating profit
margin
Operating profit margin ratio of the company explains that the
current performance of the company is better and the company
is suggested to manage the same level.
Gross Profit
Margin
Gross profit margin ratio of the company explains that the
current performance of the company is enough competitive and
the company is required to maintain this level (Elton et al,
2009).
Liquidity
Current ratio
Current ratio of the company explains that the liquidity
position of the company is not at all good. It showcases about
the bad position of the company and depicts that the company
would not be able to pay its entire short term debt obligation at
any time.
Acid test ratios
Acid test ratio of the company explains that the liquidity
position of the company is not at all good. It showcases about
the bad position of the company and depicts that the company
would not be able to pay its entire short term debt obligation at
any time.
Efficiency
Receivables
collection period
Receivable collection period of the company explains that the
receivable turnover of the company is quite less and thus it is
quite good for the company.
Payables
collection period
Payable payment period of the company explains that the
payable turnover of the company is quite less and thus it is
required by the company to reduce the payment turnover.
Inventory days
Inventory days of the company explain that the inventory
turnover of the company is quite less and thus it is quite good
for the company.
Gearing Ratios
Gearing
Gearing ratio of the company explains that the debt and equity
level of the company is not appropriate and the debt level of
the company must be changed for the optimal capital structure
of the company.
Paraphrase This Document
Need a fresh take? Get an instant paraphrase of this document with our AI Paraphraser
Finance
20
Investment ratio
Earnings per
share
Earnings per share of the company explain that the current
earnings of the company are quite attractive and thus no
changes are required to be done (Krantz, 2016).
Price earring
ratio
Price earnings ratio of the company explains about the
competitive position of the company.
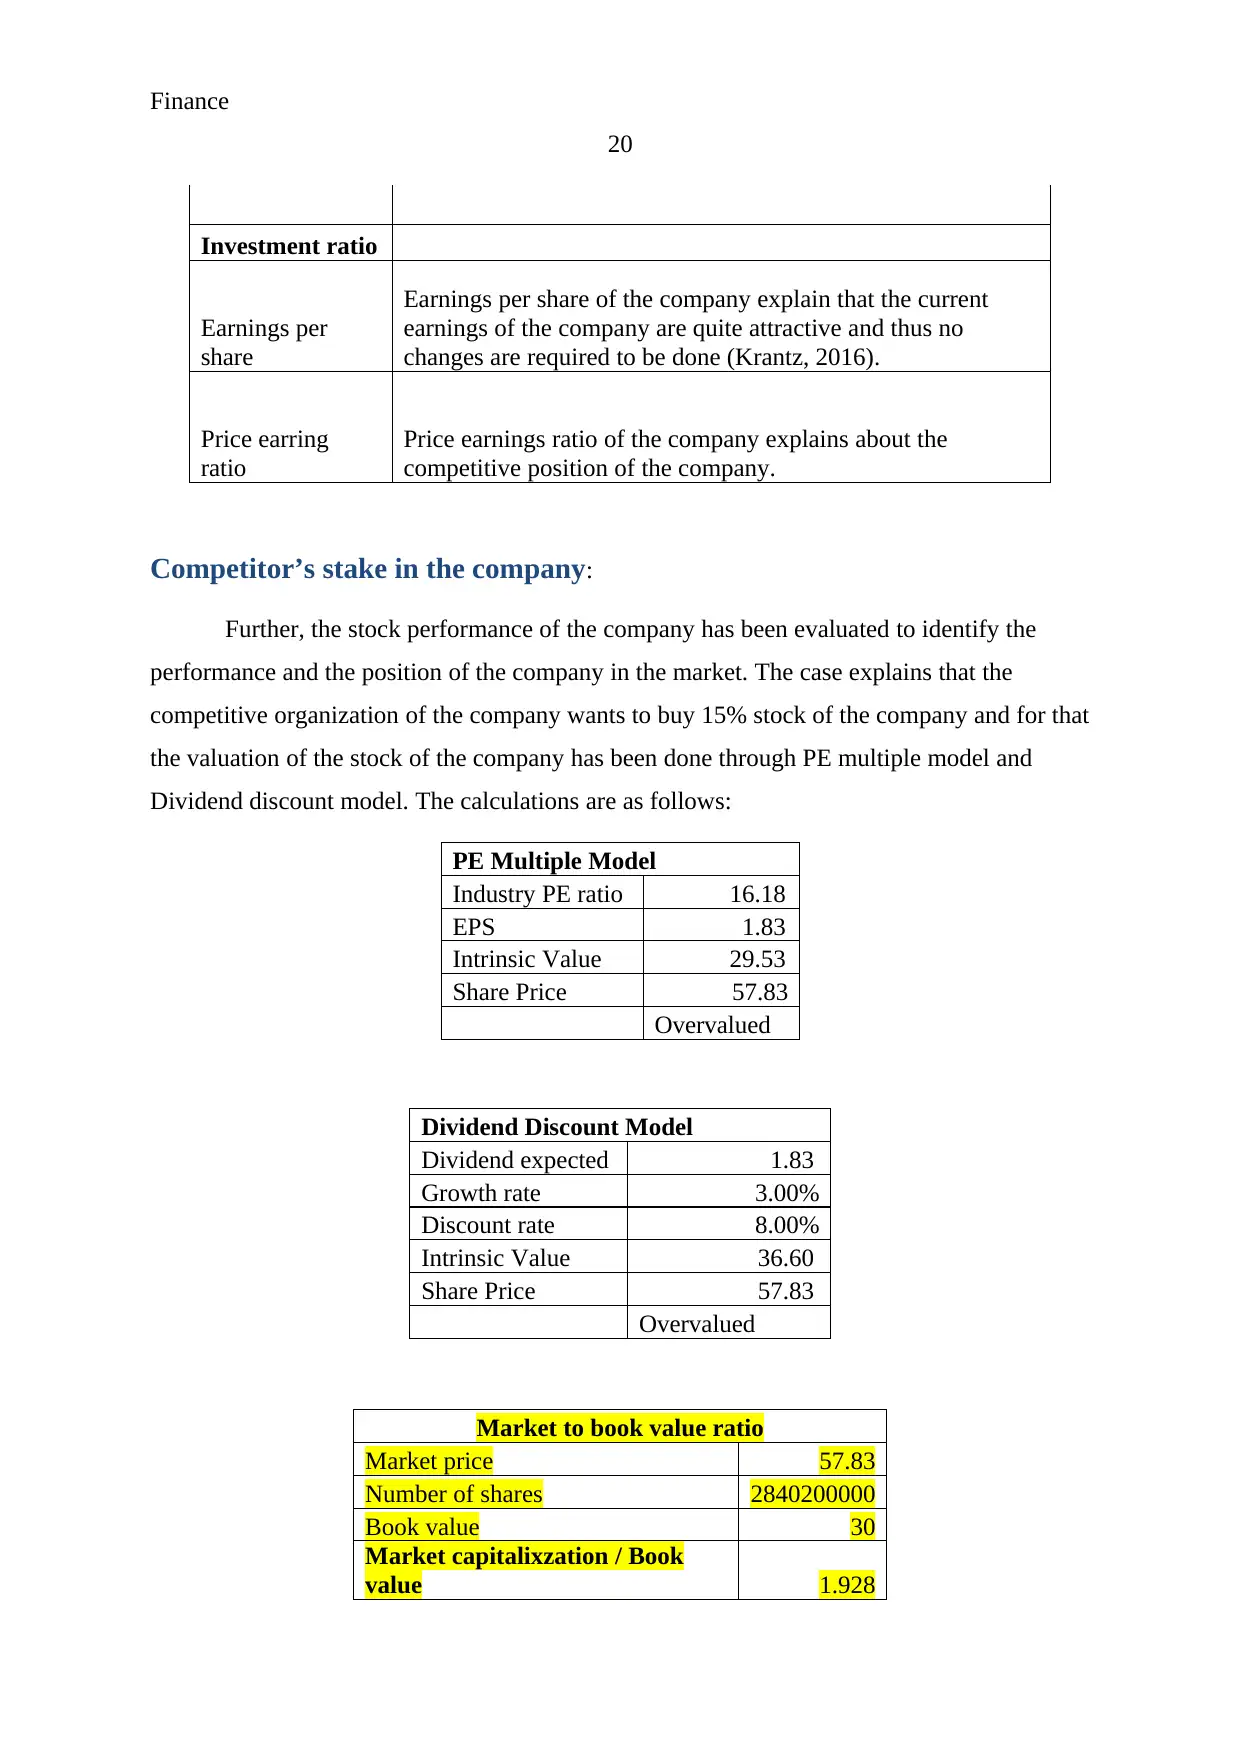
Competitor’s stake in the company:
Further, the stock performance of the company has been evaluated to identify the
performance and the position of the company in the market. The case explains that the
competitive organization of the company wants to buy 15% stock of the company and for that
the valuation of the stock of the company has been done through PE multiple model and
Dividend discount model. The calculations are as follows:
PE Multiple Model
Industry PE ratio 16.18
EPS 1.83
Intrinsic Value 29.53
Share Price 57.83
Overvalued
Dividend Discount Model
Dividend expected 1.83
Growth rate 3.00%
Discount rate 8.00%
Intrinsic Value 36.60
Share Price 57.83
Overvalued
Market to book value ratio
Market price 57.83
Number of shares 2840200000
Book value 30
Market capitalixzation / Book
value 1.928
20
Investment ratio
Earnings per
share
Earnings per share of the company explain that the current
earnings of the company are quite attractive and thus no
changes are required to be done (Krantz, 2016).
Price earring
ratio
Price earnings ratio of the company explains about the
competitive position of the company.
Competitor’s stake in the company:
Further, the stock performance of the company has been evaluated to identify the
performance and the position of the company in the market. The case explains that the
competitive organization of the company wants to buy 15% stock of the company and for that
the valuation of the stock of the company has been done through PE multiple model and
Dividend discount model. The calculations are as follows:
PE Multiple Model
Industry PE ratio 16.18
EPS 1.83
Intrinsic Value 29.53
Share Price 57.83
Overvalued
Dividend Discount Model
Dividend expected 1.83
Growth rate 3.00%
Discount rate 8.00%
Intrinsic Value 36.60
Share Price 57.83
Overvalued
Market to book value ratio
Market price 57.83
Number of shares 2840200000
Book value 30
Market capitalixzation / Book
value 1.928
Finance
21
Both of these valuation models explains that the stock price of the company is
overvalued and thus this is not the right time for the competitive company to buy the stocks
of the company. The stocks must be bought by the company when the stock position of the
company is undervalued. PE multiple model of the company explains that the intrinsic value
of the stock should be $ 29.53 which is quite lower than the actual market price of the
company $ 57.83 so this is not the right time to buy the stock (Kruth, 2013).
On the other hand, dividend discount model of the company explains that the intrinsic
value of the stock is $ 36.60 which is quite lower than the actual market price of the company
$ 57.83 so this is not the right time to buy the stock. The market price of the stock of the
company is $ 57.83 which is quite higher then the book value of the stock of the company. It
explains that the market position of the company is quite strong. Further, market book ratio
also explains that the position and the performance of the company is way better in the
market.
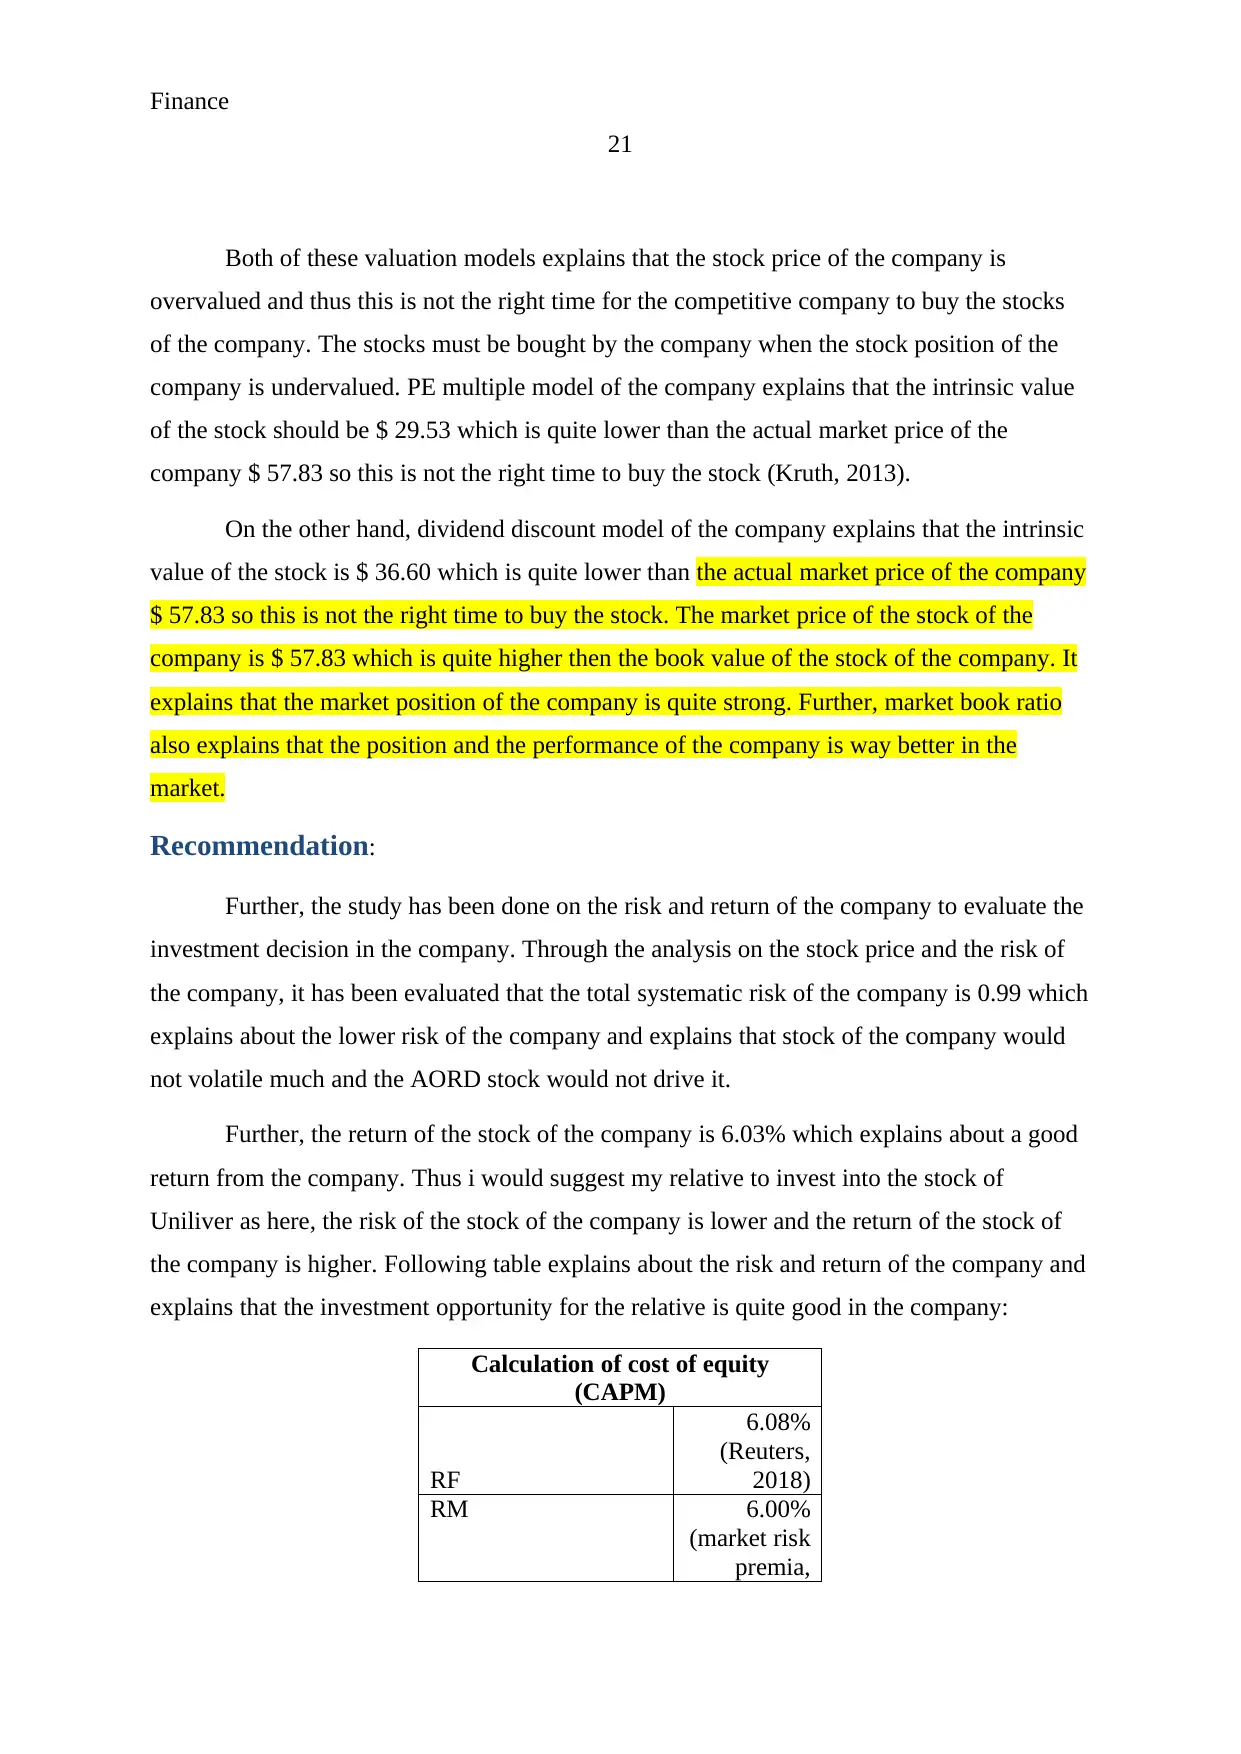
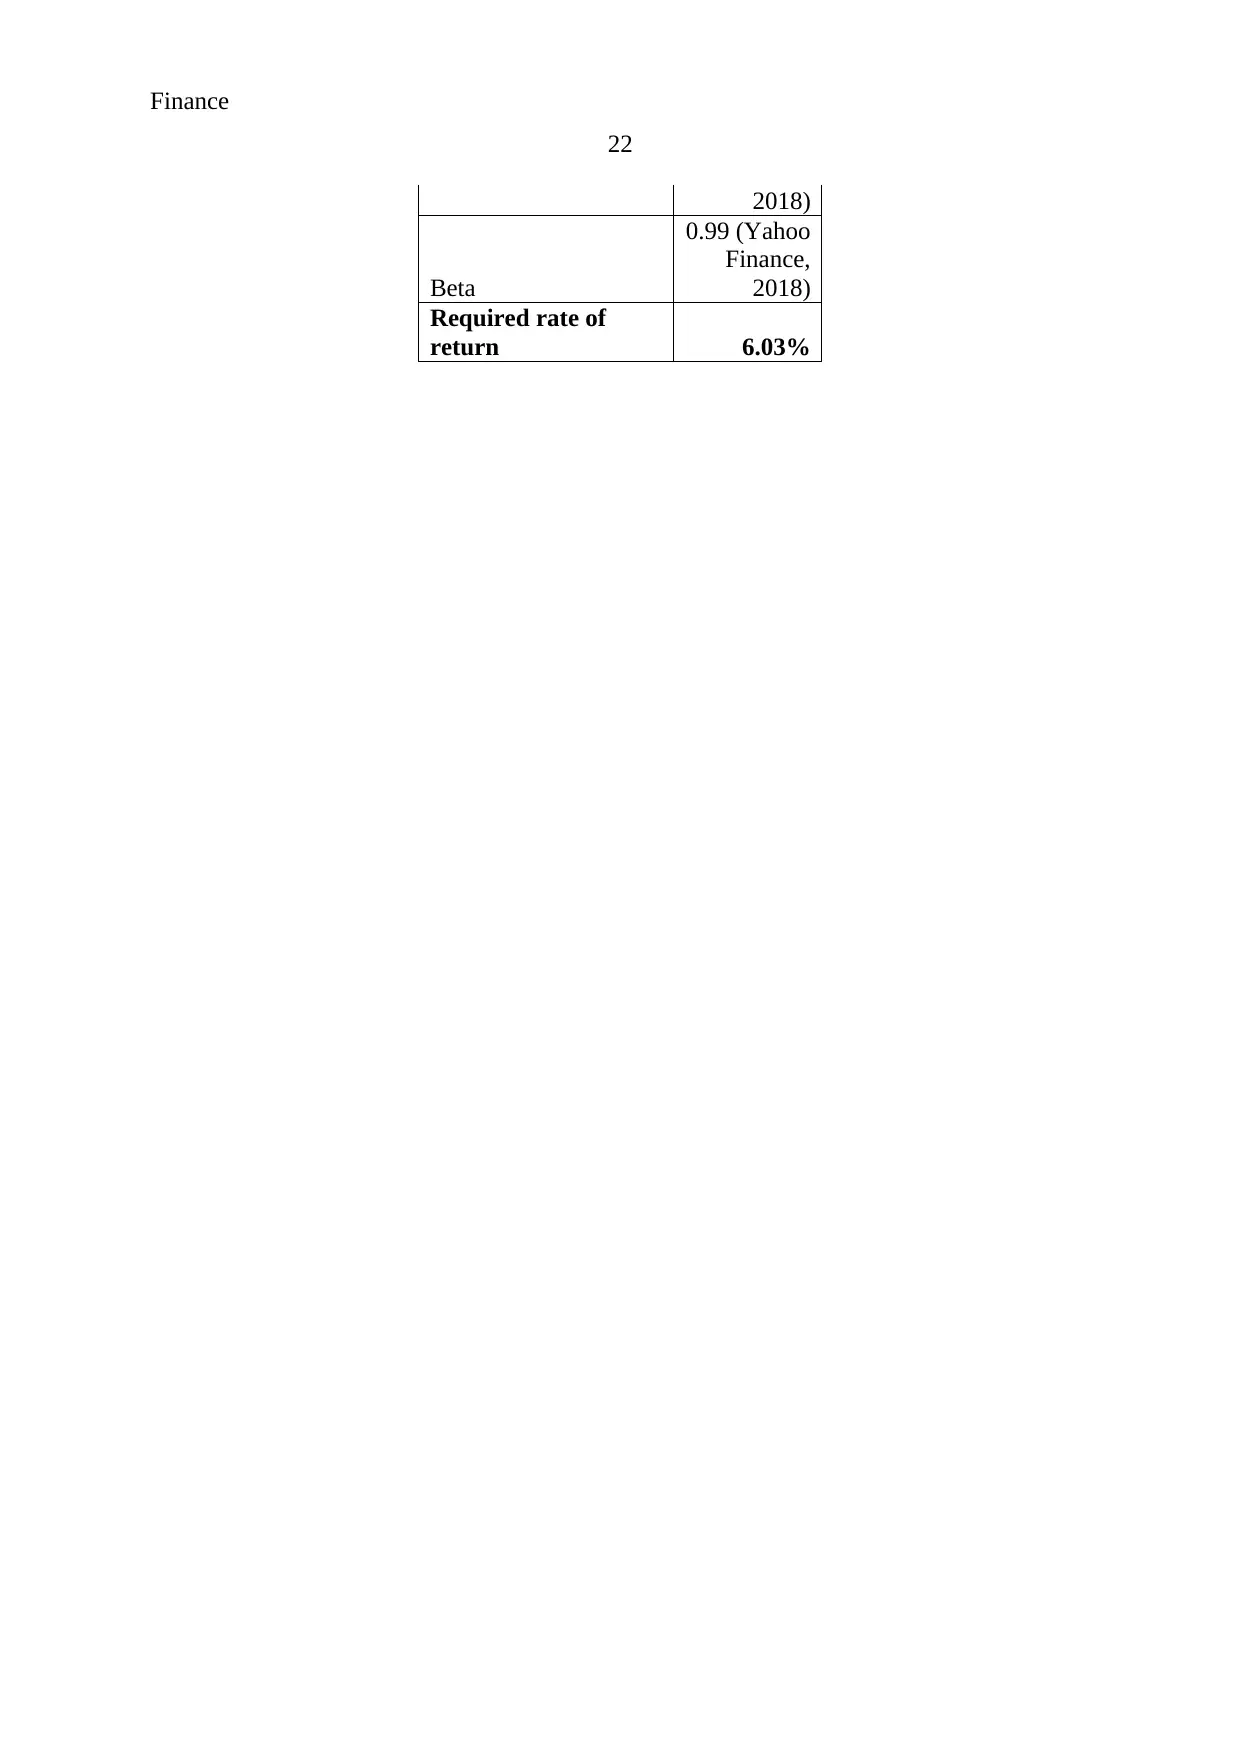
Recommendation:
Further, the study has been done on the risk and return of the company to evaluate the
investment decision in the company. Through the analysis on the stock price and the risk of
the company, it has been evaluated that the total systematic risk of the company is 0.99 which
explains about the lower risk of the company and explains that stock of the company would
not volatile much and the AORD stock would not drive it.
Further, the return of the stock of the company is 6.03% which explains about a good
return from the company. Thus i would suggest my relative to invest into the stock of
Uniliver as here, the risk of the stock of the company is lower and the return of the stock of
the company is higher. Following table explains about the risk and return of the company and
explains that the investment opportunity for the relative is quite good in the company:
Calculation of cost of equity
(CAPM)
RF
6.08%
(Reuters,
2018)
RM 6.00%
(market risk
premia,
21
Both of these valuation models explains that the stock price of the company is
overvalued and thus this is not the right time for the competitive company to buy the stocks
of the company. The stocks must be bought by the company when the stock position of the
company is undervalued. PE multiple model of the company explains that the intrinsic value
of the stock should be $ 29.53 which is quite lower than the actual market price of the
company $ 57.83 so this is not the right time to buy the stock (Kruth, 2013).
On the other hand, dividend discount model of the company explains that the intrinsic
value of the stock is $ 36.60 which is quite lower than the actual market price of the company
$ 57.83 so this is not the right time to buy the stock. The market price of the stock of the
company is $ 57.83 which is quite higher then the book value of the stock of the company. It
explains that the market position of the company is quite strong. Further, market book ratio
also explains that the position and the performance of the company is way better in the
market.
Recommendation:
Further, the study has been done on the risk and return of the company to evaluate the
investment decision in the company. Through the analysis on the stock price and the risk of
the company, it has been evaluated that the total systematic risk of the company is 0.99 which
explains about the lower risk of the company and explains that stock of the company would
not volatile much and the AORD stock would not drive it.
Further, the return of the stock of the company is 6.03% which explains about a good
return from the company. Thus i would suggest my relative to invest into the stock of
Uniliver as here, the risk of the stock of the company is lower and the return of the stock of
the company is higher. Following table explains about the risk and return of the company and
explains that the investment opportunity for the relative is quite good in the company:
Calculation of cost of equity
(CAPM)
RF
6.08%
(Reuters,
2018)
RM 6.00%
(market risk
premia,
Finance
22
2018)
Beta
0.99 (Yahoo
Finance,
2018)
Required rate of
return 6.03%
22
2018)
Beta
0.99 (Yahoo
Finance,
2018)
Required rate of
return 6.03%
Secure Best Marks with AI Grader
Need help grading? Try our AI Grader for instant feedback on your assignments.
Finance
23
References
Ackert, L. and Deaves, R. 2009. Behavioral Finance: Psychology, Decision-Making, and
Markets. Cengage Learning.
Baker, H.K. and Nofsinger, J.R. 2010. Behavioral Finance: Investors, Corporations, and
Markets. John Wiley & Sons.
Baker, H.K. and Weigand, R., 2015. 777777. Managerial Finance, 41(2), pp.126-144.
Barman, G.P., 2008. An evaluation of how dividend policies impact on the share value of
selected companies. McGraw-Hill.
Bodie, Z., 2013. Investments. McGraw-Hill.
Bradford, W., Chen, C. and Zhu, S., 2013. Cash dividend policy, corporate pyramids, and
ownership structure: Evidence from China. International Review of Economics &
Finance, 27, pp.445-464.
Brealey, R., Myers, S.C. and Marcus, A.J., 2007. FundamentalsofCorporate Finance. Mc
Graw Hill, New York.
Breuer, W., Rieger, M.O. and Soypak, K.C., 2014. The behavioral foundations of corporate
dividend policy a cross-country analysis. Journal of Banking & Finance, 42, pp.247-265.
Davies, T. and Crawford, I., 2011. Business accounting and finance. Pearson.
Elton, E.J., Gruber, M.J., Brown, S.J., and Goetzmann, W.N. 2009. Modern Portfolio Theory
and Investment Analysis. John Wiley & Sons.
Home. 2018. Unilever plc. Viewed 7 Fe 2018, https://www.unilever.com/
Kinsky, R. 2011. Charting Made Simple: A Beginner's Guide to Technical Analysis. John
Wiley & Sons.
Krantz, M. 2016. Fundamental Analysis for Dummies. John Wiley & Sons.
Finance
24
Kurth, S. 2013. Critical Review about Implications of the Efficient Market Hypothesis. GRIN
Verlag.
Madura, J. 2014. Financial Markets and Institutions. Cengage Learning.
Market risk Premia. 2018. IMRP. Viewed 7 Feb 2018,
http://www.market-risk-premia.com/gb.html
Morningstar. 2018. Pepsico Plc. Viewed 7 Feb 2018,
http://financials.morningstar.com/income-statement/is.html?t=PEP
Morningstar. 2018. Proctor and Gamble Plc. Viewed 7 Feb 2018,
http://financials.morningstar.com/ratios/r.html?t=PG
Morningstar. 2018. Unilever Plc. Viewed 7 Feb 2018, http://financials.morningstar.com/cash-
flow/cf.html?t=UL®ion=usa&culture=en-US
Palicka, V.J. 2011. Fusion Analysis: Merging Fundamental and Technical Analysis for Risk-
Adjusted Excess Returns. McGraw Hill Professional.
Phillips, P.P. and Stawarski, C.A. 2016. Data Collection: Planning for and Collecting All
Types of Data. John Wiley & Sons.
Reuters. 2018. Unilever Plc. Viewed 7 Feb 2018,
https://www.reuters.com/finance/stocks/overview/ULVR.L
Schlichting, T. 2013. Fundamental Analysis, Behavioral Finance and Technical Analysis on
the Stock Market. GRIN Verlag.
Yahoo Finance. 2018. Unilever Plc. Viewed 7 Feb 2018,
https://au.finance.yahoo.com/quote/UN/history?p=UN
Finance
25
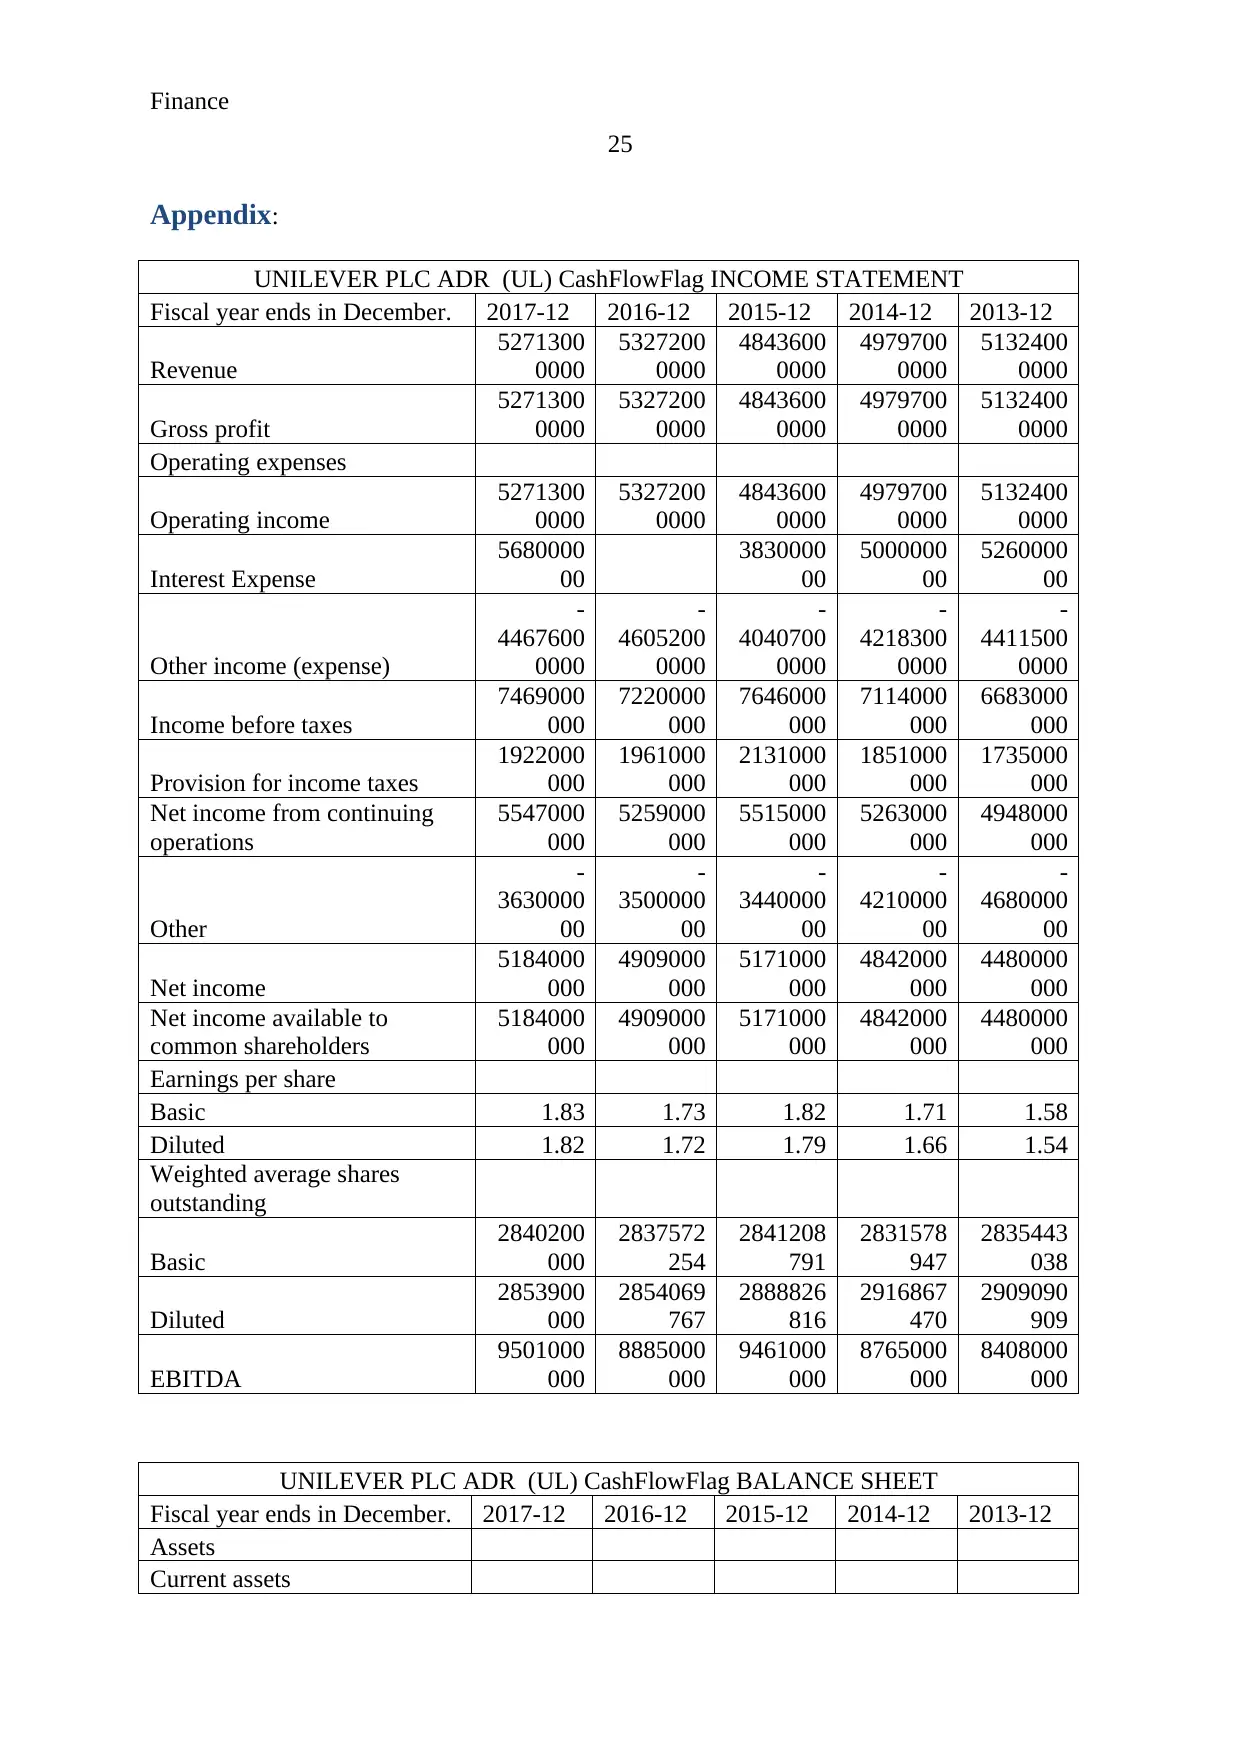
Appendix:
UNILEVER PLC ADR (UL) CashFlowFlag INCOME STATEMENT
Fiscal year ends in December. 2017-12 2016-12 2015-12 2014-12 2013-12
Revenue
5271300
0000
5327200
0000
4843600
0000
4979700
0000
5132400
0000
Gross profit
5271300
0000
5327200
0000
4843600
0000
4979700
0000
5132400
0000
Operating expenses
Operating income
5271300
0000
5327200
0000
4843600
0000
4979700
0000
5132400
0000
Interest Expense
5680000
00
3830000
00
5000000
00
5260000
00
Other income (expense)
-
4467600
0000
-
4605200
0000
-
4040700
0000
-
4218300
0000
-
4411500
0000
Income before taxes
7469000
000
7220000
000
7646000
000
7114000
000
6683000
000
Provision for income taxes
1922000
000
1961000
000
2131000
000
1851000
000
1735000
000
Net income from continuing
operations
5547000
000
5259000
000
5515000
000
5263000
000
4948000
000
Other
-
3630000
00
-
3500000
00
-
3440000
00
-
4210000
00
-
4680000
00
Net income
5184000
000
4909000
000
5171000
000
4842000
000
4480000
000
Net income available to
common shareholders
5184000
000
4909000
000
5171000
000
4842000
000
4480000
000
Earnings per share
Basic 1.83 1.73 1.82 1.71 1.58
Diluted 1.82 1.72 1.79 1.66 1.54
Weighted average shares
outstanding
Basic
2840200
000
2837572
254
2841208
791
2831578
947
2835443
038
Diluted
2853900
000
2854069
767
2888826
816
2916867
470
2909090
909
EBITDA
9501000
000
8885000
000
9461000
000
8765000
000
8408000
000
UNILEVER PLC ADR (UL) CashFlowFlag BALANCE SHEET
Fiscal year ends in December. 2017-12 2016-12 2015-12 2014-12 2013-12
Assets
Current assets
25
Appendix:
UNILEVER PLC ADR (UL) CashFlowFlag INCOME STATEMENT
Fiscal year ends in December. 2017-12 2016-12 2015-12 2014-12 2013-12
Revenue
5271300
0000
5327200
0000
4843600
0000
4979700
0000
5132400
0000
Gross profit
5271300
0000
5327200
0000
4843600
0000
4979700
0000
5132400
0000
Operating expenses
Operating income
5271300
0000
5327200
0000
4843600
0000
4979700
0000
5132400
0000
Interest Expense
5680000
00
3830000
00
5000000
00
5260000
00
Other income (expense)
-
4467600
0000
-
4605200
0000
-
4040700
0000
-
4218300
0000
-
4411500
0000
Income before taxes
7469000
000
7220000
000
7646000
000
7114000
000
6683000
000
Provision for income taxes
1922000
000
1961000
000
2131000
000
1851000
000
1735000
000
Net income from continuing
operations
5547000
000
5259000
000
5515000
000
5263000
000
4948000
000
Other
-
3630000
00
-
3500000
00
-
3440000
00
-
4210000
00
-
4680000
00
Net income
5184000
000
4909000
000
5171000
000
4842000
000
4480000
000
Net income available to
common shareholders
5184000
000
4909000
000
5171000
000
4842000
000
4480000
000
Earnings per share
Basic 1.83 1.73 1.82 1.71 1.58
Diluted 1.82 1.72 1.79 1.66 1.54
Weighted average shares
outstanding
Basic
2840200
000
2837572
254
2841208
791
2831578
947
2835443
038
Diluted
2853900
000
2854069
767
2888826
816
2916867
470
2909090
909
EBITDA
9501000
000
8885000
000
9461000
000
8765000
000
8408000
000
UNILEVER PLC ADR (UL) CashFlowFlag BALANCE SHEET
Fiscal year ends in December. 2017-12 2016-12 2015-12 2014-12 2013-12
Assets
Current assets
Paraphrase This Document
Need a fresh take? Get an instant paraphrase of this document with our AI Paraphraser
Finance
26
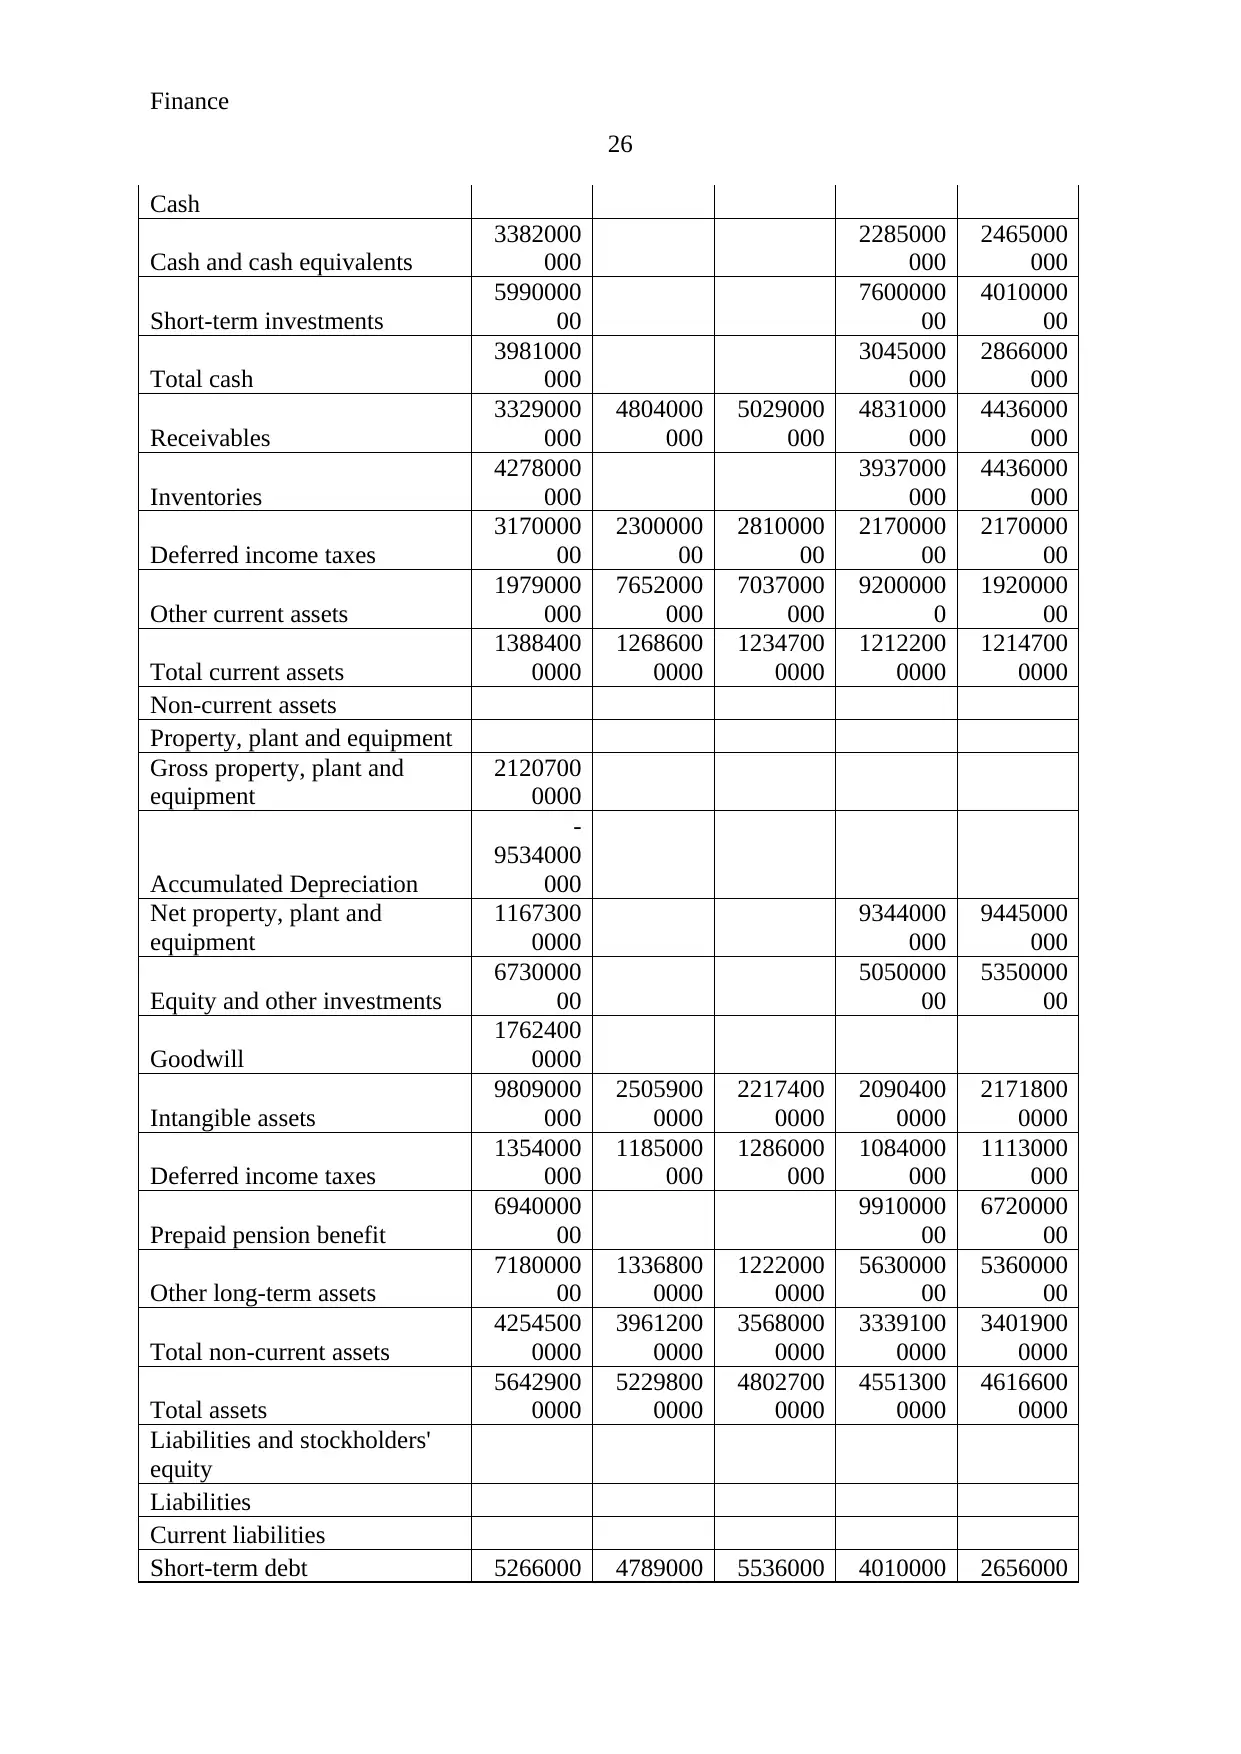
Cash
Cash and cash equivalents
3382000
000
2285000
000
2465000
000
Short-term investments
5990000
00
7600000
00
4010000
00
Total cash
3981000
000
3045000
000
2866000
000
Receivables
3329000
000
4804000
000
5029000
000
4831000
000
4436000
000
Inventories
4278000
000
3937000
000
4436000
000
Deferred income taxes
3170000
00
2300000
00
2810000
00
2170000
00
2170000
00
Other current assets
1979000
000
7652000
000
7037000
000
9200000
0
1920000
00
Total current assets
1388400
0000
1268600
0000
1234700
0000
1212200
0000
1214700
0000
Non-current assets
Property, plant and equipment
Gross property, plant and
equipment
2120700
0000
Accumulated Depreciation
-
9534000
000
Net property, plant and
equipment
1167300
0000
9344000
000
9445000
000
Equity and other investments
6730000
00
5050000
00
5350000
00
Goodwill
1762400
0000
Intangible assets
9809000
000
2505900
0000
2217400
0000
2090400
0000
2171800
0000
Deferred income taxes
1354000
000
1185000
000
1286000
000
1084000
000
1113000
000
Prepaid pension benefit
6940000
00
9910000
00
6720000
00
Other long-term assets
7180000
00
1336800
0000
1222000
0000
5630000
00
5360000
00
Total non-current assets
4254500
0000
3961200
0000
3568000
0000
3339100
0000
3401900
0000
Total assets
5642900
0000
5229800
0000
4802700
0000
4551300
0000
4616600
0000
Liabilities and stockholders'
equity
Liabilities
Current liabilities
Short-term debt 5266000 4789000 5536000 4010000 2656000
26
Cash
Cash and cash equivalents
3382000
000
2285000
000
2465000
000
Short-term investments
5990000
00
7600000
00
4010000
00
Total cash
3981000
000
3045000
000
2866000
000
Receivables
3329000
000
4804000
000
5029000
000
4831000
000
4436000
000
Inventories
4278000
000
3937000
000
4436000
000
Deferred income taxes
3170000
00
2300000
00
2810000
00
2170000
00
2170000
00
Other current assets
1979000
000
7652000
000
7037000
000
9200000
0
1920000
00
Total current assets
1388400
0000
1268600
0000
1234700
0000
1212200
0000
1214700
0000
Non-current assets
Property, plant and equipment
Gross property, plant and
equipment
2120700
0000
Accumulated Depreciation
-
9534000
000
Net property, plant and
equipment
1167300
0000
9344000
000
9445000
000
Equity and other investments
6730000
00
5050000
00
5350000
00
Goodwill
1762400
0000
Intangible assets
9809000
000
2505900
0000
2217400
0000
2090400
0000
2171800
0000
Deferred income taxes
1354000
000
1185000
000
1286000
000
1084000
000
1113000
000
Prepaid pension benefit
6940000
00
9910000
00
6720000
00
Other long-term assets
7180000
00
1336800
0000
1222000
0000
5630000
00
5360000
00
Total non-current assets
4254500
0000
3961200
0000
3568000
0000
3339100
0000
3401900
0000
Total assets
5642900
0000
5229800
0000
4802700
0000
4551300
0000
4616600
0000
Liabilities and stockholders'
equity
Liabilities
Current liabilities
Short-term debt 5266000 4789000 5536000 4010000 2656000
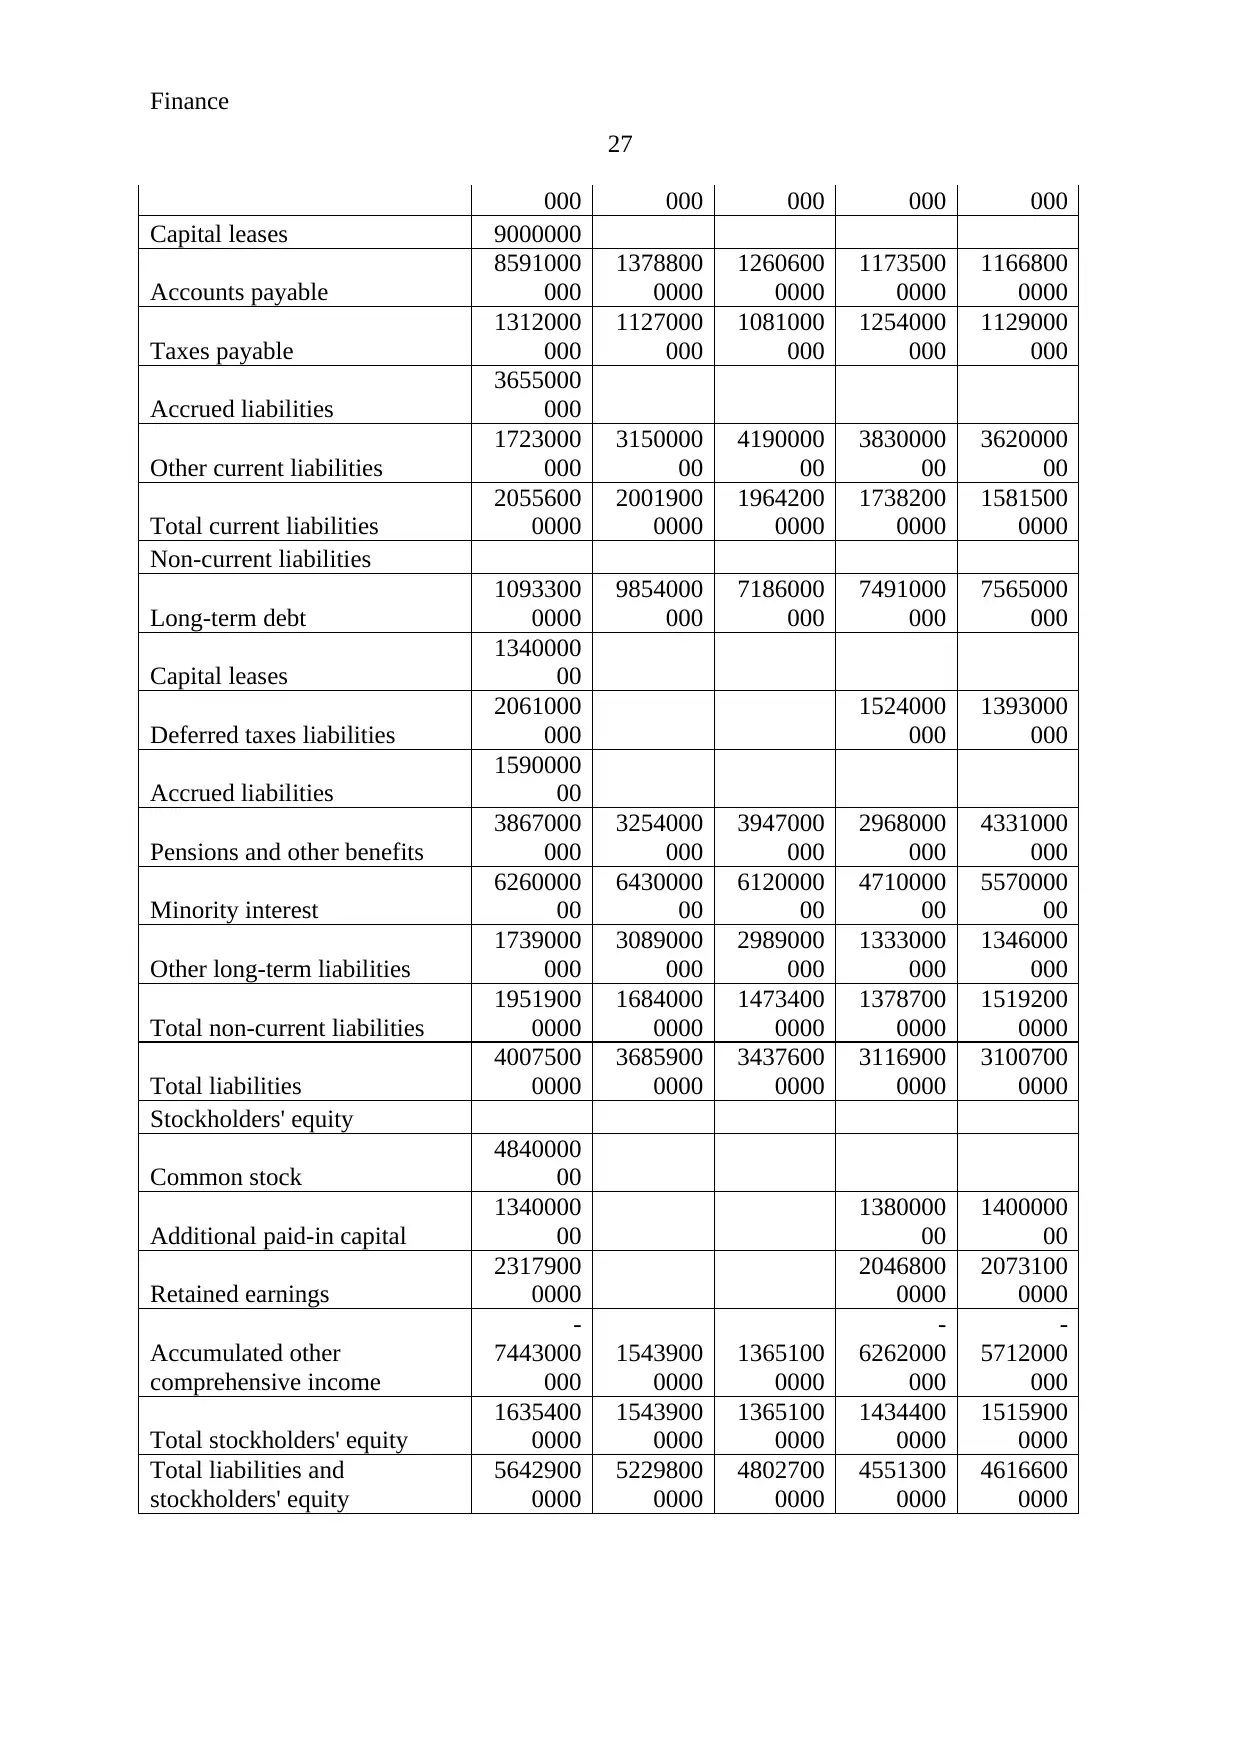
Finance
27
000 000 000 000 000
Capital leases 9000000
Accounts payable
8591000
000
1378800
0000
1260600
0000
1173500
0000
1166800
0000
Taxes payable
1312000
000
1127000
000
1081000
000
1254000
000
1129000
000
Accrued liabilities
3655000
000
Other current liabilities
1723000
000
3150000
00
4190000
00
3830000
00
3620000
00
Total current liabilities
2055600
0000
2001900
0000
1964200
0000
1738200
0000
1581500
0000
Non-current liabilities
Long-term debt
1093300
0000
9854000
000
7186000
000
7491000
000
7565000
000
Capital leases
1340000
00
Deferred taxes liabilities
2061000
000
1524000
000
1393000
000
Accrued liabilities
1590000
00
Pensions and other benefits
3867000
000
3254000
000
3947000
000
2968000
000
4331000
000
Minority interest
6260000
00
6430000
00
6120000
00
4710000
00
5570000
00
Other long-term liabilities
1739000
000
3089000
000
2989000
000
1333000
000
1346000
000
Total non-current liabilities
1951900
0000
1684000
0000
1473400
0000
1378700
0000
1519200
0000
Total liabilities
4007500
0000
3685900
0000
3437600
0000
3116900
0000
3100700
0000
Stockholders' equity
Common stock
4840000
00
Additional paid-in capital
1340000
00
1380000
00
1400000
00
Retained earnings
2317900
0000
2046800
0000
2073100
0000
Accumulated other
comprehensive income
-
7443000
000
1543900
0000
1365100
0000
-
6262000
000
-
5712000
000
Total stockholders' equity
1635400
0000
1543900
0000
1365100
0000
1434400
0000
1515900
0000
Total liabilities and
stockholders' equity
5642900
0000
5229800
0000
4802700
0000
4551300
0000
4616600
0000
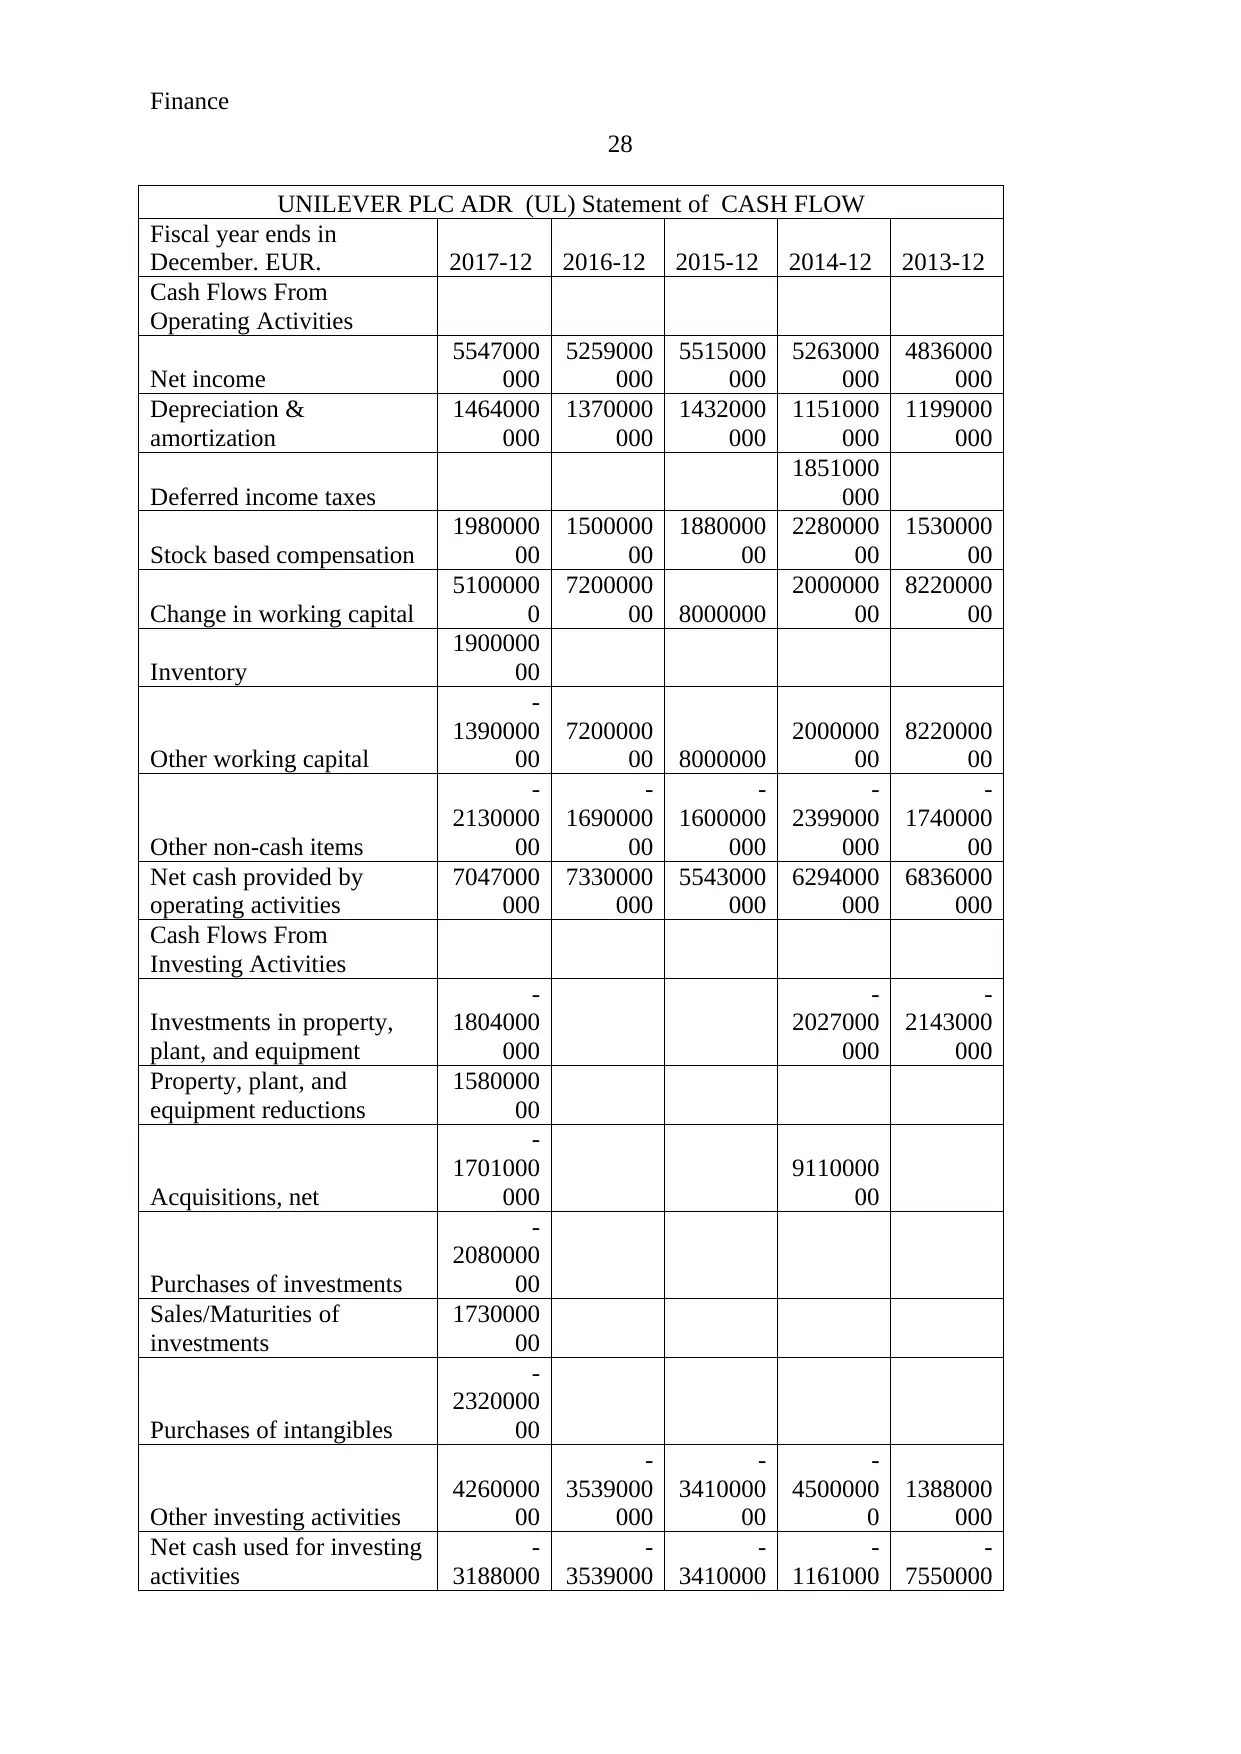
Finance
28
UNILEVER PLC ADR (UL) Statement of CASH FLOW
Fiscal year ends in
December. EUR. 2017-12 2016-12 2015-12 2014-12 2013-12
Cash Flows From
Operating Activities
Net income
5547000
000
5259000
000
5515000
000
5263000
000
4836000
000
Depreciation &
amortization
1464000
000
1370000
000
1432000
000
1151000
000
1199000
000
Deferred income taxes
1851000
000
Stock based compensation
1980000
00
1500000
00
1880000
00
2280000
00
1530000
00
Change in working capital
5100000
0
7200000
00 8000000
2000000
00
8220000
00
Inventory
1900000
00
Other working capital
-
1390000
00
7200000
00 8000000
2000000
00
8220000
00
Other non-cash items
-
2130000
00
-
1690000
00
-
1600000
000
-
2399000
000
-
1740000
00
Net cash provided by
operating activities
7047000
000
7330000
000
5543000
000
6294000
000
6836000
000
Cash Flows From
Investing Activities
Investments in property,
plant, and equipment
-
1804000
000
-
2027000
000
-
2143000
000
Property, plant, and
equipment reductions
1580000
00
Acquisitions, net
-
1701000
000
9110000
00
Purchases of investments
-
2080000
00
Sales/Maturities of
investments
1730000
00
Purchases of intangibles
-
2320000
00
Other investing activities
4260000
00
-
3539000
000
-
3410000
00
-
4500000
0
1388000
000
Net cash used for investing
activities
-
3188000
-
3539000
-
3410000
-
1161000
-
7550000
Secure Best Marks with AI Grader
Need help grading? Try our AI Grader for instant feedback on your assignments.
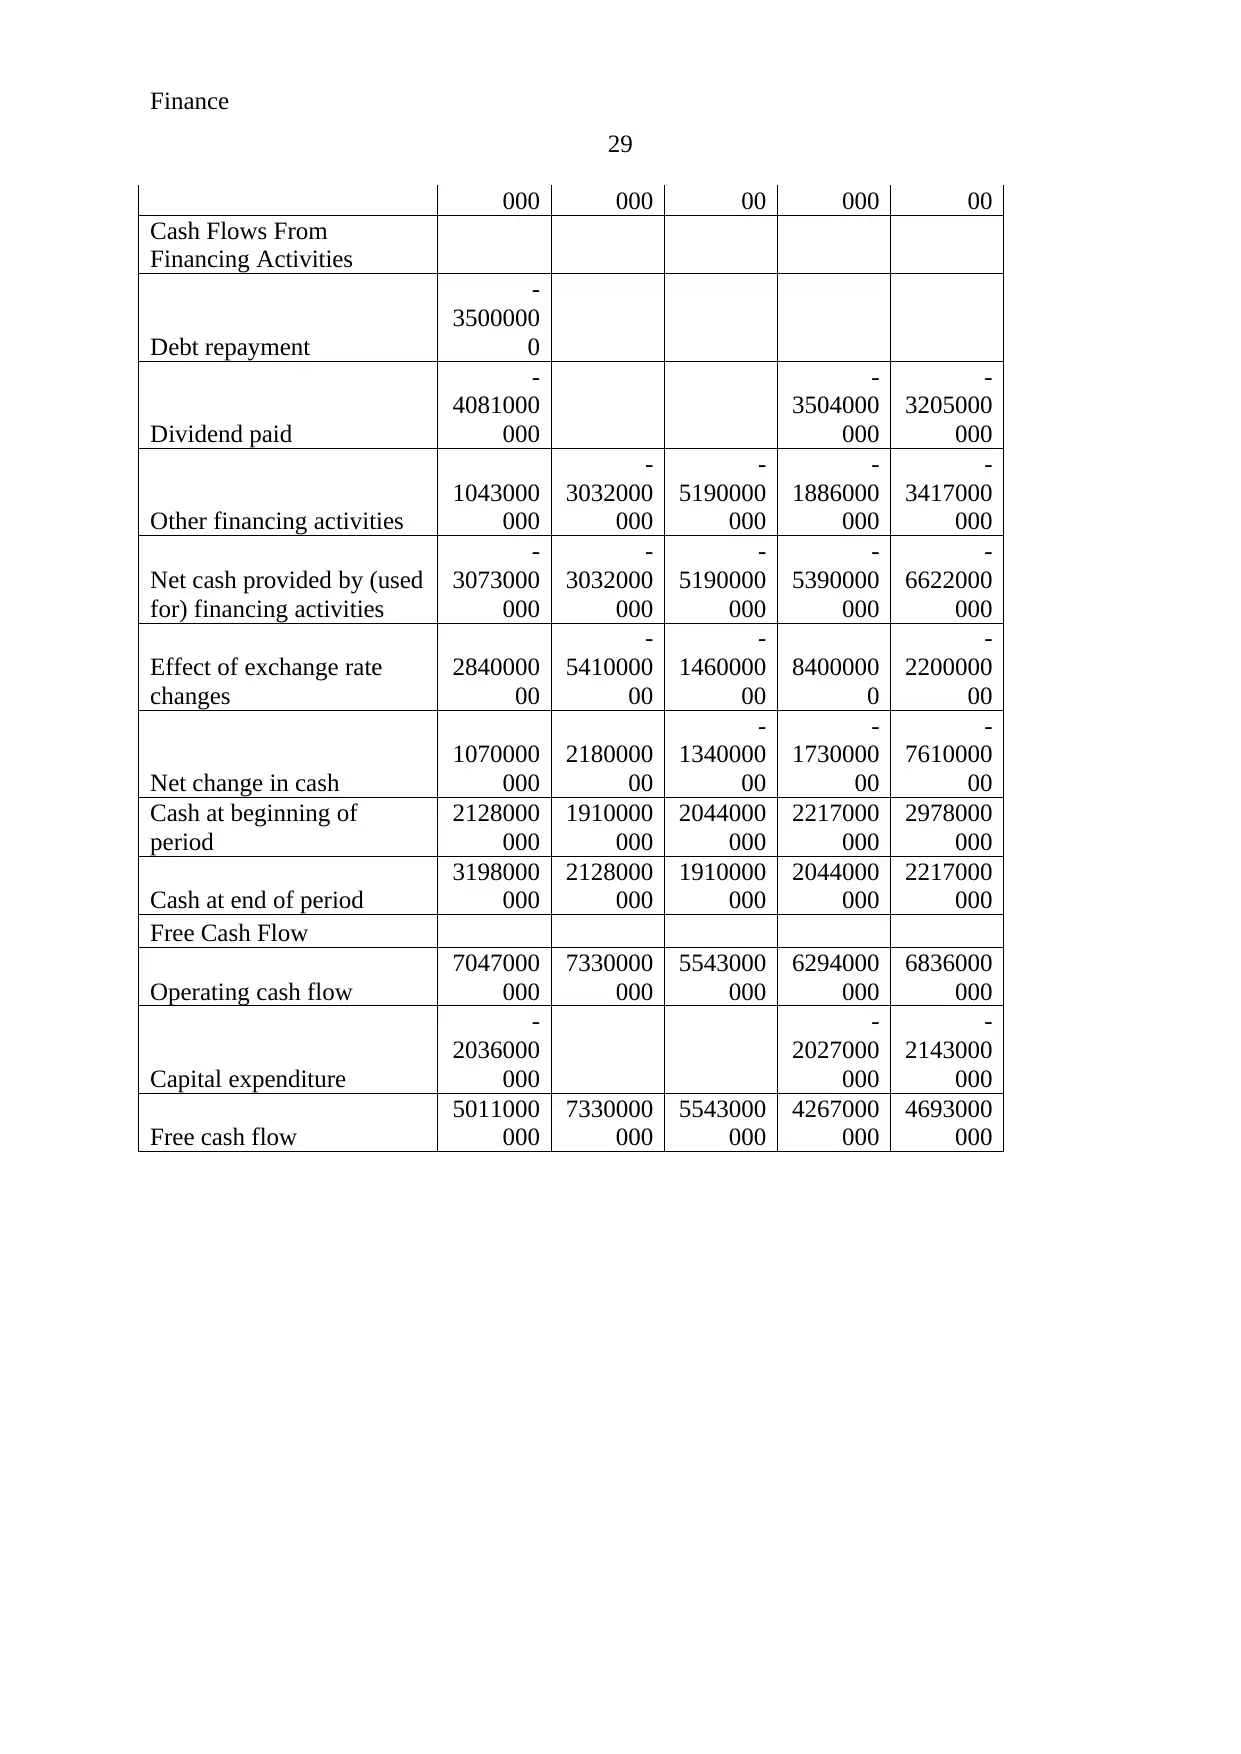
Finance
29
000 000 00 000 00
Cash Flows From
Financing Activities
Debt repayment
-
3500000
0
Dividend paid
-
4081000
000
-
3504000
000
-
3205000
000
Other financing activities
1043000
000
-
3032000
000
-
5190000
000
-
1886000
000
-
3417000
000
Net cash provided by (used
for) financing activities
-
3073000
000
-
3032000
000
-
5190000
000
-
5390000
000
-
6622000
000
Effect of exchange rate
changes
2840000
00
-
5410000
00
-
1460000
00
8400000
0
-
2200000
00
Net change in cash
1070000
000
2180000
00
-
1340000
00
-
1730000
00
-
7610000
00
Cash at beginning of
period
2128000
000
1910000
000
2044000
000
2217000
000
2978000
000
Cash at end of period
3198000
000
2128000
000
1910000
000
2044000
000
2217000
000
Free Cash Flow
Operating cash flow
7047000
000
7330000
000
5543000
000
6294000
000
6836000
000
Capital expenditure
-
2036000
000
-
2027000
000
-
2143000
000
Free cash flow
5011000
000
7330000
000
5543000
000
4267000
000
4693000
000
1 out of 29
Related Documents


Your All-in-One AI-Powered Toolkit for Academic Success.
+13062052269
info@desklib.com
Available 24*7 on WhatsApp / Email
![[object Object]](/_next/static/media/star-bottom.7253800d.svg)
Unlock your academic potential
© 2024 | Zucol Services PVT LTD | All rights reserved.