logo

Financial Management: Ratio Analysis of Zurich Plc. for 2015 and 2016

Analyzing the financial statements of Zurich Plc and addressing concerns regarding profitability and liquidity.

22 Pages4315 Words262 Views
   

Added on  2023-06-11

About This Document

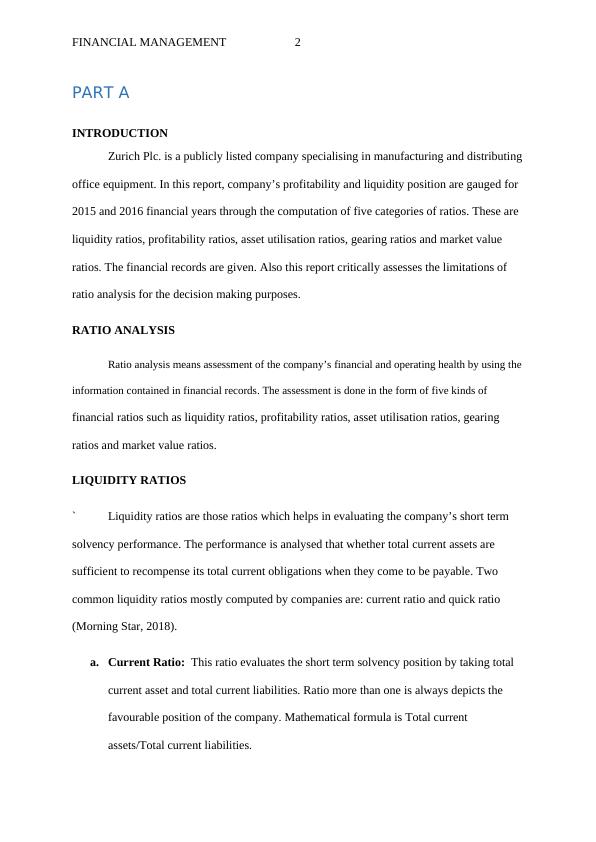
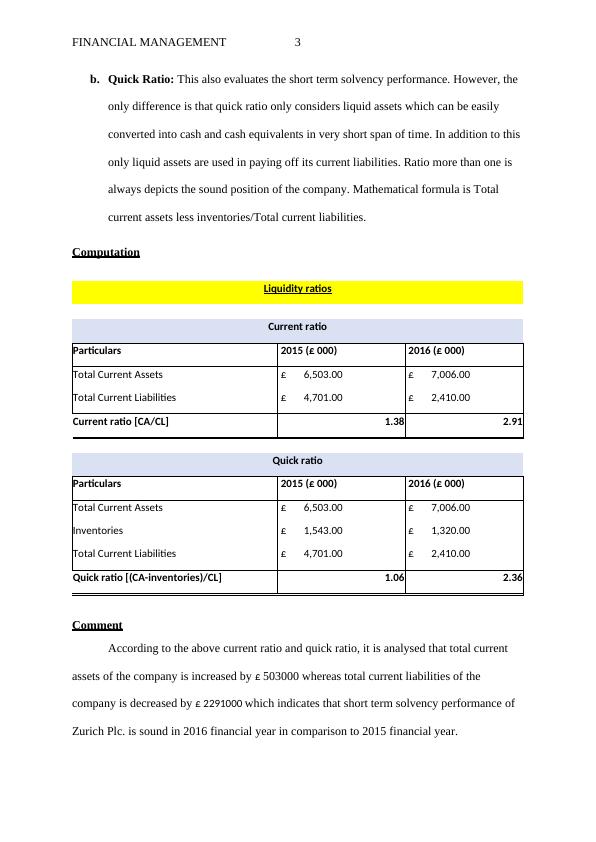
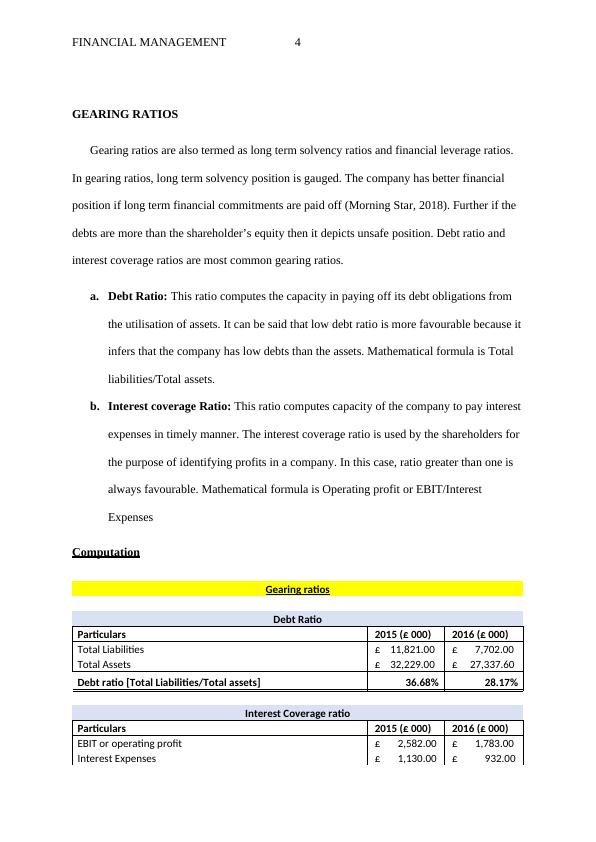
This report analyses the profitability and liquidity position of Zurich Plc. for 2015 and 2016 financial years through the computation of five categories of ratios. It also critically assesses the limitations of ratio analysis for decision making purposes.

Financial Management: Ratio Analysis of Zurich Plc. for 2015 and 2016

Analyzing the financial statements of Zurich Plc and addressing concerns regarding profitability and liquidity.

   Added on 2023-06-11

ShareRelated Documents
RUNNING HEAD: FINANCIAL MANAGEMENT
FINANCIAL MANAGEMENT
Financial Management: Ratio Analysis of Zurich Plc. for 2015 and 2016_1
FINANCIAL MANAGEMENT 1
Contents
PART A...................................................................................................................................................2
PART B.................................................................................................................................................10
REFERENCES........................................................................................................................................20
Financial Management: Ratio Analysis of Zurich Plc. for 2015 and 2016_2
FINANCIAL MANAGEMENT 2
PART A
INTRODUCTION
Zurich Plc. is a publicly listed company specialising in manufacturing and distributing
office equipment. In this report, company’s profitability and liquidity position are gauged for
2015 and 2016 financial years through the computation of five categories of ratios. These are
liquidity ratios, profitability ratios, asset utilisation ratios, gearing ratios and market value
ratios. The financial records are given. Also this report critically assesses the limitations of
ratio analysis for the decision making purposes.
RATIO ANALYSIS
Ratio analysis means assessment of the company’s financial and operating health by using the
information contained in financial records. The assessment is done in the form of five kinds of
financial ratios such as liquidity ratios, profitability ratios, asset utilisation ratios, gearing
ratios and market value ratios.
LIQUIDITY RATIOS
` Liquidity ratios are those ratios which helps in evaluating the company’s short term
solvency performance. The performance is analysed that whether total current assets are
sufficient to recompense its total current obligations when they come to be payable. Two
common liquidity ratios mostly computed by companies are: current ratio and quick ratio
(Morning Star, 2018).
a. Current Ratio: This ratio evaluates the short term solvency position by taking total
current asset and total current liabilities. Ratio more than one is always depicts the
favourable position of the company. Mathematical formula is Total current
assets/Total current liabilities.
Financial Management: Ratio Analysis of Zurich Plc. for 2015 and 2016_3
FINANCIAL MANAGEMENT 3
b. Quick Ratio: This also evaluates the short term solvency performance. However, the
only difference is that quick ratio only considers liquid assets which can be easily
converted into cash and cash equivalents in very short span of time. In addition to this
only liquid assets are used in paying off its current liabilities. Ratio more than one is
always depicts the sound position of the company. Mathematical formula is Total
current assets less inventories/Total current liabilities.
Computation
Liquidity ratios
Current ratio
Particulars 2015 (£ 000) 2016 (£ 000)
Total Current Assets £ 6,503.00 £ 7,006.00
Total Current Liabilities £ 4,701.00 £ 2,410.00
Current ratio [CA/CL] 1.38 2.91
Quick ratio
Particulars 2015 (£ 000) 2016 (£ 000)
Total Current Assets £ 6,503.00 £ 7,006.00
Inventories £ 1,543.00 £ 1,320.00
Total Current Liabilities £ 4,701.00 £ 2,410.00
Quick ratio [(CA-inventories)/CL] 1.06 2.36
Comment
According to the above current ratio and quick ratio, it is analysed that total current
assets of the company is increased by £ 503000 whereas total current liabilities of the
company is decreased by £ 2291000 which indicates that short term solvency performance of
Zurich Plc. is sound in 2016 financial year in comparison to 2015 financial year.
Financial Management: Ratio Analysis of Zurich Plc. for 2015 and 2016_4
FINANCIAL MANAGEMENT 4
GEARING RATIOS
Gearing ratios are also termed as long term solvency ratios and financial leverage ratios.
In gearing ratios, long term solvency position is gauged. The company has better financial
position if long term financial commitments are paid off (Morning Star, 2018). Further if the
debts are more than the shareholder’s equity then it depicts unsafe position. Debt ratio and
interest coverage ratios are most common gearing ratios.
a. Debt Ratio: This ratio computes the capacity in paying off its debt obligations from
the utilisation of assets. It can be said that low debt ratio is more favourable because it
infers that the company has low debts than the assets. Mathematical formula is Total
liabilities/Total assets.
b. Interest coverage Ratio: This ratio computes capacity of the company to pay interest
expenses in timely manner. The interest coverage ratio is used by the shareholders for
the purpose of identifying profits in a company. In this case, ratio greater than one is
always favourable. Mathematical formula is Operating profit or EBIT/Interest
Expenses
Computation
Gearing ratios
Debt Ratio
Particulars 2015 (£ 000) 2016 (£ 000)
Total Liabilities £ 11,821.00 £ 7,702.00
Total Assets £ 32,229.00 £ 27,337.60
Debt ratio [Total Liabilities/Total assets] 36.68% 28.17%
Interest Coverage ratio
Particulars 2015 (£ 000) 2016 (£ 000)
EBIT or operating profit £ 2,582.00 £ 1,783.00
Interest Expenses £ 1,130.00 £ 932.00
Financial Management: Ratio Analysis of Zurich Plc. for 2015 and 2016_5
FINANCIAL MANAGEMENT 5
Interest Coverage ratio [EBIT or Operating Expenses/Interest
Expenses] 2.28 1.91
Comment
According to the above debt ratio and interest coverage ratio, it is analysed that total
assets of the company is decreased by approximately 15% whereas total liabilities of the
company is also decreased by approximately 35% which means that ratio of decrement of
liabilities is more than the ratio of decrement of assets which implies that 2016 has better debt
ratio than 2015. Further addition to this, Zurich Plc has low interest expenses in 2016 as
compare to 2015 which also shows a sound position. Hence, as a whole long term solvency
position of Zurich Plc. is sound in 2016 financial year in comparison to 2015 financial year.
ASSET UTILISATION RATIOS
Asset utilisation ratios are also termed as efficiency ratios and turnover ratios. This ratio
evaluates the profits earned by the company from the asset utilisation (Morning Star, 2018).
Productivity of the company is assessed through computation of asset utilisation ratios. Asset
turnover ratio and inventory turnover ratio are computed.
a. Asset Turnover Ratio: The company’s efficiency is evaluated by utilising the assets in
producing returns. Higher ratio is always favourable because it denotes that the company
has effectively utilised its assets. Mathematical formula is Revenue/Total assets.
b. Inventory Turnover Ratio: The company’s effectiveness is identified through the
computation of this ratio by analysing the utilisation of inventories in an accounting
period. Mathematical formula is Cost of sales/Total inventories.
Computation
Asset utilisation ratios
Asset turnover ratio
Particulars 2015 (£ 000) 2016 (£ 000)
Financial Management: Ratio Analysis of Zurich Plc. for 2015 and 2016_6

End of preview

Want to access all the pages? Upload your documents or become a member.

Related Documents
Financial Marketing
|24
|3883
|42

Auditing Theory and Practice: Financial Statement Analysis and Ratio Calculation
|13
|1932
|401

Financial Ratios and Analysis for ABC Ltd
|11
|1963
|69

Financial Analysis of Tesco: Liquidity, Profitability, Efficiency, and Leverage Ratios
|14
|2135
|73

Report | Comparison Of NEXT Plc & Morrison | Profitability, Liquidity
|14
|2058
|80

Financial Performance Analysis of Qantas Airways
|20
|4490
|470