Business Economics: Macroeconomic Analysis of Australian Economy
VerifiedAdded on 2021/05/30
|15
|3263
|127
Report
AI Summary
This business economics assignment analyzes various economic variables of the Australian economy using data from the World Bank from 1990 to 2016. The report investigates the relationships between real GDP growth and inflation, as well as unemployment, providing evidence of business cycles. It examines the relationship between net exports and real exchange rates between the USA and Australia, alongside the correlation between Australia's cash rate and federal funds rate. The analysis explores macroeconomic trends, including inflation and recession possibilities based on the gathered data. The assignment concludes with an outlook on the Australian economy, drawing insights from the relationships and trends observed in the economic variables.
Business Economics
Name of the Student:
Name of the University:
Author’s Note:
Name of the Student:
Name of the University:
Author’s Note:
Paraphrase This Document
Need a fresh take? Get an instant paraphrase of this document with our AI Paraphraser
1
Table of Contents
Introduction......................................................................................................................................2
Relationship between Australia’s Real GDP Growth Rate and Inflation Rate...............................2
Relationship between Australia’s real GDP Growth Rate and Unemployment Rate......................4
Evidence of Business Cycle.............................................................................................................5
Relationship between Net Exports and the Real Exchange Rates between USA and Australia.....5
Relation between Australia’s Cash Rate and Federal......................................................................8
Macroeconomic Outlook of Australia...........................................................................................10
Conclusion.....................................................................................................................................11
Reference List................................................................................................................................12
2
Introduction
The assignment will shed light over the different economic variables of the Australian economy
and these variables will be discussed in accordance with the real time data available in the World
Bank website. Furthermore it would be investigated whether there is a relationship between these
variables or not. Finally the assignment would conclude on the basis of the entire analysis
whether the Australian economy would face an inflation or a recession in near future.
Relationship between Australia’s Real GDP Growth Rate and Inflation Rate
The Gross Domestic Product or GDP is the final monetary value of all the finished goods and
services produced within the boundaries of a nation within a specific time period. The gross
domestic product incorporates the public and private consumptions, private inventories,
construction costs which are paid-in as well as the foreign balance of trade. Therefore, on a
broader sense it can be stated that GDP is a measure of the overall economic activity of an
economy. Most commonly GDP measures the overall economic activity of a nation and at the
same time provides a broader idea about the standard of living of the country (Hatfield-Dodds et
al., 2015). The GDP can be categorized as nominal GDP and real GDP. The nominal GDP is not
adjusted against any value while the real GDP is adjusted for inflation. Inflation is defined as the
sustained rise in the general price level of the goods and services. In relation to this the rate of
inflation will them be defined as the rate at which the price level of the goods and services
increase over time.
⊘ This is a preview!⊘
Do you want full access?
Subscribe today to unlock all pages.
Trusted by 1+ million students worldwide
3
1990
1991
1992
1993
1994
1995
1996
1997
1998
1999
2000
2001
2002
2003
2004
2005
2006
2007
2008
2009
2010
2011
2012
2013
2014
2015
2016
-15.00
-10.00
-5.00
0.00
5.00
10.00
15.00
20.00
25.00
30.00
35.00
Real GDP Growth Rate and Inflation
Rate
GDP Growth Rate Inflation Rate
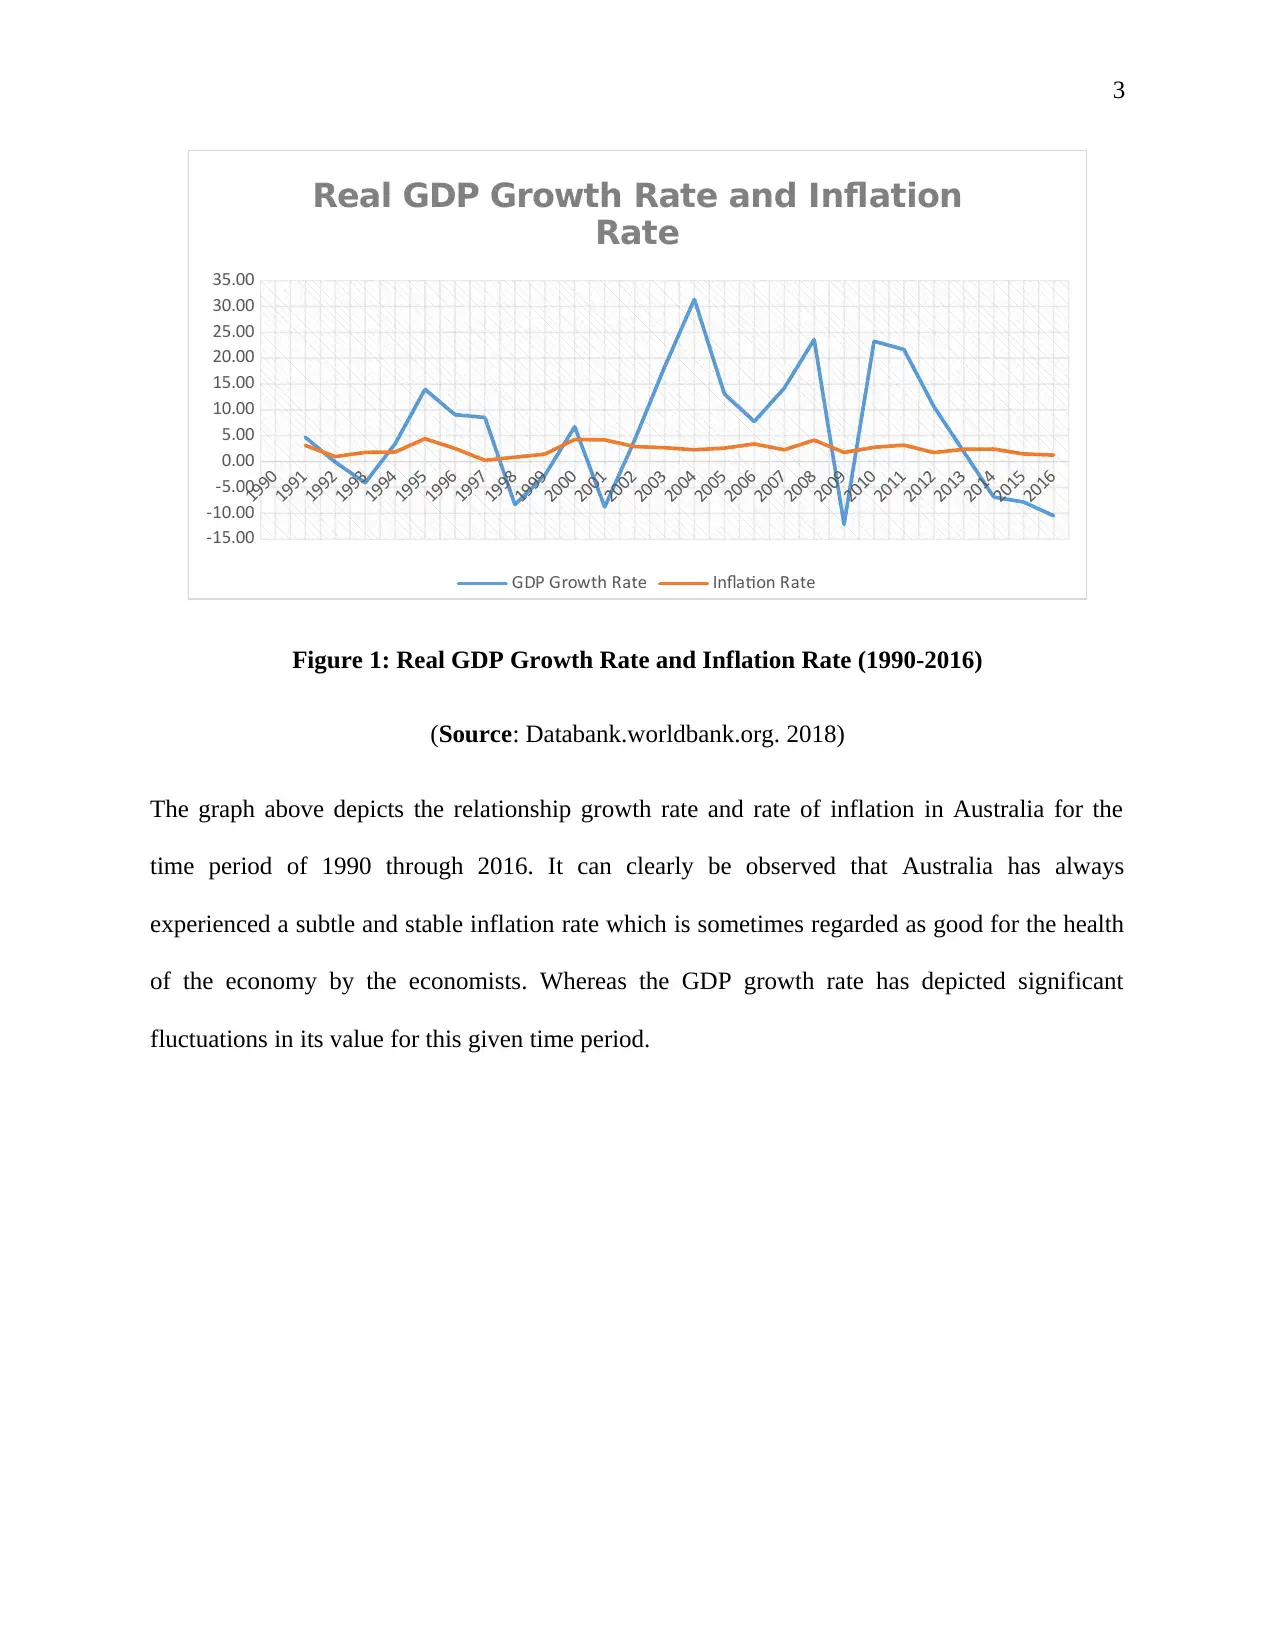
Figure 1: Real GDP Growth Rate and Inflation Rate (1990-2016)
(Source: Databank.worldbank.org. 2018)
The graph above depicts the relationship growth rate and rate of inflation in Australia for the
time period of 1990 through 2016. It can clearly be observed that Australia has always
experienced a subtle and stable inflation rate which is sometimes regarded as good for the health
of the economy by the economists. Whereas the GDP growth rate has depicted significant
fluctuations in its value for this given time period.
1990
1991
1992
1993
1994
1995
1996
1997
1998
1999
2000
2001
2002
2003
2004
2005
2006
2007
2008
2009
2010
2011
2012
2013
2014
2015
2016
-15.00
-10.00
-5.00
0.00
5.00
10.00
15.00
20.00
25.00
30.00
35.00
Real GDP Growth Rate and Inflation
Rate
GDP Growth Rate Inflation Rate
Figure 1: Real GDP Growth Rate and Inflation Rate (1990-2016)
(Source: Databank.worldbank.org. 2018)
The graph above depicts the relationship growth rate and rate of inflation in Australia for the
time period of 1990 through 2016. It can clearly be observed that Australia has always
experienced a subtle and stable inflation rate which is sometimes regarded as good for the health
of the economy by the economists. Whereas the GDP growth rate has depicted significant
fluctuations in its value for this given time period.
Paraphrase This Document
Need a fresh take? Get an instant paraphrase of this document with our AI Paraphraser
4
Relationship between Australia’s real GDP Growth Rate and Unemployment Rate
1990
1991
1992
1993
1994
1995
1996
1997
1998
1999
2000
2001
2002
2003
2004
2005
2006
2007
2008
2009
2010
2011
2012
2013
2014
2015
2016
-15
-10
-5
0
5
10
15
20
25
30
35
Real GDP Growth Rate and
Unemployment
GDP Growth Rate Unemployment Rate
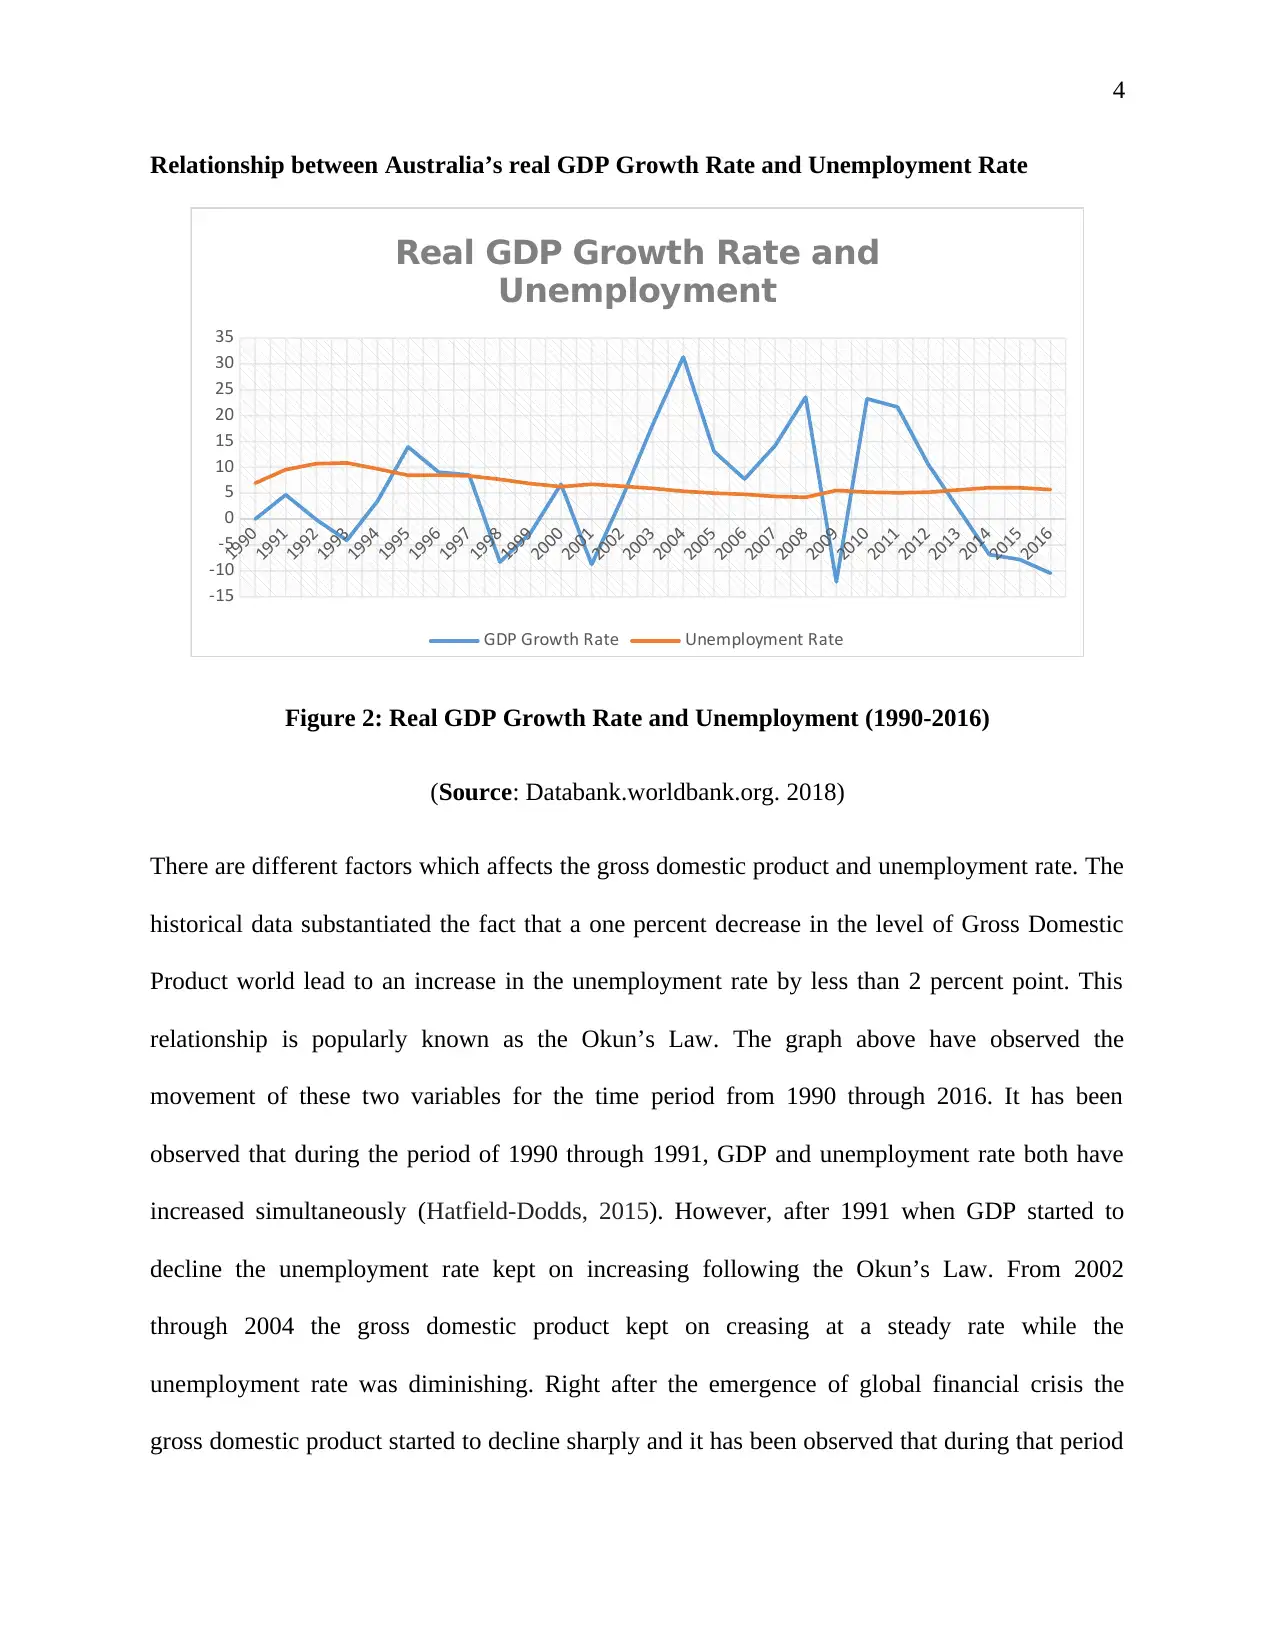
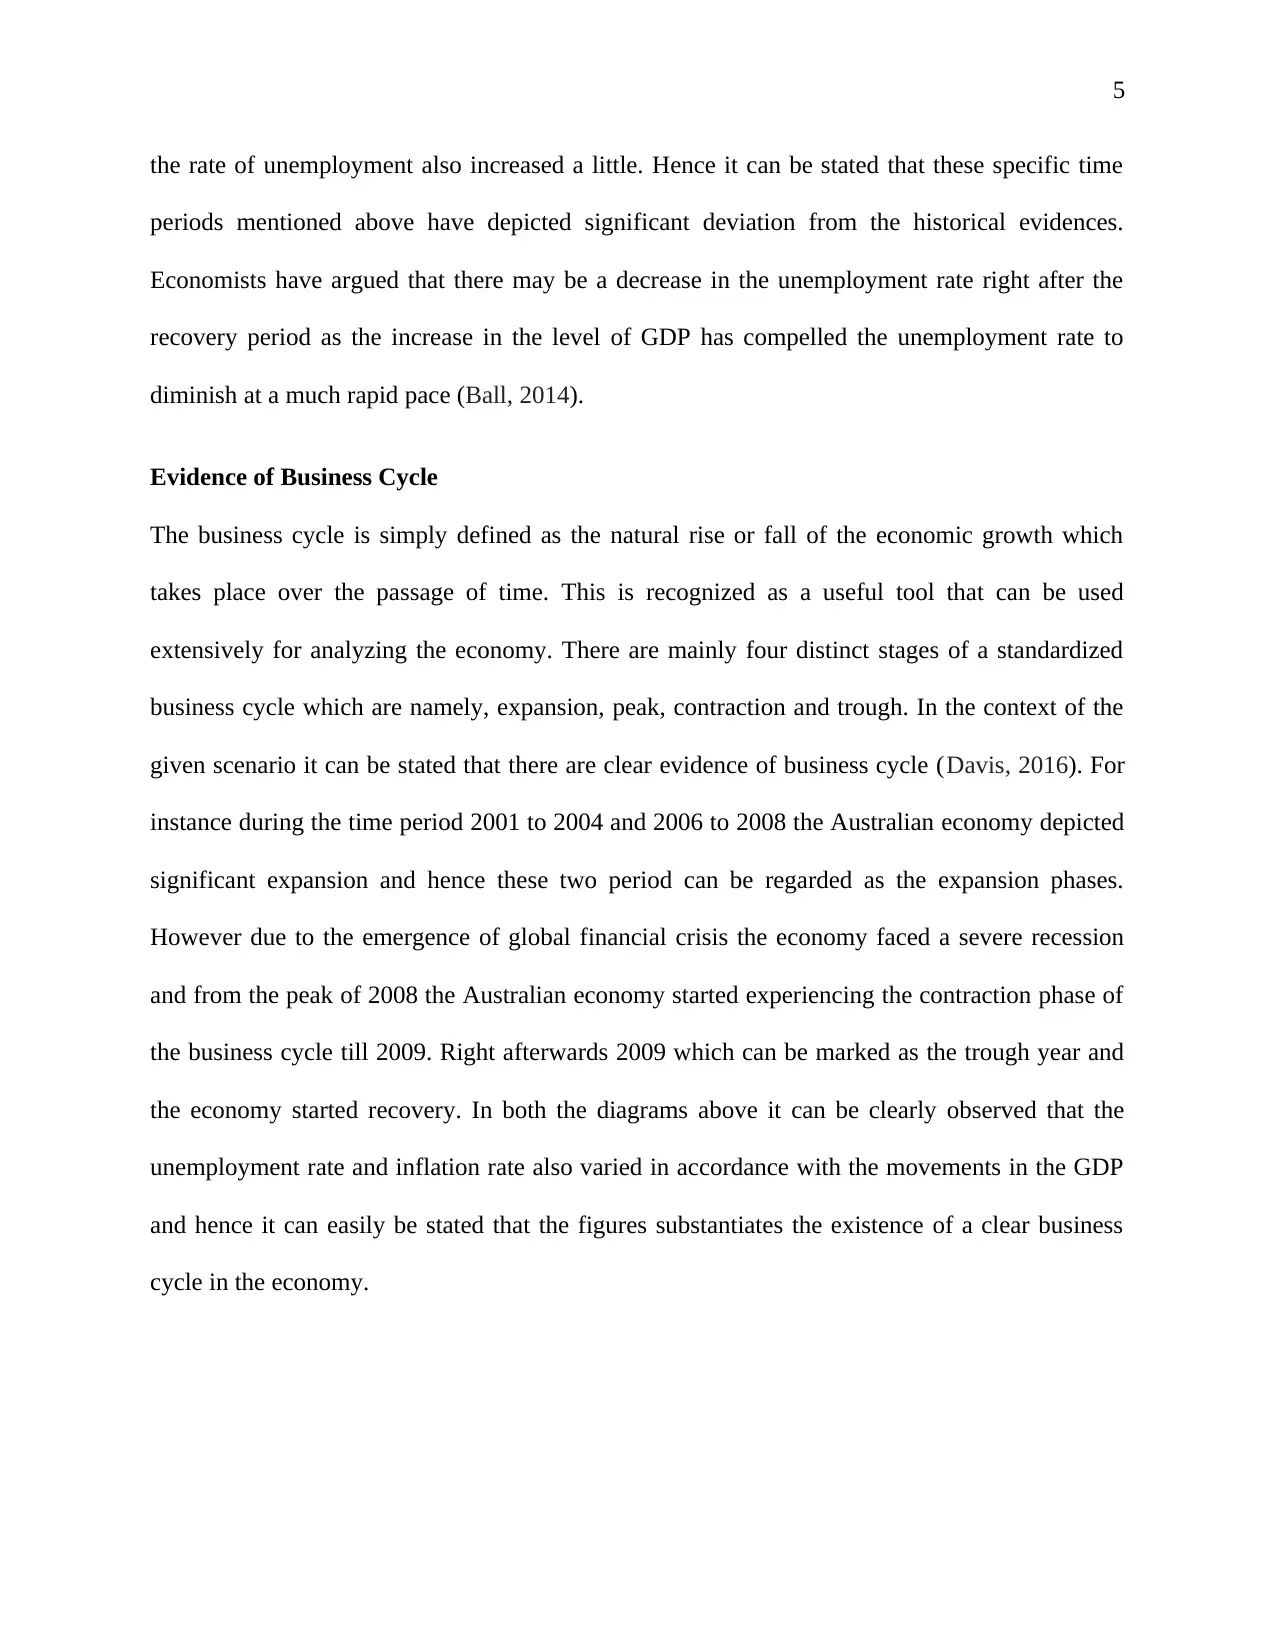
Figure 2: Real GDP Growth Rate and Unemployment (1990-2016)
(Source: Databank.worldbank.org. 2018)
There are different factors which affects the gross domestic product and unemployment rate. The
historical data substantiated the fact that a one percent decrease in the level of Gross Domestic
Product world lead to an increase in the unemployment rate by less than 2 percent point. This
relationship is popularly known as the Okun’s Law. The graph above have observed the
movement of these two variables for the time period from 1990 through 2016. It has been
observed that during the period of 1990 through 1991, GDP and unemployment rate both have
increased simultaneously (Hatfield-Dodds, 2015). However, after 1991 when GDP started to
decline the unemployment rate kept on increasing following the Okun’s Law. From 2002
through 2004 the gross domestic product kept on creasing at a steady rate while the
unemployment rate was diminishing. Right after the emergence of global financial crisis the
gross domestic product started to decline sharply and it has been observed that during that period
Relationship between Australia’s real GDP Growth Rate and Unemployment Rate
1990
1991
1992
1993
1994
1995
1996
1997
1998
1999
2000
2001
2002
2003
2004
2005
2006
2007
2008
2009
2010
2011
2012
2013
2014
2015
2016
-15
-10
-5
0
5
10
15
20
25
30
35
Real GDP Growth Rate and
Unemployment
GDP Growth Rate Unemployment Rate
Figure 2: Real GDP Growth Rate and Unemployment (1990-2016)
(Source: Databank.worldbank.org. 2018)
There are different factors which affects the gross domestic product and unemployment rate. The
historical data substantiated the fact that a one percent decrease in the level of Gross Domestic
Product world lead to an increase in the unemployment rate by less than 2 percent point. This
relationship is popularly known as the Okun’s Law. The graph above have observed the
movement of these two variables for the time period from 1990 through 2016. It has been
observed that during the period of 1990 through 1991, GDP and unemployment rate both have
increased simultaneously (Hatfield-Dodds, 2015). However, after 1991 when GDP started to
decline the unemployment rate kept on increasing following the Okun’s Law. From 2002
through 2004 the gross domestic product kept on creasing at a steady rate while the
unemployment rate was diminishing. Right after the emergence of global financial crisis the
gross domestic product started to decline sharply and it has been observed that during that period
5
the rate of unemployment also increased a little. Hence it can be stated that these specific time
periods mentioned above have depicted significant deviation from the historical evidences.
Economists have argued that there may be a decrease in the unemployment rate right after the
recovery period as the increase in the level of GDP has compelled the unemployment rate to
diminish at a much rapid pace (Ball, 2014).
Evidence of Business Cycle
The business cycle is simply defined as the natural rise or fall of the economic growth which
takes place over the passage of time. This is recognized as a useful tool that can be used
extensively for analyzing the economy. There are mainly four distinct stages of a standardized
business cycle which are namely, expansion, peak, contraction and trough. In the context of the
given scenario it can be stated that there are clear evidence of business cycle (Davis, 2016). For
instance during the time period 2001 to 2004 and 2006 to 2008 the Australian economy depicted
significant expansion and hence these two period can be regarded as the expansion phases.
However due to the emergence of global financial crisis the economy faced a severe recession
and from the peak of 2008 the Australian economy started experiencing the contraction phase of
the business cycle till 2009. Right afterwards 2009 which can be marked as the trough year and
the economy started recovery. In both the diagrams above it can be clearly observed that the
unemployment rate and inflation rate also varied in accordance with the movements in the GDP
and hence it can easily be stated that the figures substantiates the existence of a clear business
cycle in the economy.
⊘ This is a preview!⊘
Do you want full access?
Subscribe today to unlock all pages.
Trusted by 1+ million students worldwide
6
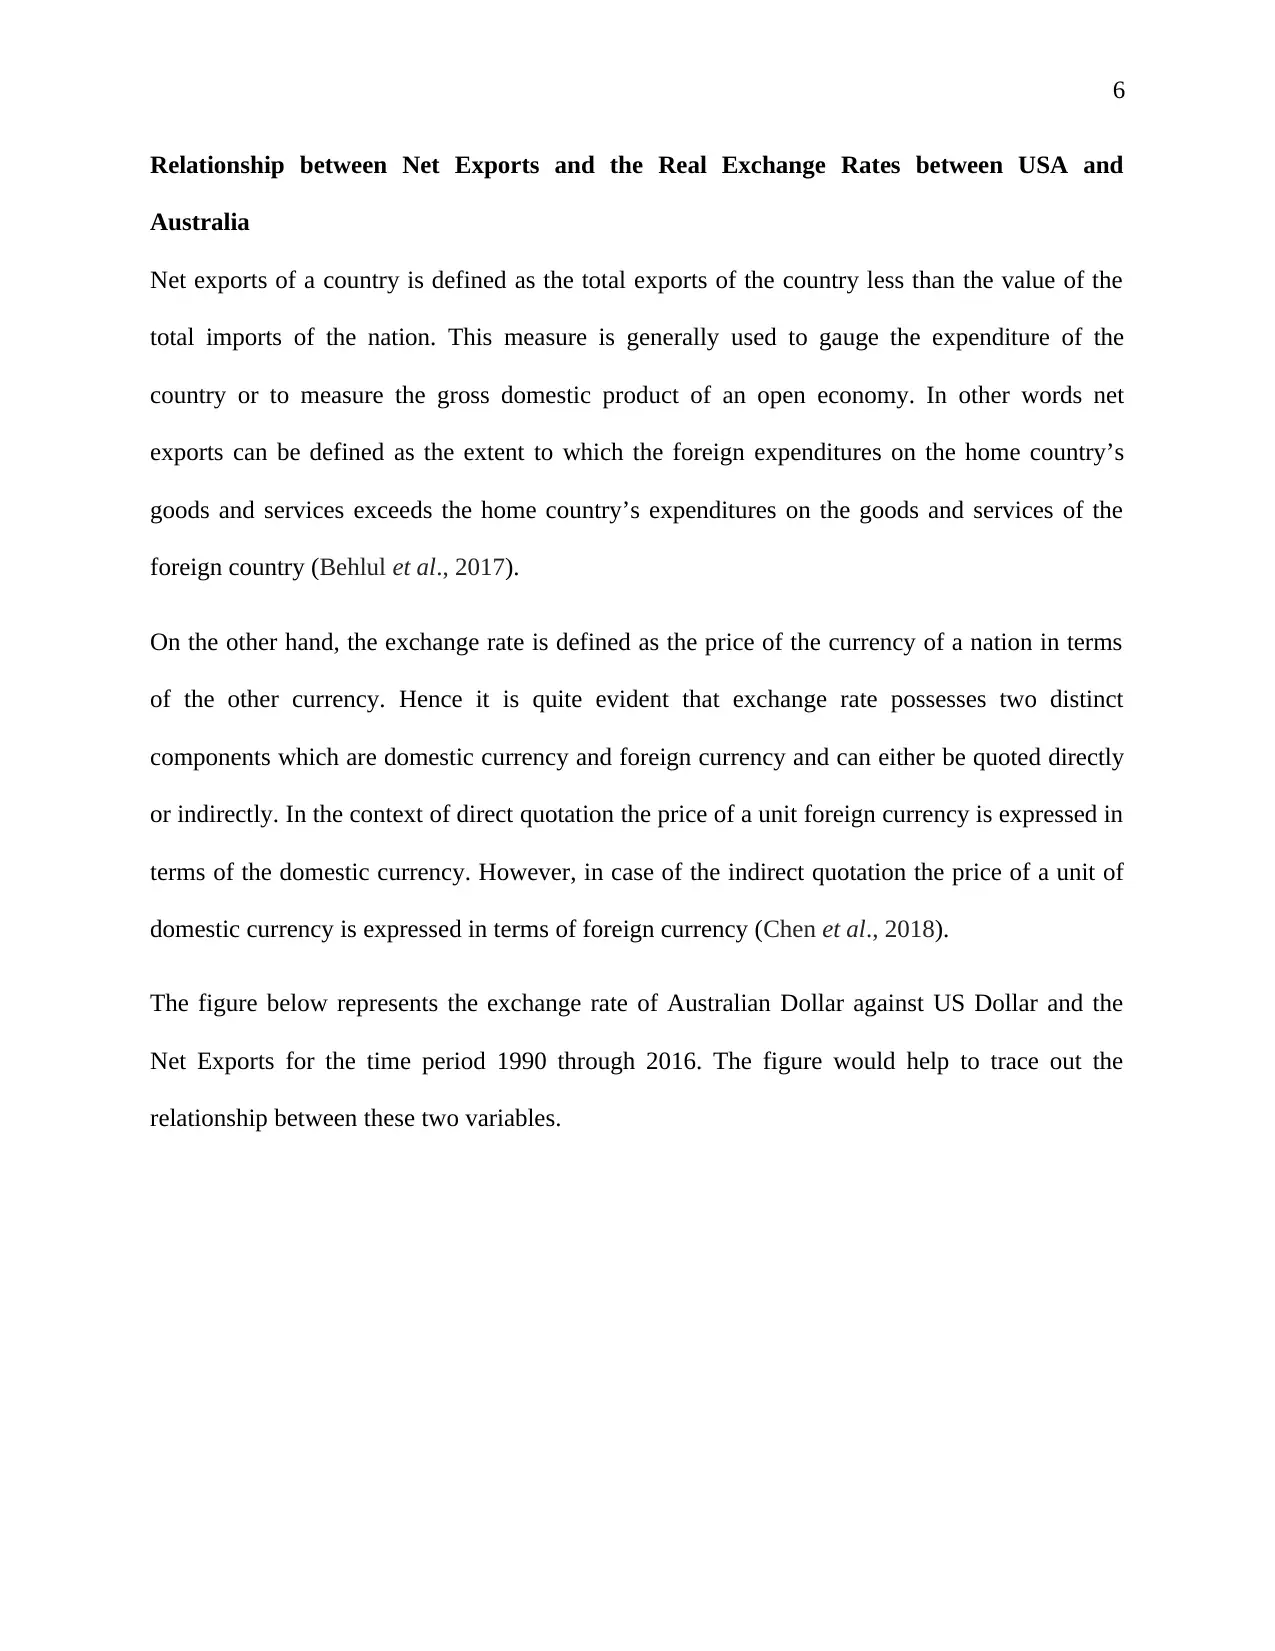
Relationship between Net Exports and the Real Exchange Rates between USA and
Australia
Net exports of a country is defined as the total exports of the country less than the value of the
total imports of the nation. This measure is generally used to gauge the expenditure of the
country or to measure the gross domestic product of an open economy. In other words net
exports can be defined as the extent to which the foreign expenditures on the home country’s
goods and services exceeds the home country’s expenditures on the goods and services of the
foreign country (Behlul et al., 2017).
On the other hand, the exchange rate is defined as the price of the currency of a nation in terms
of the other currency. Hence it is quite evident that exchange rate possesses two distinct
components which are domestic currency and foreign currency and can either be quoted directly
or indirectly. In the context of direct quotation the price of a unit foreign currency is expressed in
terms of the domestic currency. However, in case of the indirect quotation the price of a unit of
domestic currency is expressed in terms of foreign currency (Chen et al., 2018).
The figure below represents the exchange rate of Australian Dollar against US Dollar and the
Net Exports for the time period 1990 through 2016. The figure would help to trace out the
relationship between these two variables.
Paraphrase This Document
Need a fresh take? Get an instant paraphrase of this document with our AI Paraphraser
7
1990
1992
1994
1996
1998
2000
2002
2004
2006
2008
2010
2012
2014
2016
-30.00
-25.00
-20.00
-15.00
-10.00
-5.00
0.00
5.00
10.00
15.00
20.00
Exchange Rate and Net Exports
Exchange Rate Net Exports
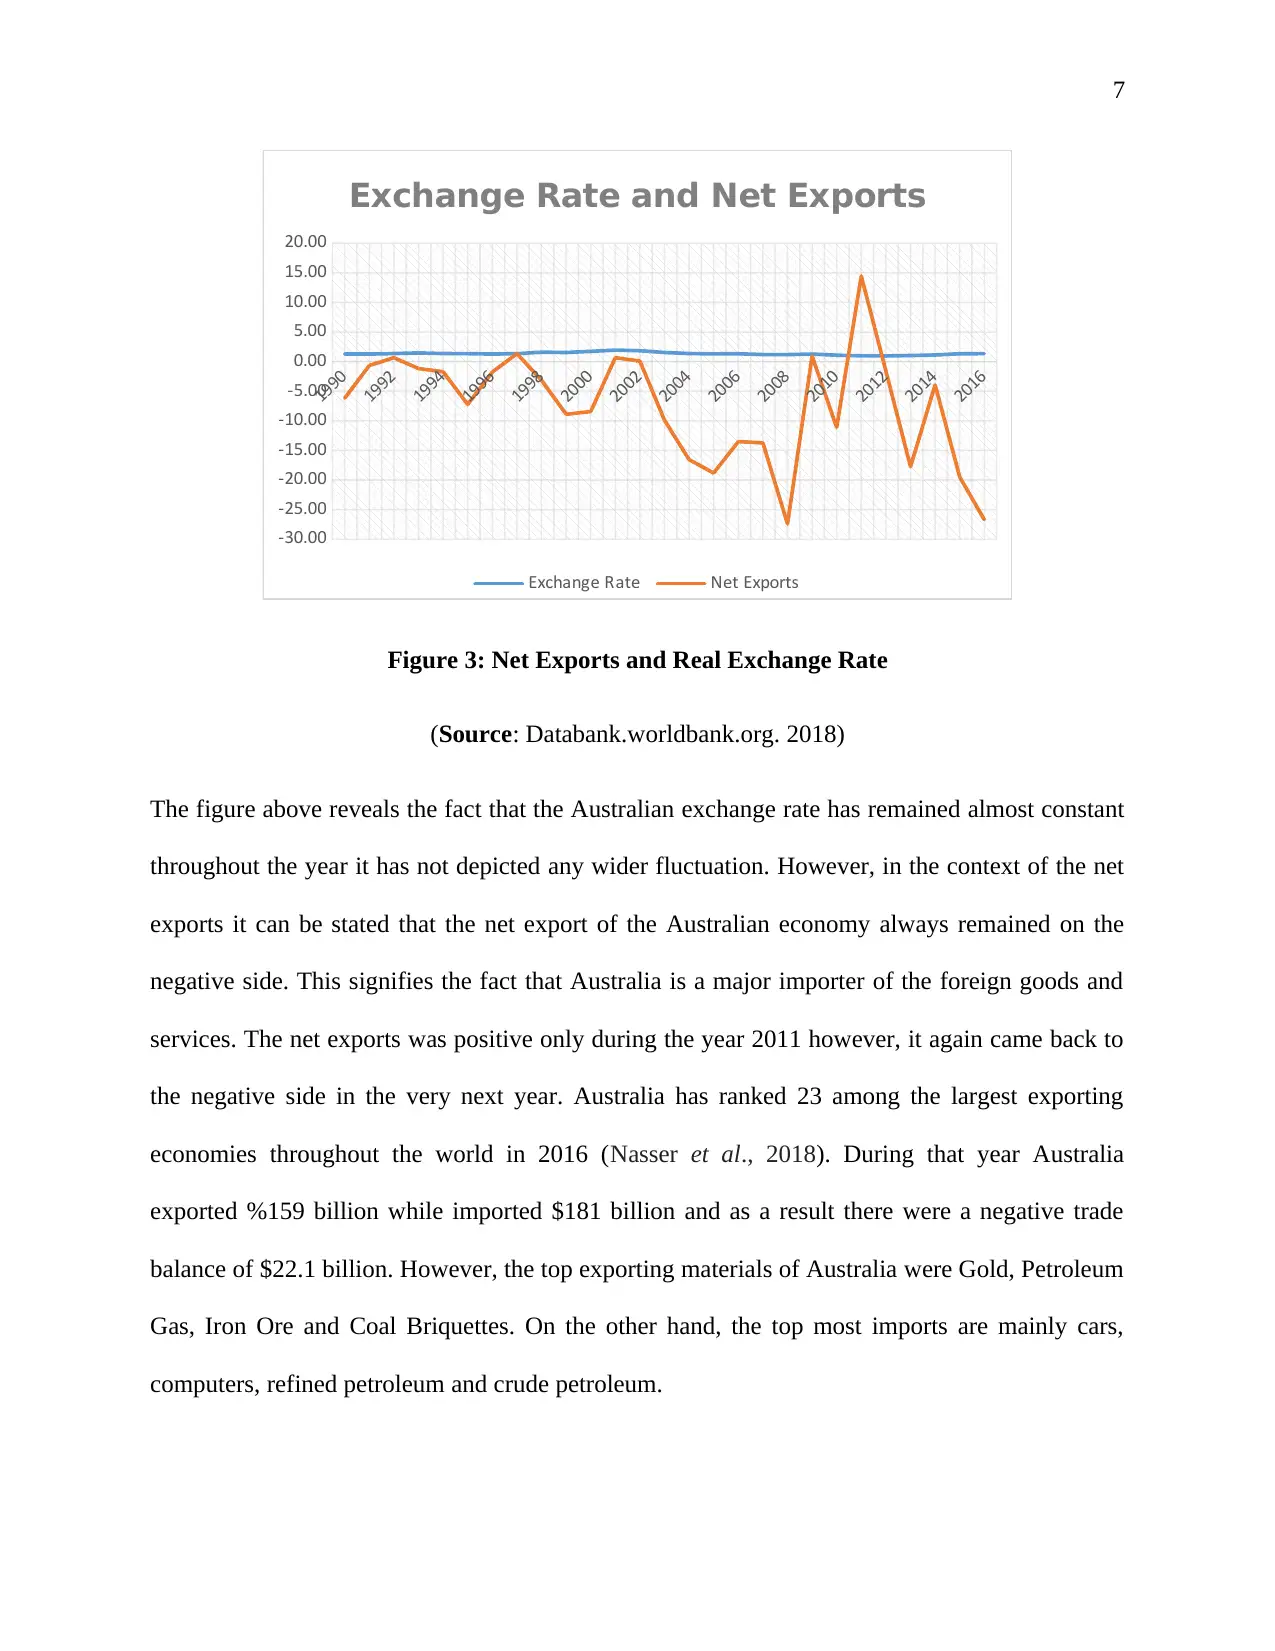
Figure 3: Net Exports and Real Exchange Rate
(Source: Databank.worldbank.org. 2018)
The figure above reveals the fact that the Australian exchange rate has remained almost constant
throughout the year it has not depicted any wider fluctuation. However, in the context of the net
exports it can be stated that the net export of the Australian economy always remained on the
negative side. This signifies the fact that Australia is a major importer of the foreign goods and
services. The net exports was positive only during the year 2011 however, it again came back to
the negative side in the very next year. Australia has ranked 23 among the largest exporting
economies throughout the world in 2016 (Nasser et al., 2018). During that year Australia
exported %159 billion while imported $181 billion and as a result there were a negative trade
balance of $22.1 billion. However, the top exporting materials of Australia were Gold, Petroleum
Gas, Iron Ore and Coal Briquettes. On the other hand, the top most imports are mainly cars,
computers, refined petroleum and crude petroleum.
1990
1992
1994
1996
1998
2000
2002
2004
2006
2008
2010
2012
2014
2016
-30.00
-25.00
-20.00
-15.00
-10.00
-5.00
0.00
5.00
10.00
15.00
20.00
Exchange Rate and Net Exports
Exchange Rate Net Exports
Figure 3: Net Exports and Real Exchange Rate
(Source: Databank.worldbank.org. 2018)
The figure above reveals the fact that the Australian exchange rate has remained almost constant
throughout the year it has not depicted any wider fluctuation. However, in the context of the net
exports it can be stated that the net export of the Australian economy always remained on the
negative side. This signifies the fact that Australia is a major importer of the foreign goods and
services. The net exports was positive only during the year 2011 however, it again came back to
the negative side in the very next year. Australia has ranked 23 among the largest exporting
economies throughout the world in 2016 (Nasser et al., 2018). During that year Australia
exported %159 billion while imported $181 billion and as a result there were a negative trade
balance of $22.1 billion. However, the top exporting materials of Australia were Gold, Petroleum
Gas, Iron Ore and Coal Briquettes. On the other hand, the top most imports are mainly cars,
computers, refined petroleum and crude petroleum.
8
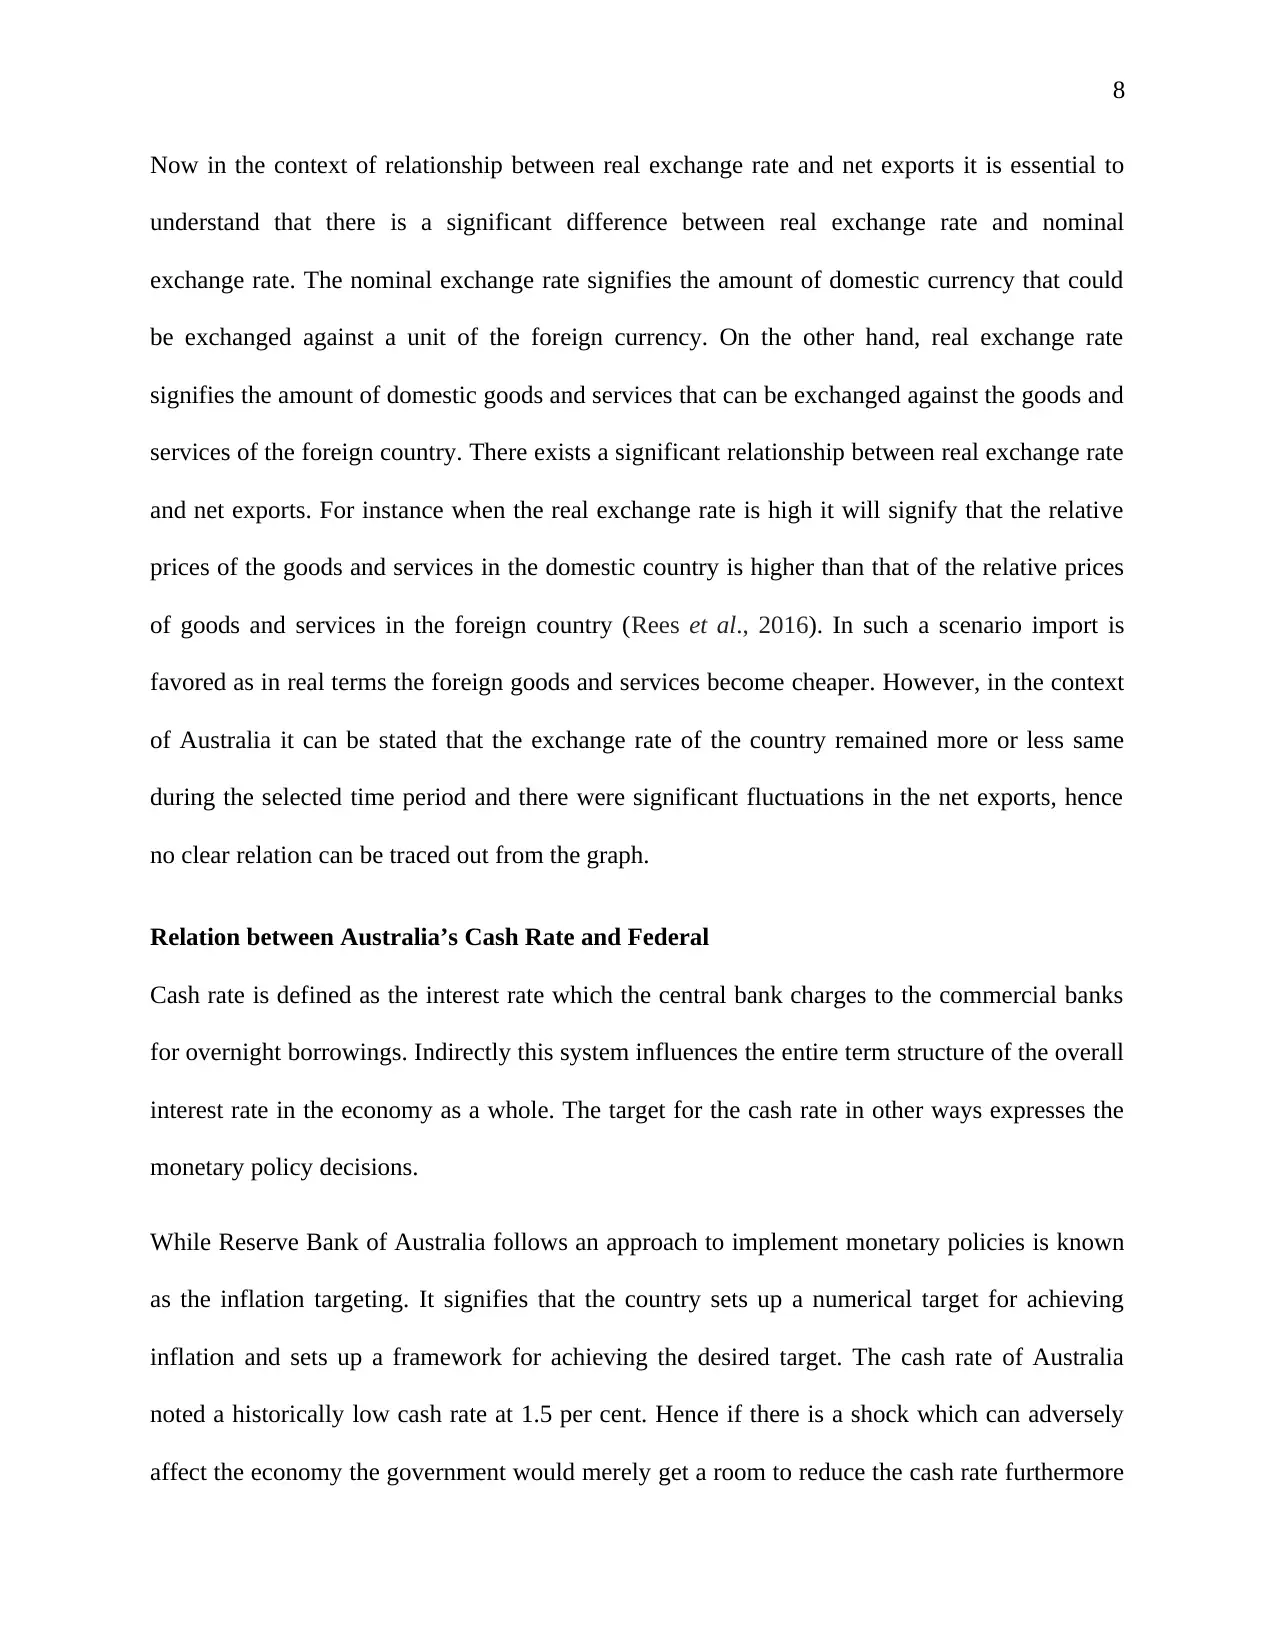
Now in the context of relationship between real exchange rate and net exports it is essential to
understand that there is a significant difference between real exchange rate and nominal
exchange rate. The nominal exchange rate signifies the amount of domestic currency that could
be exchanged against a unit of the foreign currency. On the other hand, real exchange rate
signifies the amount of domestic goods and services that can be exchanged against the goods and
services of the foreign country. There exists a significant relationship between real exchange rate
and net exports. For instance when the real exchange rate is high it will signify that the relative
prices of the goods and services in the domestic country is higher than that of the relative prices
of goods and services in the foreign country (Rees et al., 2016). In such a scenario import is
favored as in real terms the foreign goods and services become cheaper. However, in the context
of Australia it can be stated that the exchange rate of the country remained more or less same
during the selected time period and there were significant fluctuations in the net exports, hence
no clear relation can be traced out from the graph.
Relation between Australia’s Cash Rate and Federal
Cash rate is defined as the interest rate which the central bank charges to the commercial banks
for overnight borrowings. Indirectly this system influences the entire term structure of the overall
interest rate in the economy as a whole. The target for the cash rate in other ways expresses the
monetary policy decisions.
While Reserve Bank of Australia follows an approach to implement monetary policies is known
as the inflation targeting. It signifies that the country sets up a numerical target for achieving
inflation and sets up a framework for achieving the desired target. The cash rate of Australia
noted a historically low cash rate at 1.5 per cent. Hence if there is a shock which can adversely
affect the economy the government would merely get a room to reduce the cash rate furthermore
⊘ This is a preview!⊘
Do you want full access?
Subscribe today to unlock all pages.
Trusted by 1+ million students worldwide
9
(Pagan and Wilcox, 2015). It is assumed that when the inflation rate is below the target level a
reduction the cash rate also reduces the long term interest rates which in turn encourages the
people to purchase more goods and services and invest significantly. Increasing the demand
raises the price level which as a result brings the level of inflation back to its target level.
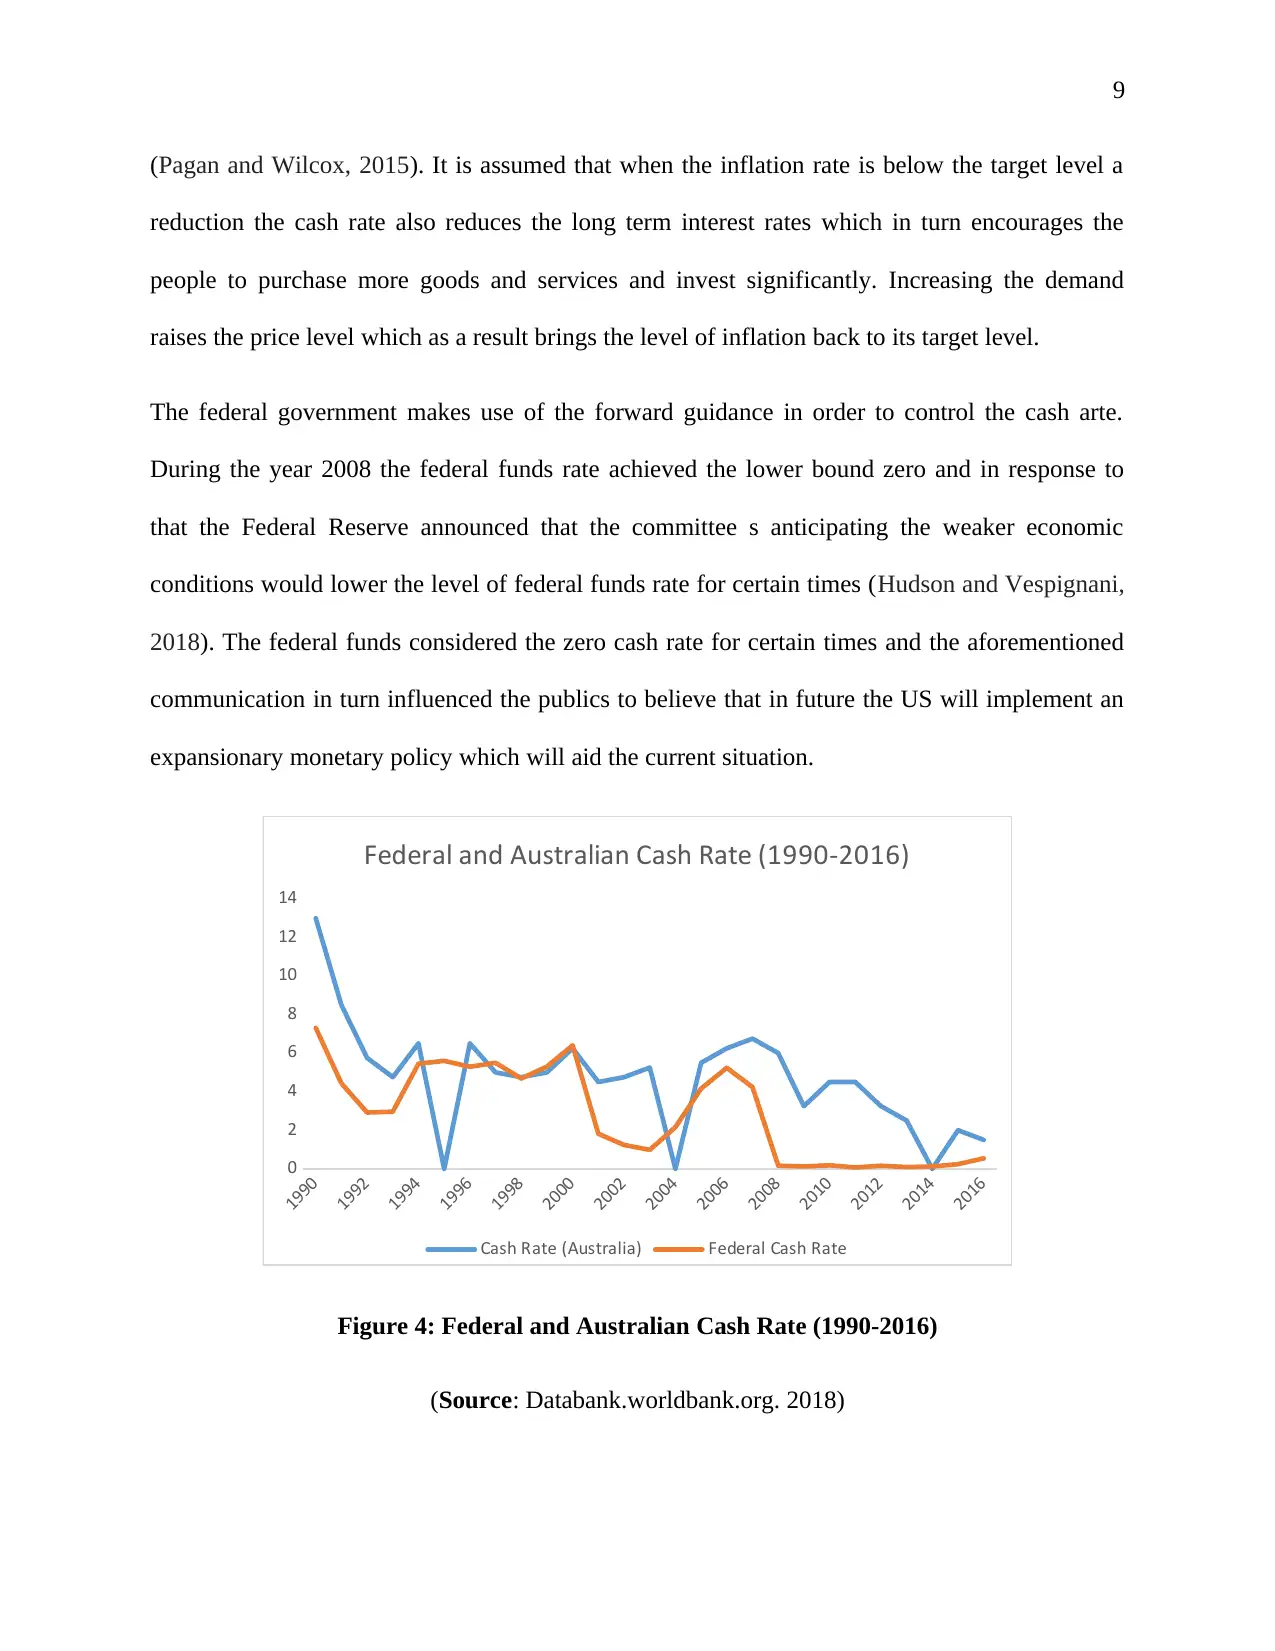
The federal government makes use of the forward guidance in order to control the cash arte.
During the year 2008 the federal funds rate achieved the lower bound zero and in response to
that the Federal Reserve announced that the committee s anticipating the weaker economic
conditions would lower the level of federal funds rate for certain times (Hudson and Vespignani,
2018). The federal funds considered the zero cash rate for certain times and the aforementioned
communication in turn influenced the publics to believe that in future the US will implement an
expansionary monetary policy which will aid the current situation.
1990
1992
1994
1996
1998
2000
2002
2004
2006
2008
2010
2012
2014
2016
0
2
4
6
8
10
12
14
Federal and Australian Cash Rate (1990-2016)
Cash Rate (Australia) Federal Cash Rate
Figure 4: Federal and Australian Cash Rate (1990-2016)
(Source: Databank.worldbank.org. 2018)
(Pagan and Wilcox, 2015). It is assumed that when the inflation rate is below the target level a
reduction the cash rate also reduces the long term interest rates which in turn encourages the
people to purchase more goods and services and invest significantly. Increasing the demand
raises the price level which as a result brings the level of inflation back to its target level.
The federal government makes use of the forward guidance in order to control the cash arte.
During the year 2008 the federal funds rate achieved the lower bound zero and in response to
that the Federal Reserve announced that the committee s anticipating the weaker economic
conditions would lower the level of federal funds rate for certain times (Hudson and Vespignani,
2018). The federal funds considered the zero cash rate for certain times and the aforementioned
communication in turn influenced the publics to believe that in future the US will implement an
expansionary monetary policy which will aid the current situation.
1990
1992
1994
1996
1998
2000
2002
2004
2006
2008
2010
2012
2014
2016
0
2
4
6
8
10
12
14
Federal and Australian Cash Rate (1990-2016)
Cash Rate (Australia) Federal Cash Rate
Figure 4: Federal and Australian Cash Rate (1990-2016)
(Source: Databank.worldbank.org. 2018)
Paraphrase This Document
Need a fresh take? Get an instant paraphrase of this document with our AI Paraphraser
10
It can be stated from the figure above that the Australian Cash rate have declined significantly
during the time period 1990 to 1996. However, it projected a rise during the time period of 1993
to 1994 and soon after that it again fell down as per the monetary policy of the Reserve Bank of
Australia. Later on it maintained a steady pace and year on year basis remained almost the same
and again declined in the year 2004. Now in the context of the federal cash rate it has been
observed that it has not fluctuated rigorously during the selected time period however it can be
stated that soon after the great recession the federal cash rate maintained a substantially but
continuous low rate and is still maintaining that rate as well. In the context of relationship
between these two components it can be stated that the federal cash rate is less likely to influence
the Australian cash rate as these are two different components of the monetary policies of these
two countries. However, if there exists any link between these two countries in terms of
monetary variables the federal cash rate may influence the cash rate in Australia.
Macroeconomic Outlook of Australia
Based on the statistics and empirical evidences prevalent and analyzed in the study it can be
stated that the Australian economy will continue to grow furthermore at a steady pace. The
investments in the business sectors apart from housing and mining sectors will increase as the
GDP growth of the economy has been depicting a significantly increasing trend. The exports will
also increase due to the enhancements in the resource sector capacities. On the other hand,
further strengthening of the labor market as well as the household incomes in turn sustains the
private consumptions, inflation and the wages would rise significantly (Garnaut et al., 2017).
The central bank of Australia has also projected that the policy rate would increase in the second
half of the year 2018, coupled with the expectations of this move coupled with the macro-
prudential measures the housing market would be cooled down. The fiscal condition of the
11
economy is in a robust shape as it has been depicted by the movements of the net exports curve
and it is expected that the government of Australia would certainly mitigate the budget deficits.
The emergence of an unexpected economic downturn it can be expected that the government of
Australia would implement fiscal policy in order to support the activities and protect the income
of the most vulnerable portion of the population.
Furthermore the GDP growth rate, inflation and the rate of unemployment signifies the fact that
the Australia is facing a potentially good economic environment. It has sustained a substantial
GDP growth rate and even after the emergence of the global financial crisis the economy
recovered quite quickly. Furthermore, the unemployment rate in the economy is low which
means that the major portion of the population is able to obtain a job at the prevailing wage rate
in the market. Furthermore, in the context of inflation it has also been observed that the economy
has been able to maintain a substantial level of inflation which in turn is beneficial for the
economy (Pagan and Wilcox, 2015). Therefore it can be stated that in near future the economy
may expect an inflation as the gross domestic product of the country has been declining and is
expected to have achieved the trough position of the business cycle and the recovery stage has
also been emerged. Since coupled with the extensive increase in the level of GDP it can be
expected that the level of inflation would rise as the Reserve Bank of Australia has also decided
to increase the cash rate in near future.
Conclusion
On a concluding note, it can be stated that the assignment has successfully evaluated the
Australian economy in the light of the data obtained from the World Bank. Throughout the
assignment it has been observed that the gross domestic product, rate of inflation and the
unemployment are the three main components of determining economic performance of a nation
⊘ This is a preview!⊘
Do you want full access?
Subscribe today to unlock all pages.
Trusted by 1+ million students worldwide
1 out of 15
Related Documents


Your All-in-One AI-Powered Toolkit for Academic Success.
+13062052269
info@desklib.com
Available 24*7 on WhatsApp / Email
![[object Object]](/_next/static/media/star-bottom.7253800d.svg)
Unlock your academic potential
Copyright © 2020–2026 A2Z Services. All Rights Reserved. Developed and managed by ZUCOL.