Business Decision Making: Analysis of Balti Palace Restaurant Data
VerifiedAdded on 2019/12/28
|17
|4281
|192
Report
AI Summary
This report examines the business decision-making process for Balti Palace, focusing on the potential expansion of the restaurant into the London market. The report begins with an introduction to business decision-making and the importance of market research. Task 1 outlines the creation of a business plan, survey methodology, and questionnaire design for collecting data from potential customers. Task 2 involves data summarization, statistical analysis, and drawing valid conclusions from the collected information using measures of dispersion, quartiles, percentiles, and correlation coefficients. Task 3 focuses on data visualization using graphs and trend lines, followed by the creation of a formal business report. Finally, Task 4 covers the use of information processing tools in project planning, including project plan preparation and critical path analysis for effective time management and project calculations. The report provides a comprehensive analysis of the market, data, and recommendations to make a sound business decision.

BUSINESS DECISION
MAKING
MAKING
Paraphrase This Document
Need a fresh take? Get an instant paraphrase of this document with our AI Paraphraser
Table of Contents
INTRODUCTION ..........................................................................................................................3
TASK 1............................................................................................................................................3
1.1 Create a plan ....................................................................................................................3
1.2 Survey methodology and sampling frame........................................................................4
1.3 Design a questionnaire For collecting data......................................................................5
TASK 2............................................................................................................................................7
2.1. Decision making after summarisation of data.................................................................7
2.2 results to draw valid conclusions.....................................................................................7
2.3 data using measures of dispersion...................................................................................8
2.4 quartiles, percentiles and the correlation coefficient........................................................9
TASK 3............................................................................................................................................9
3.1 Graphs...............................................................................................................................9
3.2 Trend lines.....................................................................................................................11
3.3 presentation using suitable software and techniques.....................................................12
3.4 formal business report...................................................................................................12
TASK 4..........................................................................................................................................13
4.1 Using information processing tools in planning of project............................................13
4.2 Preparation of project plan and critical path for effective time management................14
4.3 Calculation for the project..............................................................................................15
CONCLUSION..............................................................................................................................15
REFERENCES..............................................................................................................................17
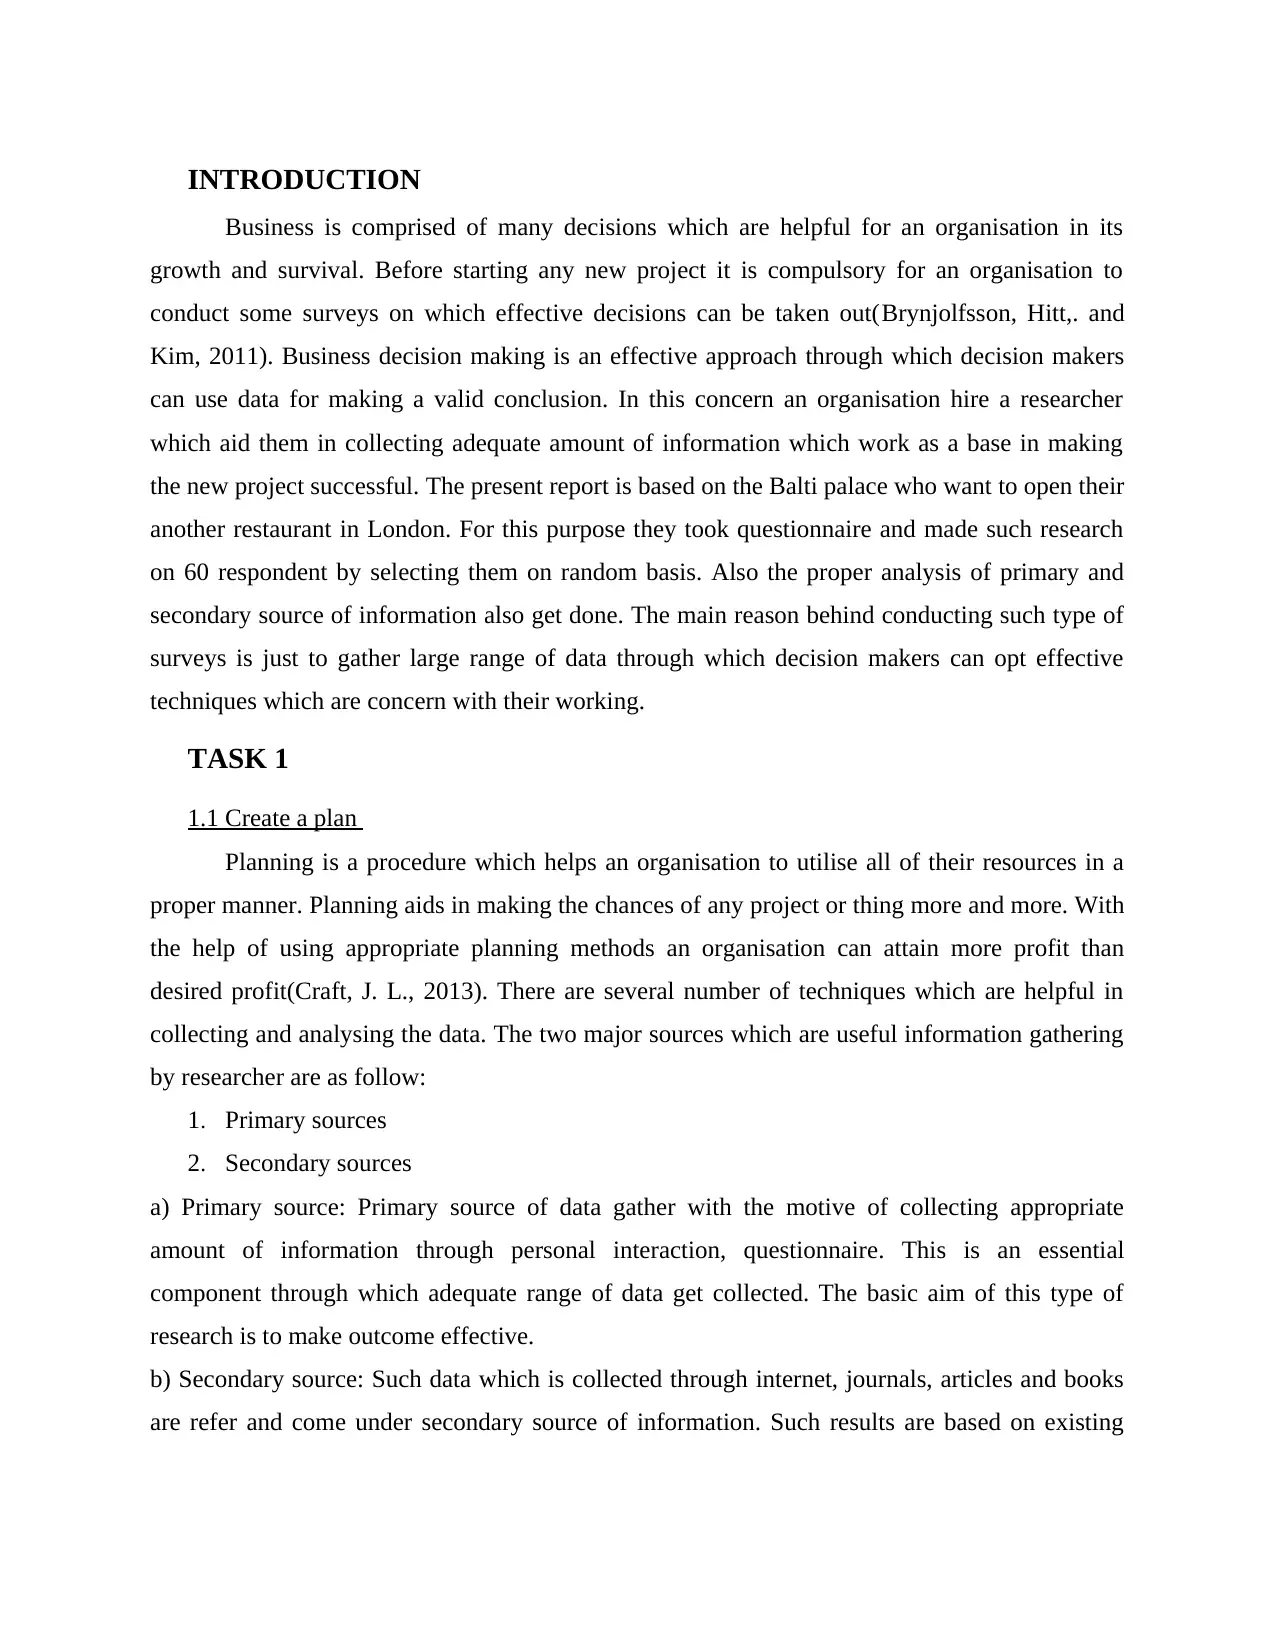
INTRODUCTION
Business is comprised of many decisions which are helpful for an organisation in its
growth and survival. Before starting any new project it is compulsory for an organisation to
conduct some surveys on which effective decisions can be taken out(Brynjolfsson, Hitt,. and
Kim, 2011). Business decision making is an effective approach through which decision makers
can use data for making a valid conclusion. In this concern an organisation hire a researcher
which aid them in collecting adequate amount of information which work as a base in making
the new project successful. The present report is based on the Balti palace who want to open their
another restaurant in London. For this purpose they took questionnaire and made such research
on 60 respondent by selecting them on random basis. Also the proper analysis of primary and
secondary source of information also get done. The main reason behind conducting such type of
surveys is just to gather large range of data through which decision makers can opt effective
techniques which are concern with their working.
TASK 1
1.1 Create a plan
Planning is a procedure which helps an organisation to utilise all of their resources in a
proper manner. Planning aids in making the chances of any project or thing more and more. With
the help of using appropriate planning methods an organisation can attain more profit than
desired profit(Craft, J. L., 2013). There are several number of techniques which are helpful in
collecting and analysing the data. The two major sources which are useful information gathering
by researcher are as follow:
1. Primary sources
2. Secondary sources
a) Primary source: Primary source of data gather with the motive of collecting appropriate
amount of information through personal interaction, questionnaire. This is an essential
component through which adequate range of data get collected. The basic aim of this type of
research is to make outcome effective.
b) Secondary source: Such data which is collected through internet, journals, articles and books
are refer and come under secondary source of information. Such results are based on existing
⊘ This is a preview!⊘
Do you want full access?
Subscribe today to unlock all pages.
Trusted by 1+ million students worldwide
information which are helpful in making a valid conclusion. Hence such data is beneficial for
them in effective working.
There are various Methods which can be used for this. Such as survey will be conducted
in which various tools can be used. Interviews will be conducted or questionnaires will be made
which will be provided and then feedbacks will be gained. They will be used to carry out further
processes by which improvement will be made possible. This will be performed on a group of
people which will be selected by using sampling. For this various forms are there that can be
undertaken and that group will be representing whole population.
1.2 Survey methodology and sampling frame
Company use sampling process to get information from market and make decision on that data.
Company always us many kind of methodology to collect the sample from market. Sampling
provide the fully information related to sampling(Fernando, and Chowdhury, 201o).
survey via sampling process:
Elaborate about the population.
Make a sampling frame for collective information.
Company should identify about then sample size.
Company should also specify about the sampling method and strategy.
There are various tools and techniques which can be used by any business so that all the
required information can be collected in appropriate manner. One of them is research
methodology by the help of which best decisions are made that are in overall interest of
company. There are various manner in which research can be conducted and they are as follows:
Descriptive: when customers visit the restaurant at that time certain data is collected which will
be covered in this. By this skill and knowledge will be evaluated.
Qualitative: by this the intensity will be determined that will be present because of various
problems which will be identified while carrying out research.
Sampling: This is used in the process of survey as it will not be possible to conduct it with all so
a group will be selected which will be known as sample. Many ways are there by which they can
be chosen and it will be involving following:
Simple random sampling: In this no specified technique is there. Sample will be selected
randomly from whole population. In this equal opportunities will be there for each.
Paraphrase This Document
Need a fresh take? Get an instant paraphrase of this document with our AI Paraphraser
Quota sampling: in this there will be a group which will be selected and data will be
collected from them. In this equal possibility will not be provided.
Cluster sampling: Under this whole population will be divided among various groups and
then research will be performed on them.
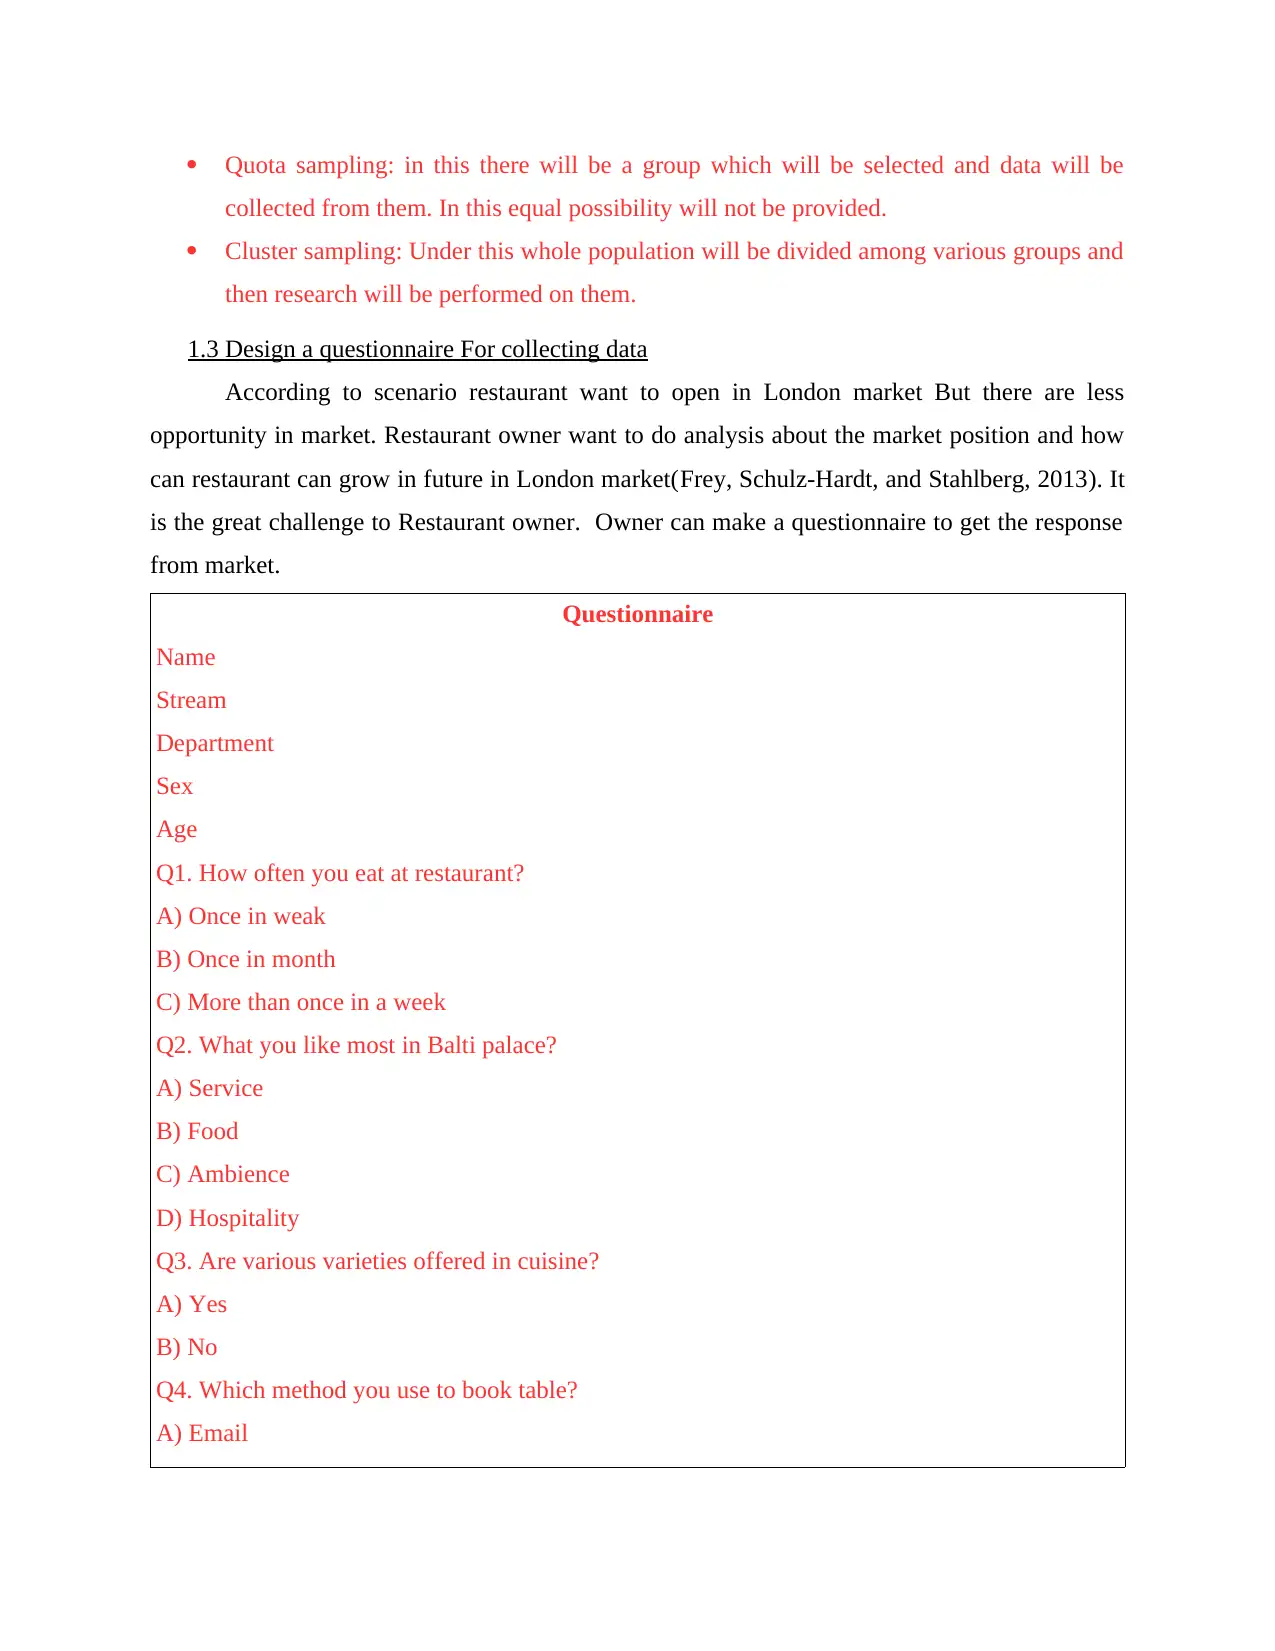
1.3 Design a questionnaire For collecting data
According to scenario restaurant want to open in London market But there are less
opportunity in market. Restaurant owner want to do analysis about the market position and how
can restaurant can grow in future in London market(Frey, Schulz-Hardt, and Stahlberg, 2013). It
is the great challenge to Restaurant owner. Owner can make a questionnaire to get the response
from market.
Questionnaire
Name
Stream
Department
Sex
Age
Q1. How often you eat at restaurant?
A) Once in weak
B) Once in month
C) More than once in a week
Q2. What you like most in Balti palace?
A) Service
B) Food
C) Ambience
D) Hospitality
Q3. Are various varieties offered in cuisine?
A) Yes
B) No
Q4. Which method you use to book table?
A) Email
collected from them. In this equal possibility will not be provided.
Cluster sampling: Under this whole population will be divided among various groups and
then research will be performed on them.
1.3 Design a questionnaire For collecting data
According to scenario restaurant want to open in London market But there are less
opportunity in market. Restaurant owner want to do analysis about the market position and how
can restaurant can grow in future in London market(Frey, Schulz-Hardt, and Stahlberg, 2013). It
is the great challenge to Restaurant owner. Owner can make a questionnaire to get the response
from market.
Questionnaire
Name
Stream
Department
Sex
Age
Q1. How often you eat at restaurant?
A) Once in weak
B) Once in month
C) More than once in a week
Q2. What you like most in Balti palace?
A) Service
B) Food
C) Ambience
D) Hospitality
Q3. Are various varieties offered in cuisine?
A) Yes
B) No
Q4. Which method you use to book table?
A) Email
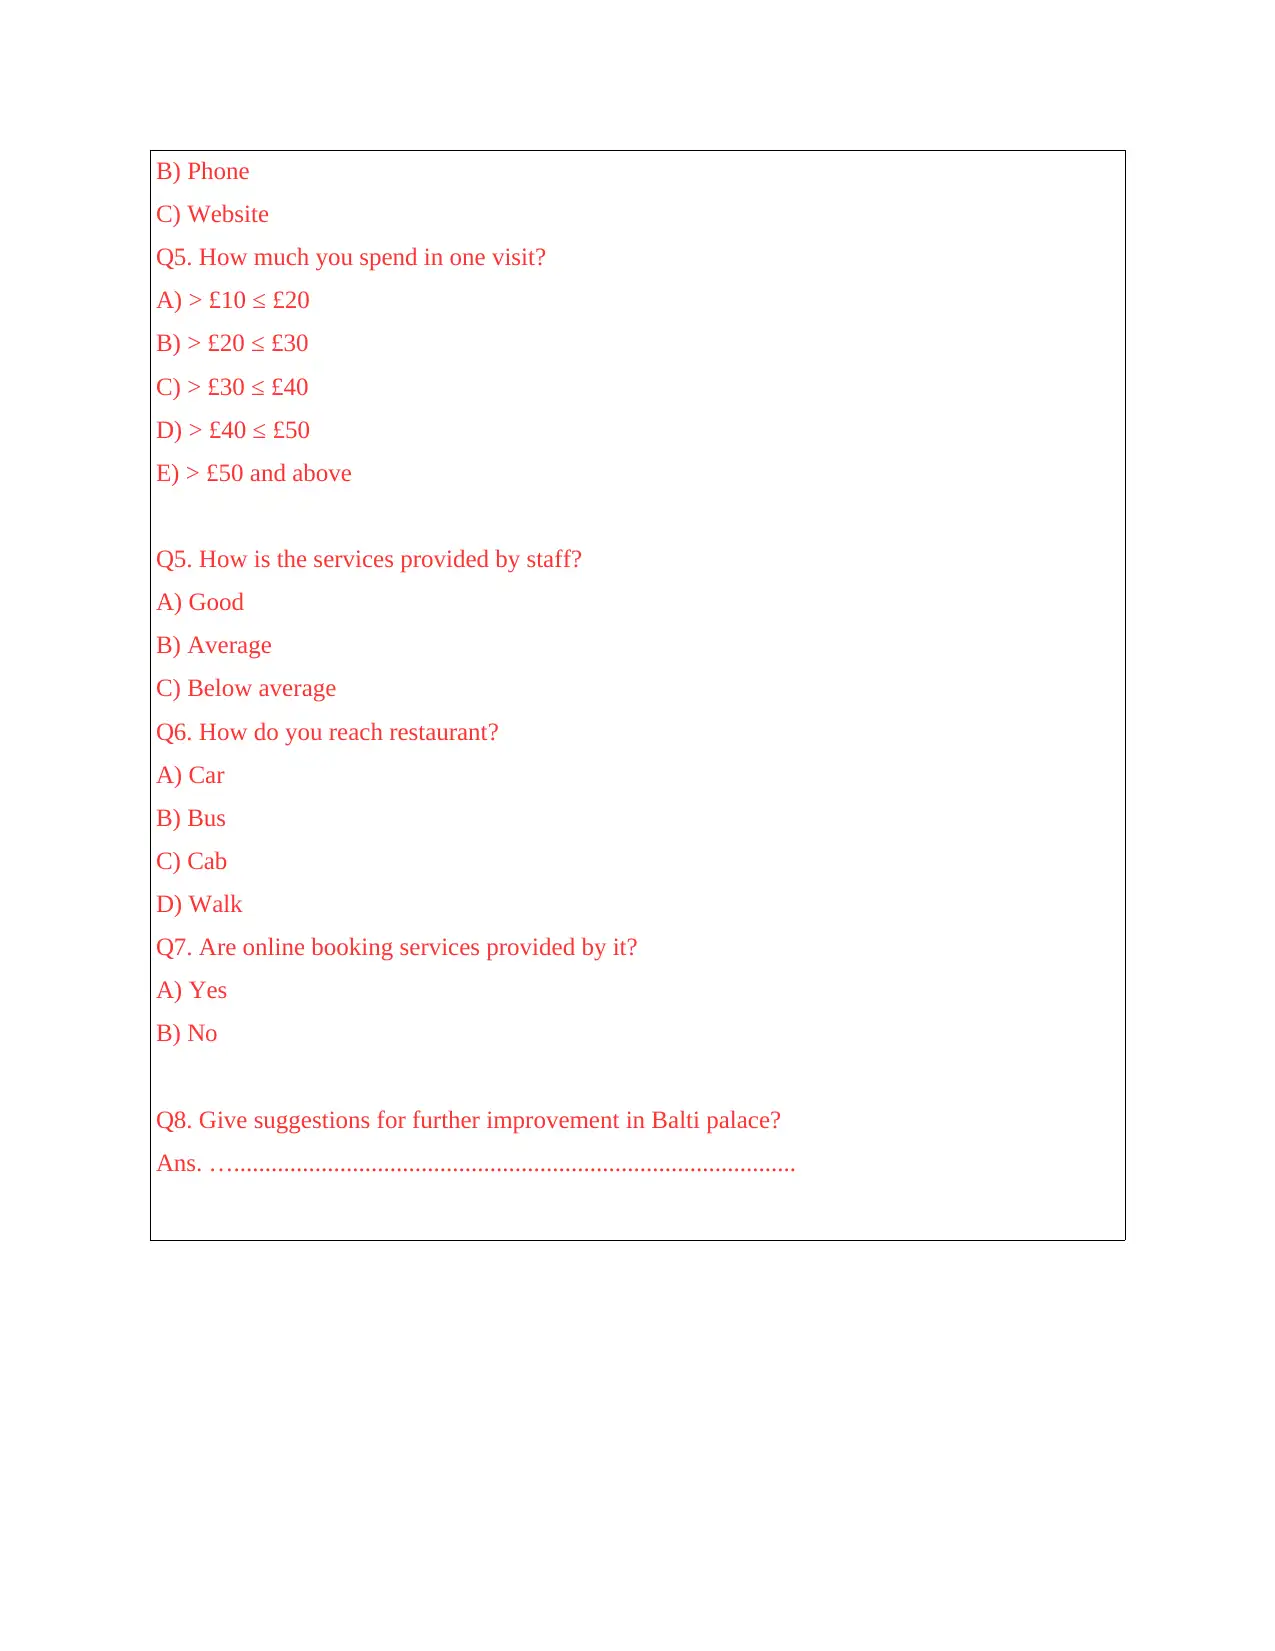
B) Phone
C) Website
Q5. How much you spend in one visit?
A) > £10 ≤ £20
B) > £20 ≤ £30
C) > £30 ≤ £40
D) > £40 ≤ £50
E) > £50 and above
Q5. How is the services provided by staff?
A) Good
B) Average
C) Below average
Q6. How do you reach restaurant?
A) Car
B) Bus
C) Cab
D) Walk
Q7. Are online booking services provided by it?
A) Yes
B) No
Q8. Give suggestions for further improvement in Balti palace?
Ans. …..........................................................................................
⊘ This is a preview!⊘
Do you want full access?
Subscribe today to unlock all pages.
Trusted by 1+ million students worldwide
TASK 2
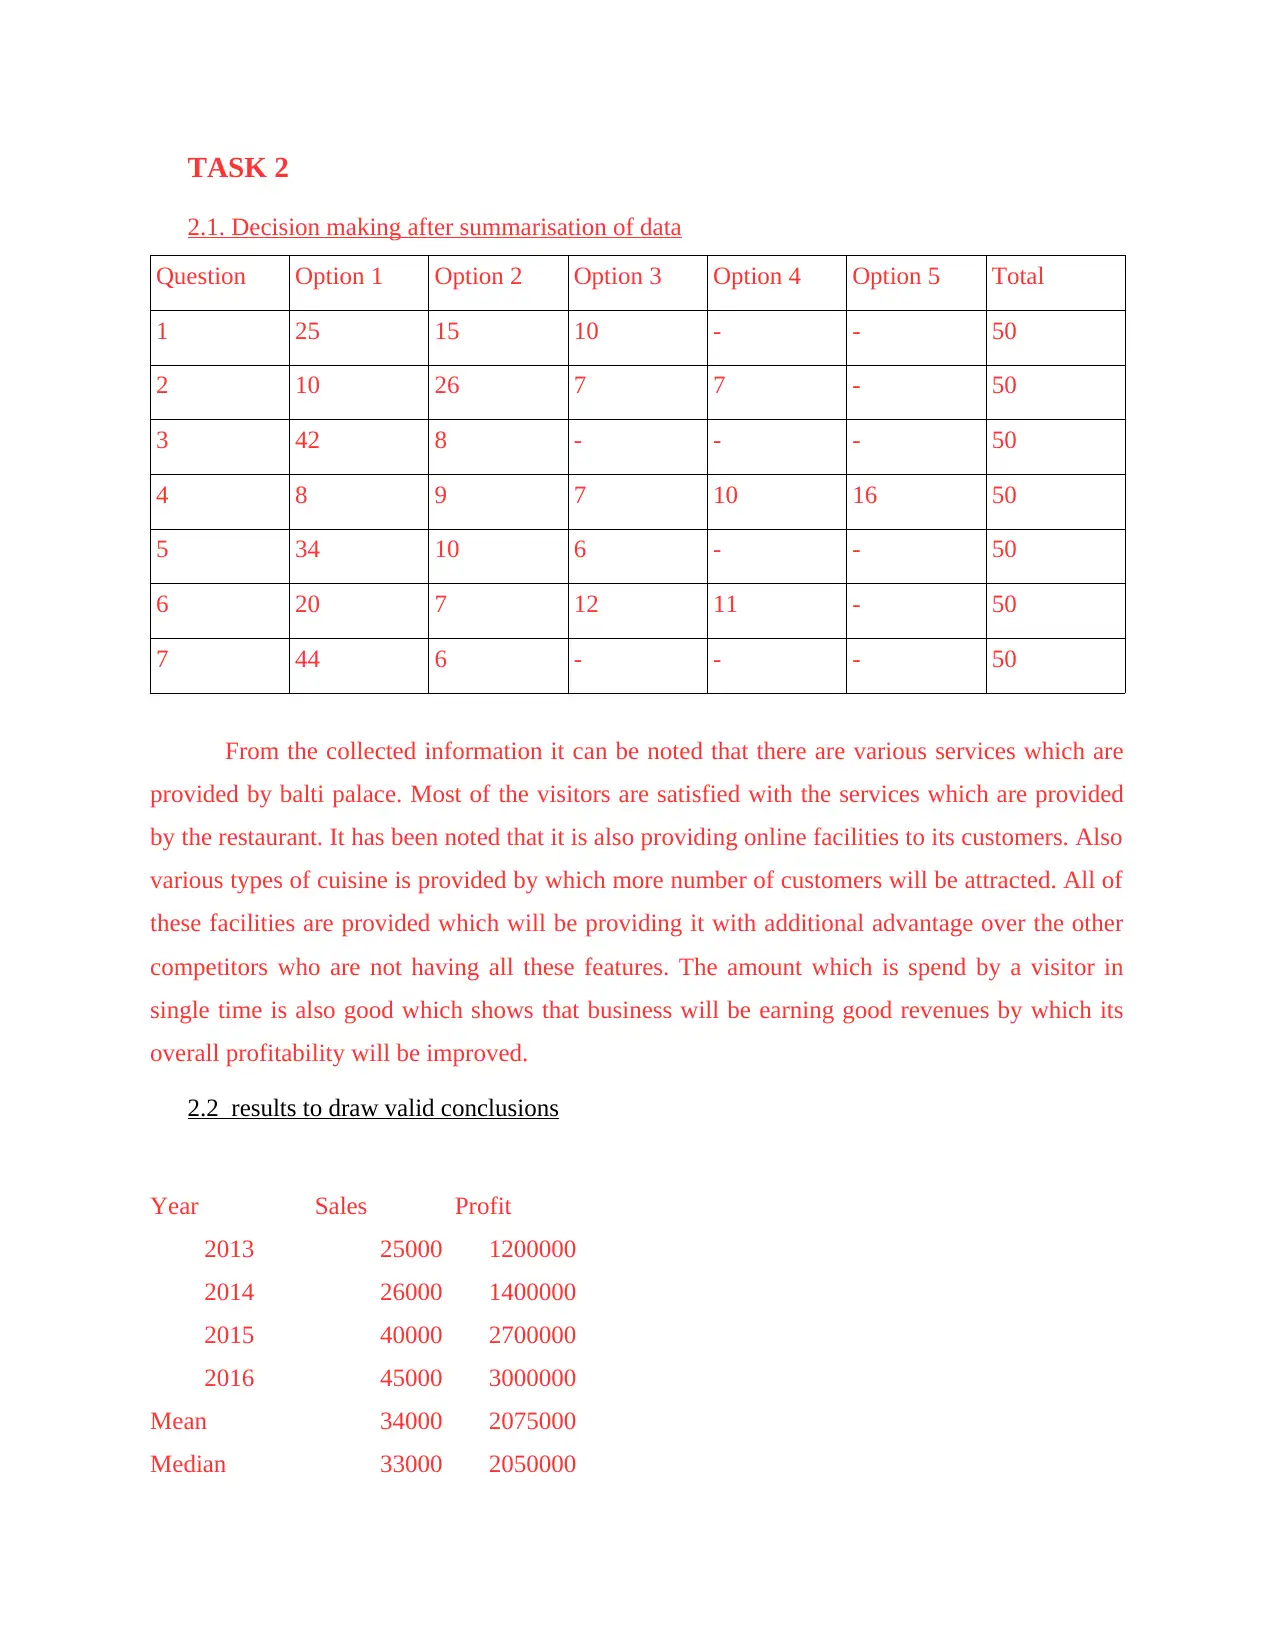
2.1. Decision making after summarisation of data
Question Option 1 Option 2 Option 3 Option 4 Option 5 Total
1 25 15 10 - - 50
2 10 26 7 7 - 50
3 42 8 - - - 50
4 8 9 7 10 16 50
5 34 10 6 - - 50
6 20 7 12 11 - 50
7 44 6 - - - 50
From the collected information it can be noted that there are various services which are
provided by balti palace. Most of the visitors are satisfied with the services which are provided
by the restaurant. It has been noted that it is also providing online facilities to its customers. Also
various types of cuisine is provided by which more number of customers will be attracted. All of
these facilities are provided which will be providing it with additional advantage over the other
competitors who are not having all these features. The amount which is spend by a visitor in
single time is also good which shows that business will be earning good revenues by which its
overall profitability will be improved.
2.2 results to draw valid conclusions
Year Sales Profit
2013 25000 1200000
2014 26000 1400000
2015 40000 2700000
2016 45000 3000000
Mean 34000 2075000
Median 33000 2050000
Paraphrase This Document
Need a fresh take? Get an instant paraphrase of this document with our AI Paraphraser
Mode 25000 1200000
Interpretation:
In the year 2013 the sales of the Balati palace is 25000 and their profits are 1200000. But
in 2014 their sales increased by 10000 and their profits also get increased by 200000 so there
profits for 2014 is 1400000. In the year 2015 sales of Balati palace is 40000 and their profits are
2700000 and in the year of 2016 their sales and profits are 45000 and 3000000 respectively. So it
is concluded that there profits are increasing continuously(García-Peñalvo, and Conde, 2014).
So as per the above information of the Balati palace that their mean value is very
effective because it is more than an average of their sales and profits. That is helps to enhance
their profitability in the market place. Median is related with the mid value. The median of the
Balati palace of their sales are 33000 and for their profits are 2050000. So when Balati palace
want to calculate their mid value of their sales and profits they prefer to calculate Media.
2.3 data using measures of dispersion
standard deviation 10033.2779621949 standard deviation 906917.857360853
skewness 0.2019768688 skewness 0.0519478822
kurtosis -4.7523573527 kurtosis -5.2297742999
variances 100666666.666667 variances 822500000000
lower 25000 lower 1200000
upper 45000 upper 3000000
Measure of dispersion is related with the non negative and are always in real number. If
all data is same then the value is always zero but if it increases then data will become more
different. The data which is calculated must be always in a same unit so that it can be measured
easily. There are various examples of measure of dispersion such as standard deviation, range
etc.
Standard deviation helps to calculate the data distribution spread. If there in more spread
in the available data then the standard deviation is also greater. The value of standard deviation
never be negative(Hwang, and Yoon, 2012). The standard deviation of Balti palace is
906917.857360853.
The range of the Balti palace can be calculate in both upper as well as lower. The lower
range of the palace is 1200000 and the upper range is 3000000. Range helps to identify the
difference between low and high prices of the Balti palace.
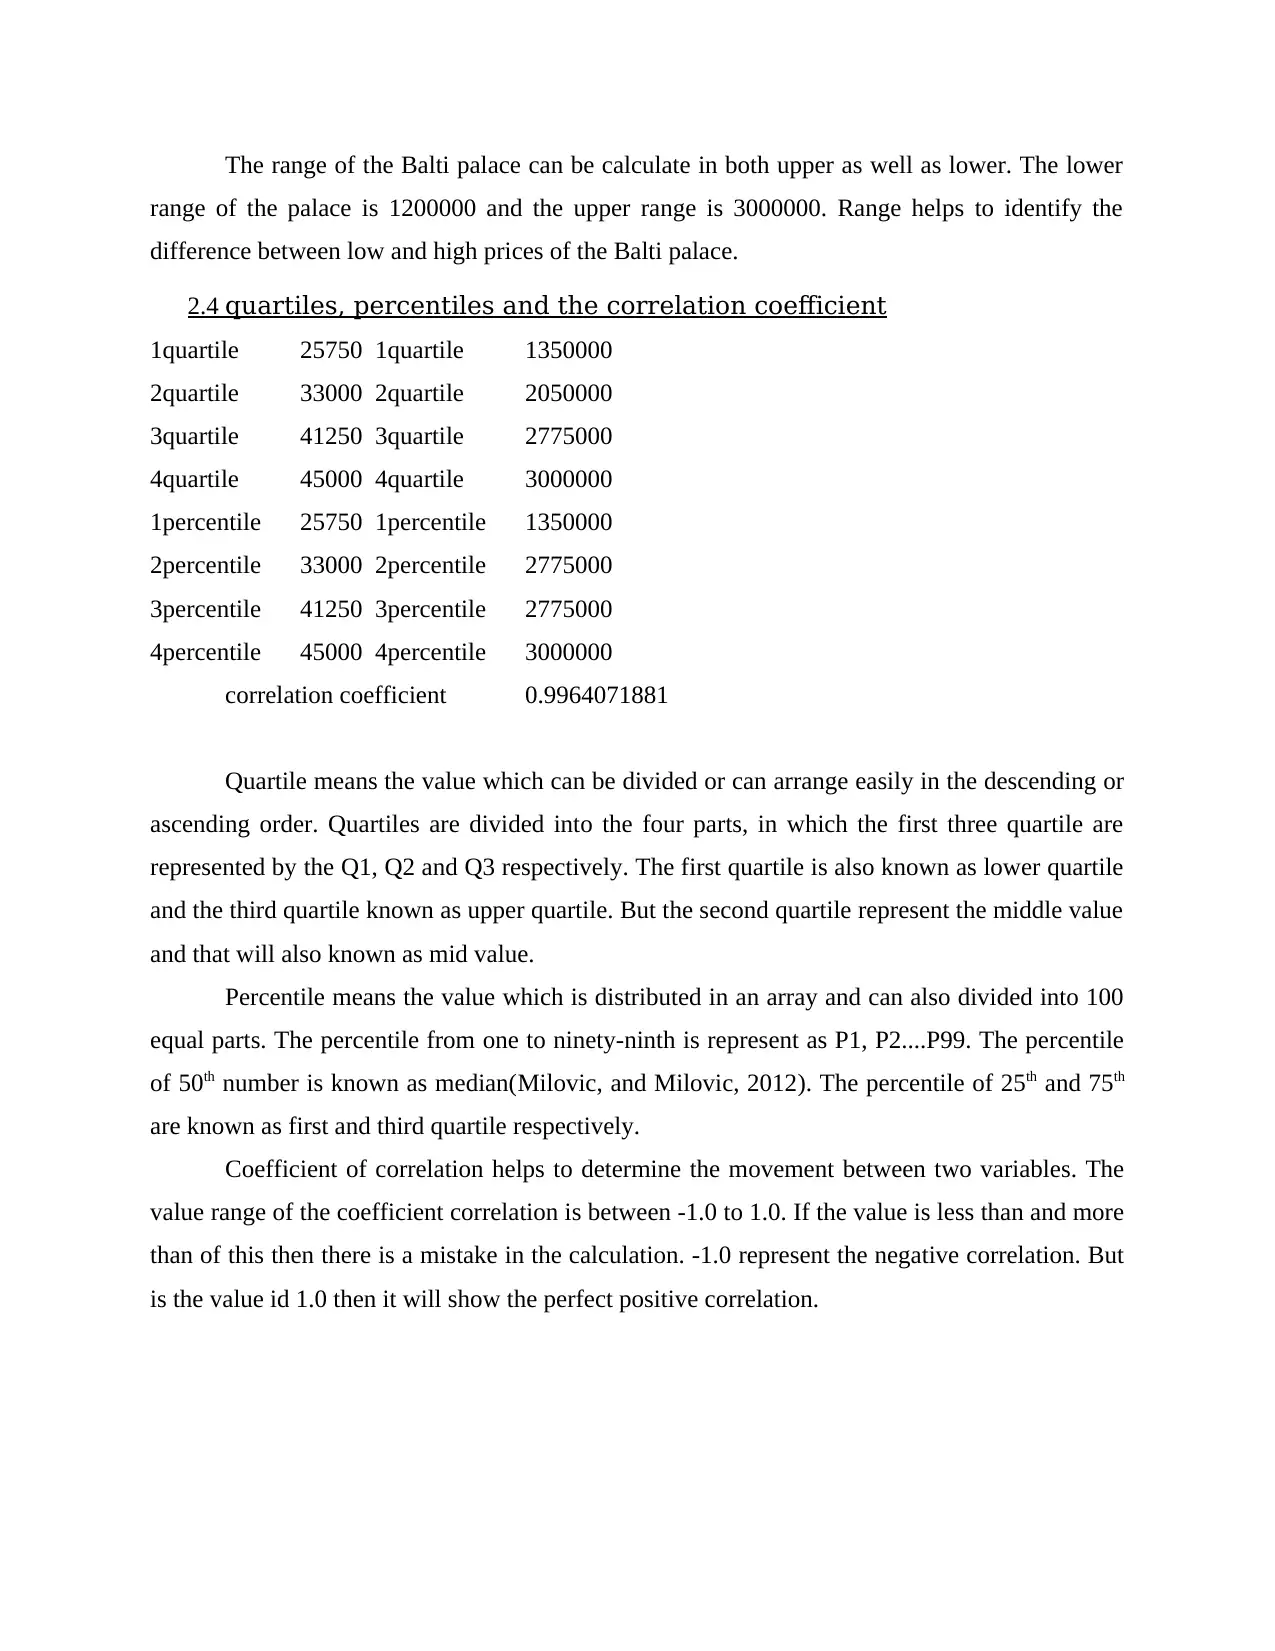
2.4 quartiles, percentiles and the correlation coefficient
1quartile 25750 1quartile 1350000
2quartile 33000 2quartile 2050000
3quartile 41250 3quartile 2775000
4quartile 45000 4quartile 3000000
1percentile 25750 1percentile 1350000
2percentile 33000 2percentile 2775000
3percentile 41250 3percentile 2775000
4percentile 45000 4percentile 3000000
correlation coefficient 0.9964071881
Quartile means the value which can be divided or can arrange easily in the descending or
ascending order. Quartiles are divided into the four parts, in which the first three quartile are
represented by the Q1, Q2 and Q3 respectively. The first quartile is also known as lower quartile
and the third quartile known as upper quartile. But the second quartile represent the middle value
and that will also known as mid value.
Percentile means the value which is distributed in an array and can also divided into 100
equal parts. The percentile from one to ninety-ninth is represent as P1, P2....P99. The percentile
of 50th number is known as median(Milovic, and Milovic, 2012). The percentile of 25th and 75th
are known as first and third quartile respectively.
Coefficient of correlation helps to determine the movement between two variables. The
value range of the coefficient correlation is between -1.0 to 1.0. If the value is less than and more
than of this then there is a mistake in the calculation. -1.0 represent the negative correlation. But
is the value id 1.0 then it will show the perfect positive correlation.
range of the palace is 1200000 and the upper range is 3000000. Range helps to identify the
difference between low and high prices of the Balti palace.
2.4 quartiles, percentiles and the correlation coefficient
1quartile 25750 1quartile 1350000
2quartile 33000 2quartile 2050000
3quartile 41250 3quartile 2775000
4quartile 45000 4quartile 3000000
1percentile 25750 1percentile 1350000
2percentile 33000 2percentile 2775000
3percentile 41250 3percentile 2775000
4percentile 45000 4percentile 3000000
correlation coefficient 0.9964071881
Quartile means the value which can be divided or can arrange easily in the descending or
ascending order. Quartiles are divided into the four parts, in which the first three quartile are
represented by the Q1, Q2 and Q3 respectively. The first quartile is also known as lower quartile
and the third quartile known as upper quartile. But the second quartile represent the middle value
and that will also known as mid value.
Percentile means the value which is distributed in an array and can also divided into 100
equal parts. The percentile from one to ninety-ninth is represent as P1, P2....P99. The percentile
of 50th number is known as median(Milovic, and Milovic, 2012). The percentile of 25th and 75th
are known as first and third quartile respectively.
Coefficient of correlation helps to determine the movement between two variables. The
value range of the coefficient correlation is between -1.0 to 1.0. If the value is less than and more
than of this then there is a mistake in the calculation. -1.0 represent the negative correlation. But
is the value id 1.0 then it will show the perfect positive correlation.
⊘ This is a preview!⊘
Do you want full access?
Subscribe today to unlock all pages.
Trusted by 1+ million students worldwide
TASK 3
3.1 Graphs
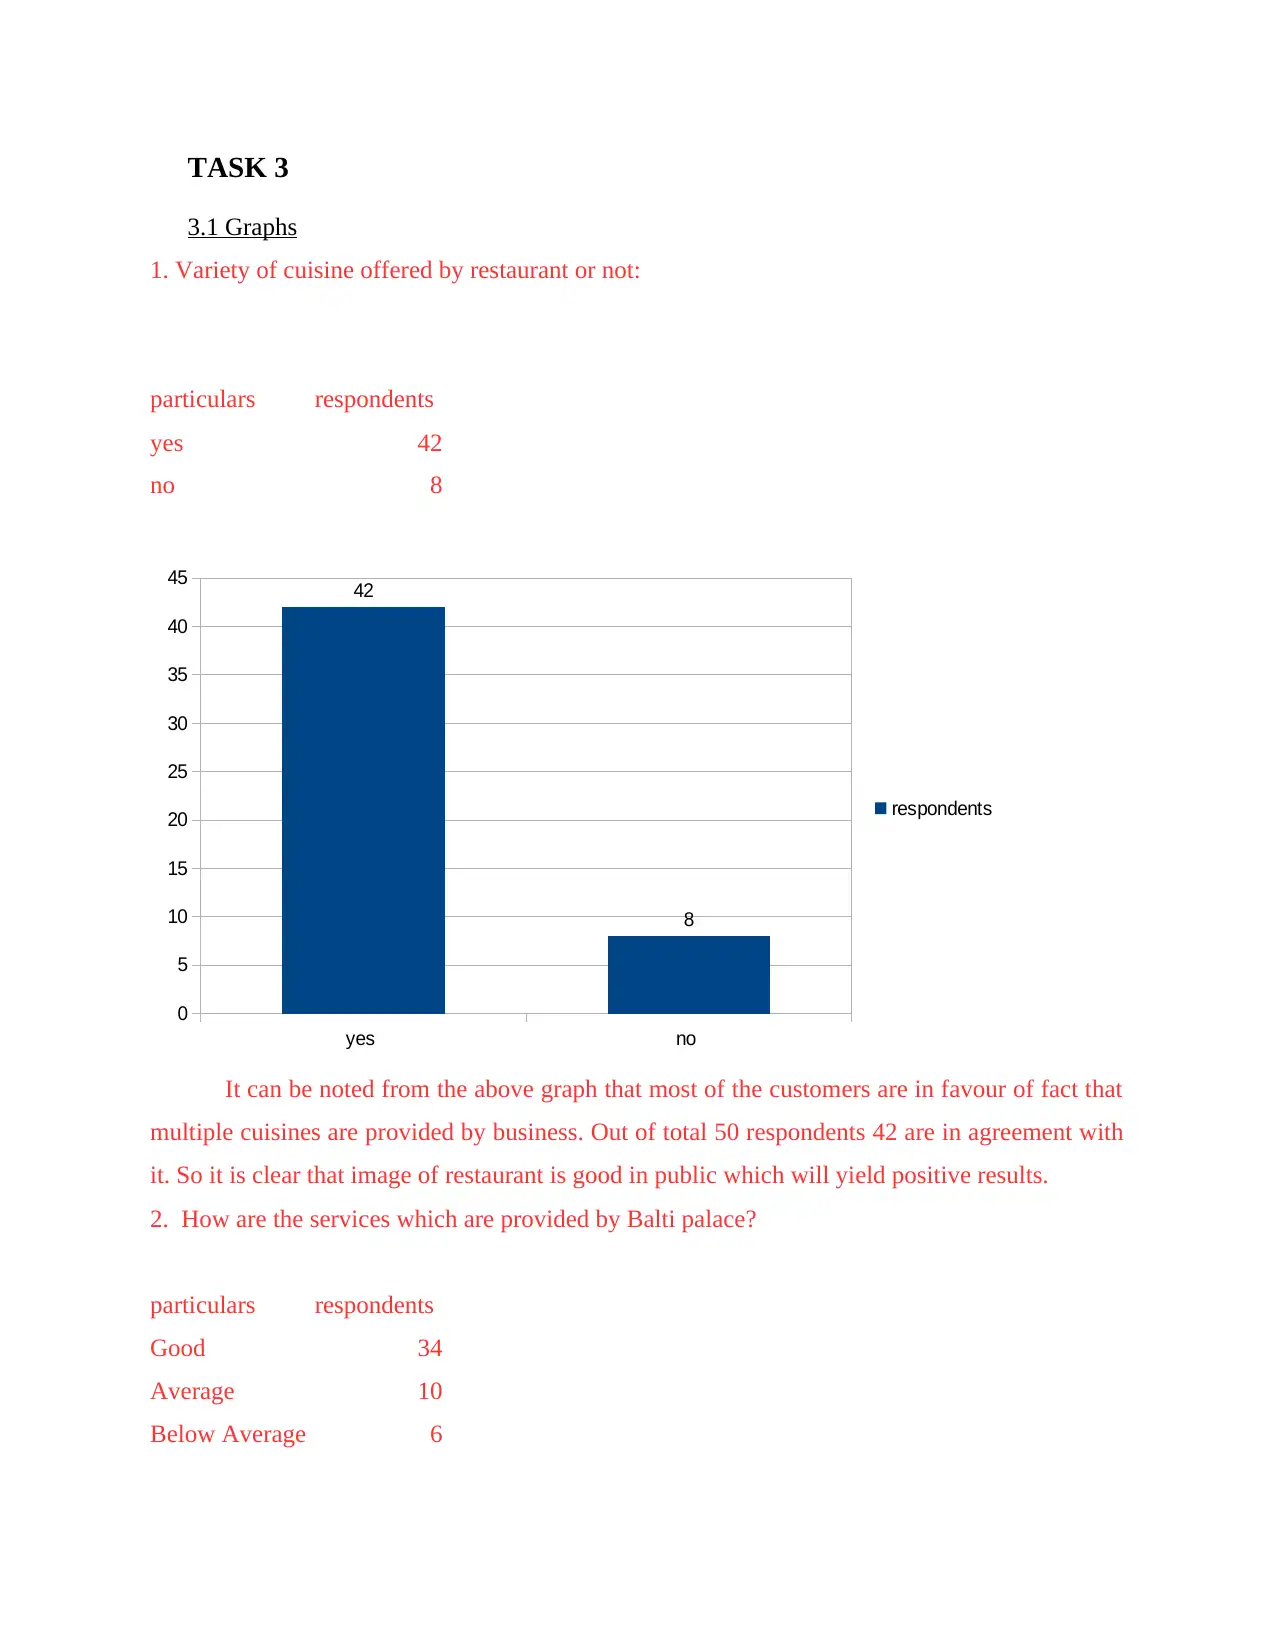
1. Variety of cuisine offered by restaurant or not:
particulars respondents
yes 42
no 8
yes no
0
5
10
15
20
25
30
35
40
45 42
8
respondents
It can be noted from the above graph that most of the customers are in favour of fact that
multiple cuisines are provided by business. Out of total 50 respondents 42 are in agreement with
it. So it is clear that image of restaurant is good in public which will yield positive results.
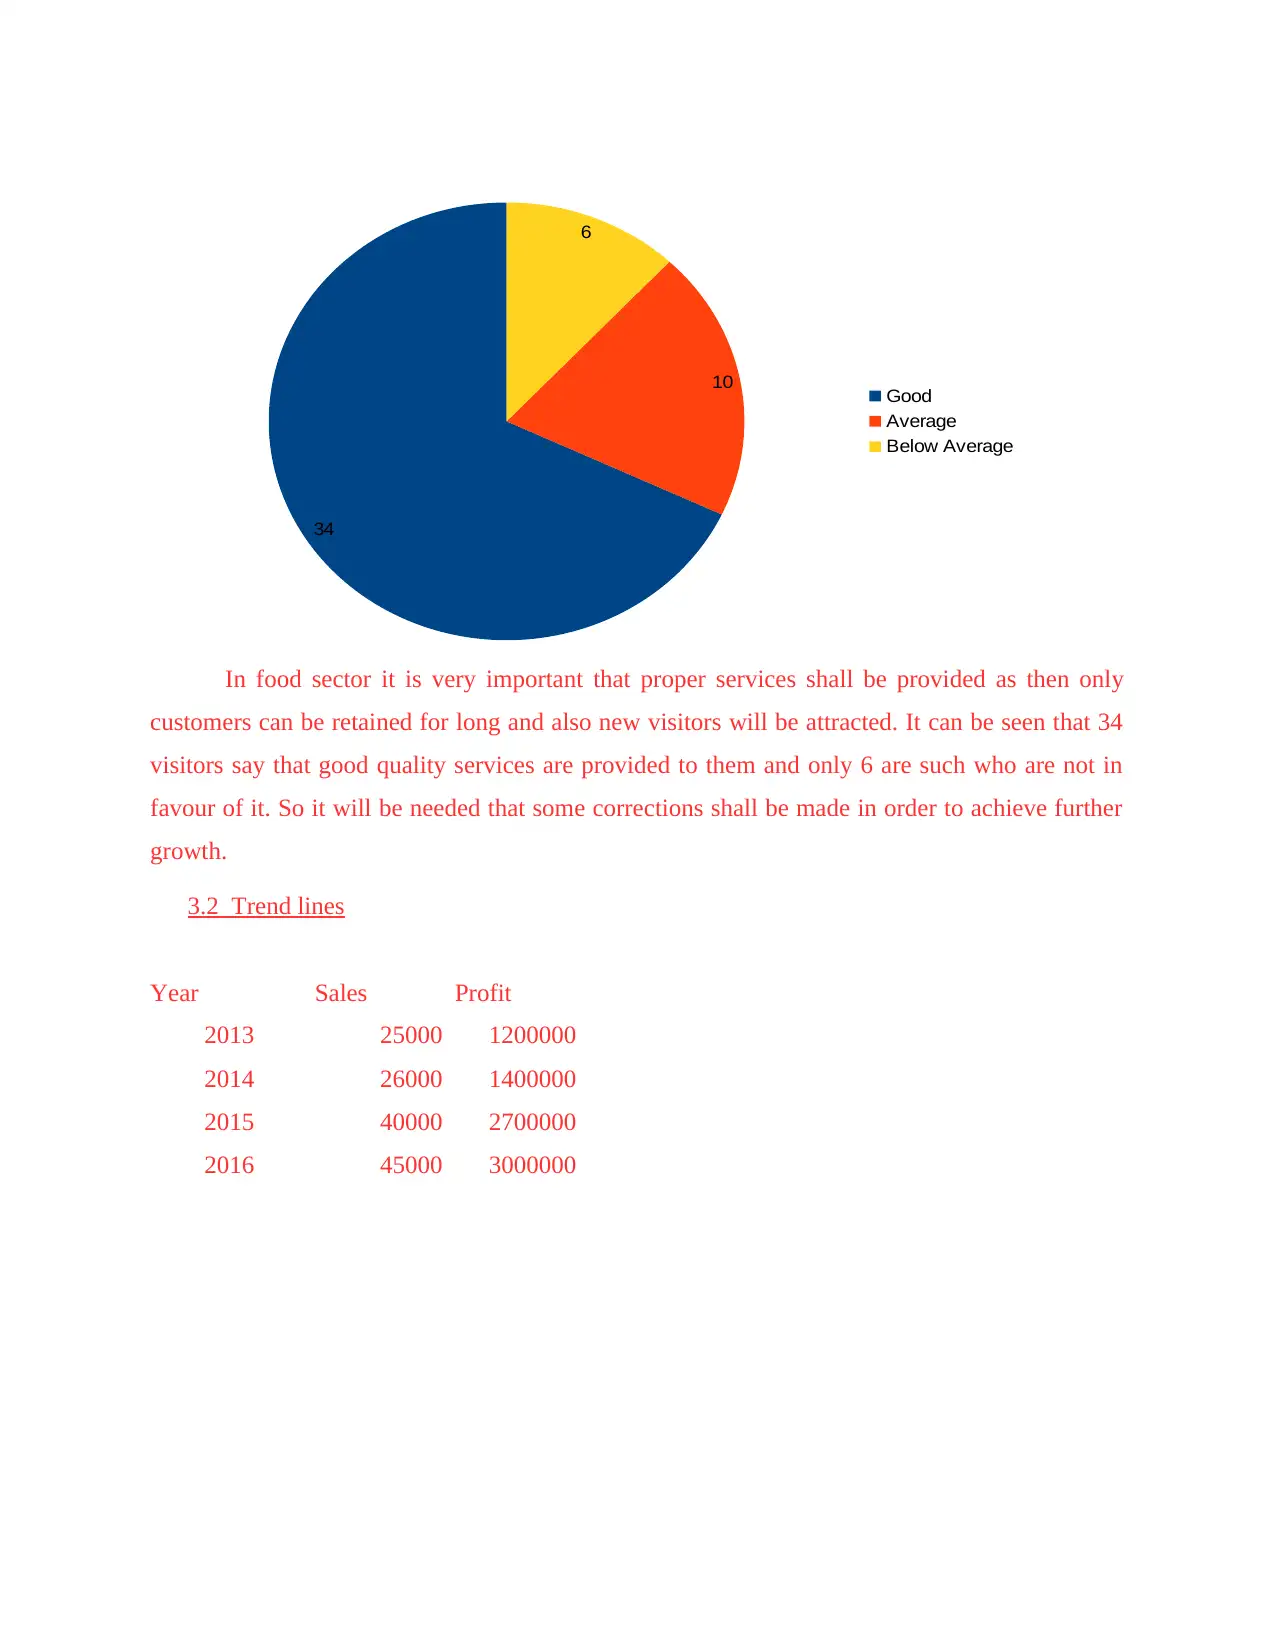
2. How are the services which are provided by Balti palace?
particulars respondents
Good 34
Average 10
Below Average 6
3.1 Graphs
1. Variety of cuisine offered by restaurant or not:
particulars respondents
yes 42
no 8
yes no
0
5
10
15
20
25
30
35
40
45 42
8
respondents
It can be noted from the above graph that most of the customers are in favour of fact that
multiple cuisines are provided by business. Out of total 50 respondents 42 are in agreement with
it. So it is clear that image of restaurant is good in public which will yield positive results.
2. How are the services which are provided by Balti palace?
particulars respondents
Good 34
Average 10
Below Average 6
Paraphrase This Document
Need a fresh take? Get an instant paraphrase of this document with our AI Paraphraser
34
10
6
Good
Average
Below Average
In food sector it is very important that proper services shall be provided as then only
customers can be retained for long and also new visitors will be attracted. It can be seen that 34
visitors say that good quality services are provided to them and only 6 are such who are not in
favour of it. So it will be needed that some corrections shall be made in order to achieve further
growth.
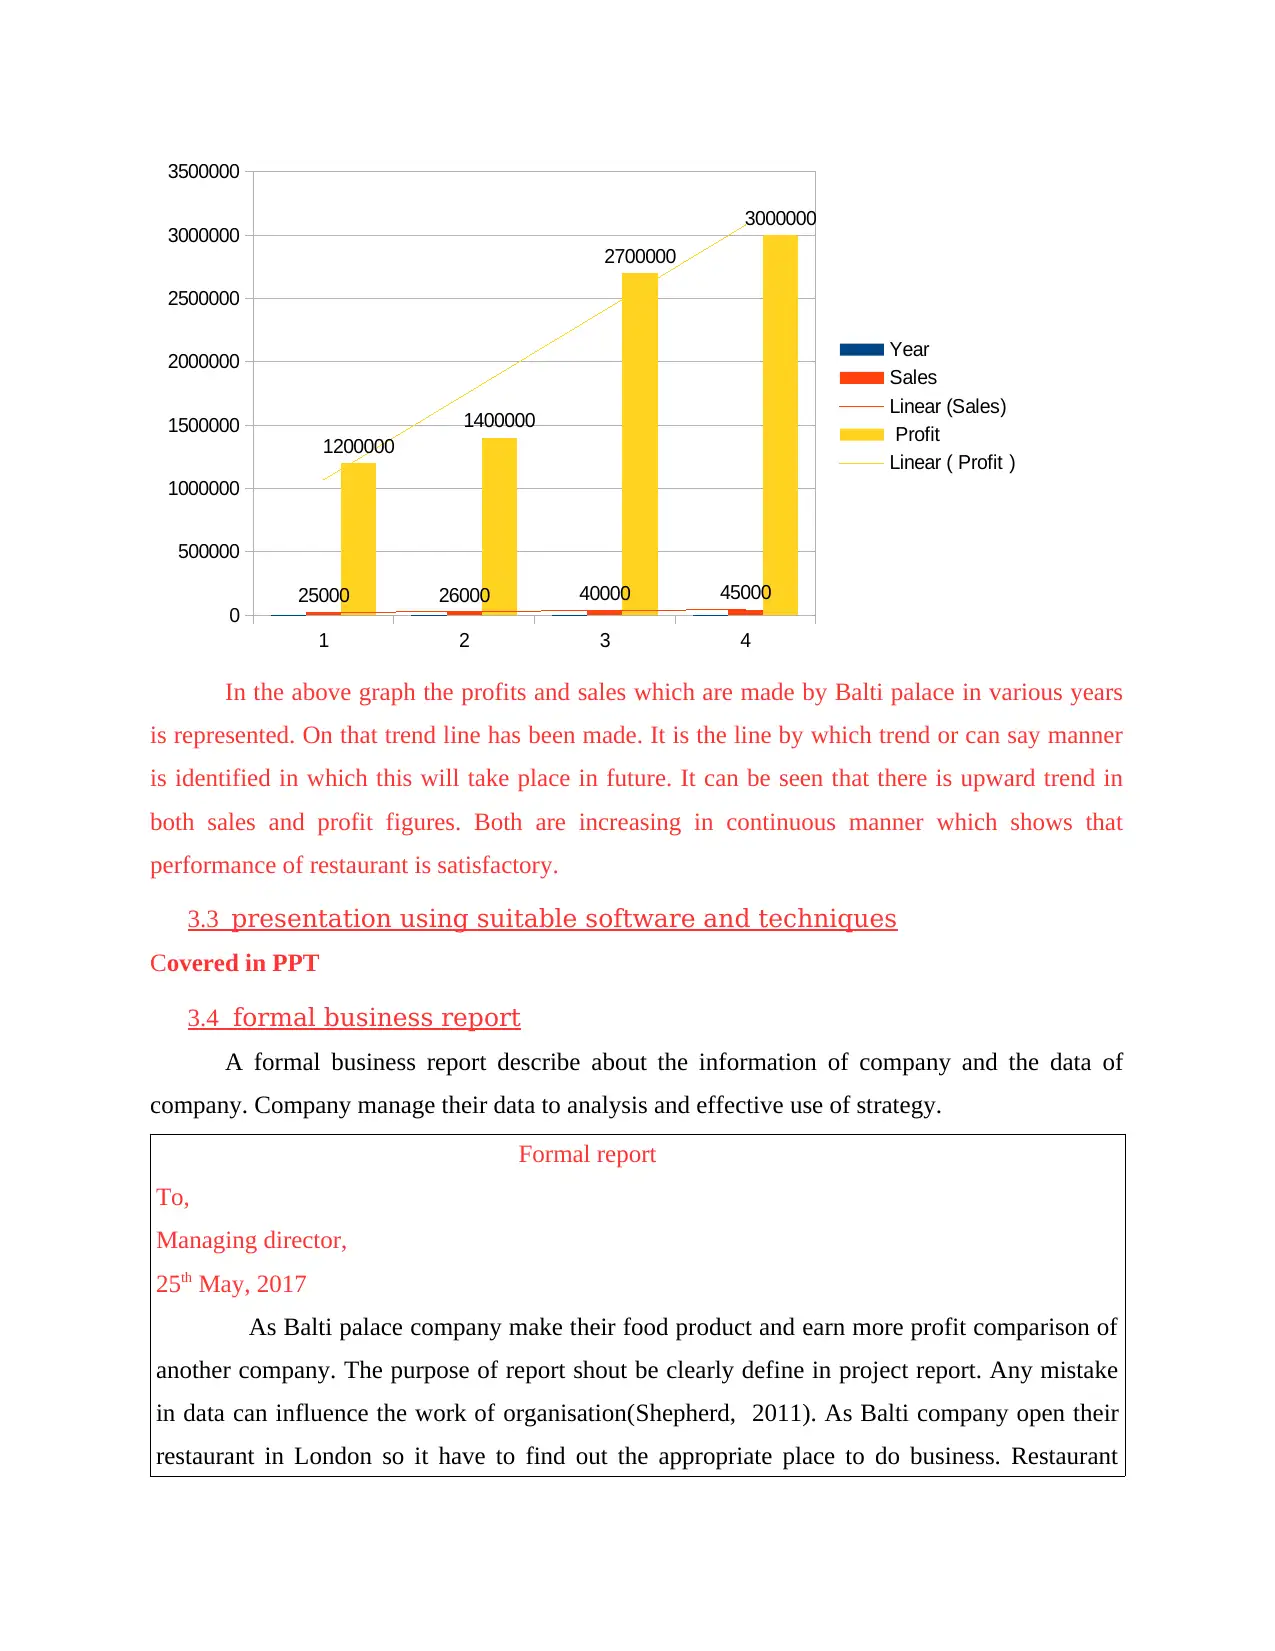
3.2 Trend lines
Year Sales Profit
2013 25000 1200000
2014 26000 1400000
2015 40000 2700000
2016 45000 3000000
10
6
Good
Average
Below Average
In food sector it is very important that proper services shall be provided as then only
customers can be retained for long and also new visitors will be attracted. It can be seen that 34
visitors say that good quality services are provided to them and only 6 are such who are not in
favour of it. So it will be needed that some corrections shall be made in order to achieve further
growth.
3.2 Trend lines
Year Sales Profit
2013 25000 1200000
2014 26000 1400000
2015 40000 2700000
2016 45000 3000000
1 2 3 4
0
500000
1000000
1500000
2000000
2500000
3000000
3500000
25000 26000 40000 45000
1200000
1400000
2700000
3000000
Year
Sales
Linear (Sales)
Profit
Linear ( Profit )
In the above graph the profits and sales which are made by Balti palace in various years
is represented. On that trend line has been made. It is the line by which trend or can say manner
is identified in which this will take place in future. It can be seen that there is upward trend in
both sales and profit figures. Both are increasing in continuous manner which shows that
performance of restaurant is satisfactory.
3.3 presentation using suitable software and techniques
Covered in PPT
3.4 formal business report
A formal business report describe about the information of company and the data of
company. Company manage their data to analysis and effective use of strategy.
Formal report
To,
Managing director,
25th May, 2017
As Balti palace company make their food product and earn more profit comparison of
another company. The purpose of report shout be clearly define in project report. Any mistake
in data can influence the work of organisation(Shepherd, 2011). As Balti company open their
restaurant in London so it have to find out the appropriate place to do business. Restaurant
⊘ This is a preview!⊘
Do you want full access?
Subscribe today to unlock all pages.
Trusted by 1+ million students worldwide
1 out of 17
Related Documents


Your All-in-One AI-Powered Toolkit for Academic Success.
+13062052269
info@desklib.com
Available 24*7 on WhatsApp / Email
![[object Object]](/_next/static/media/star-bottom.7253800d.svg)
Unlock your academic potential
Copyright © 2020–2026 A2Z Services. All Rights Reserved. Developed and managed by ZUCOL.