Business Decision Making: Tour Package Analysis and Findings Report

Verified

Added on  2020/02/12

|23
|3960
|82
Report
AI Summary
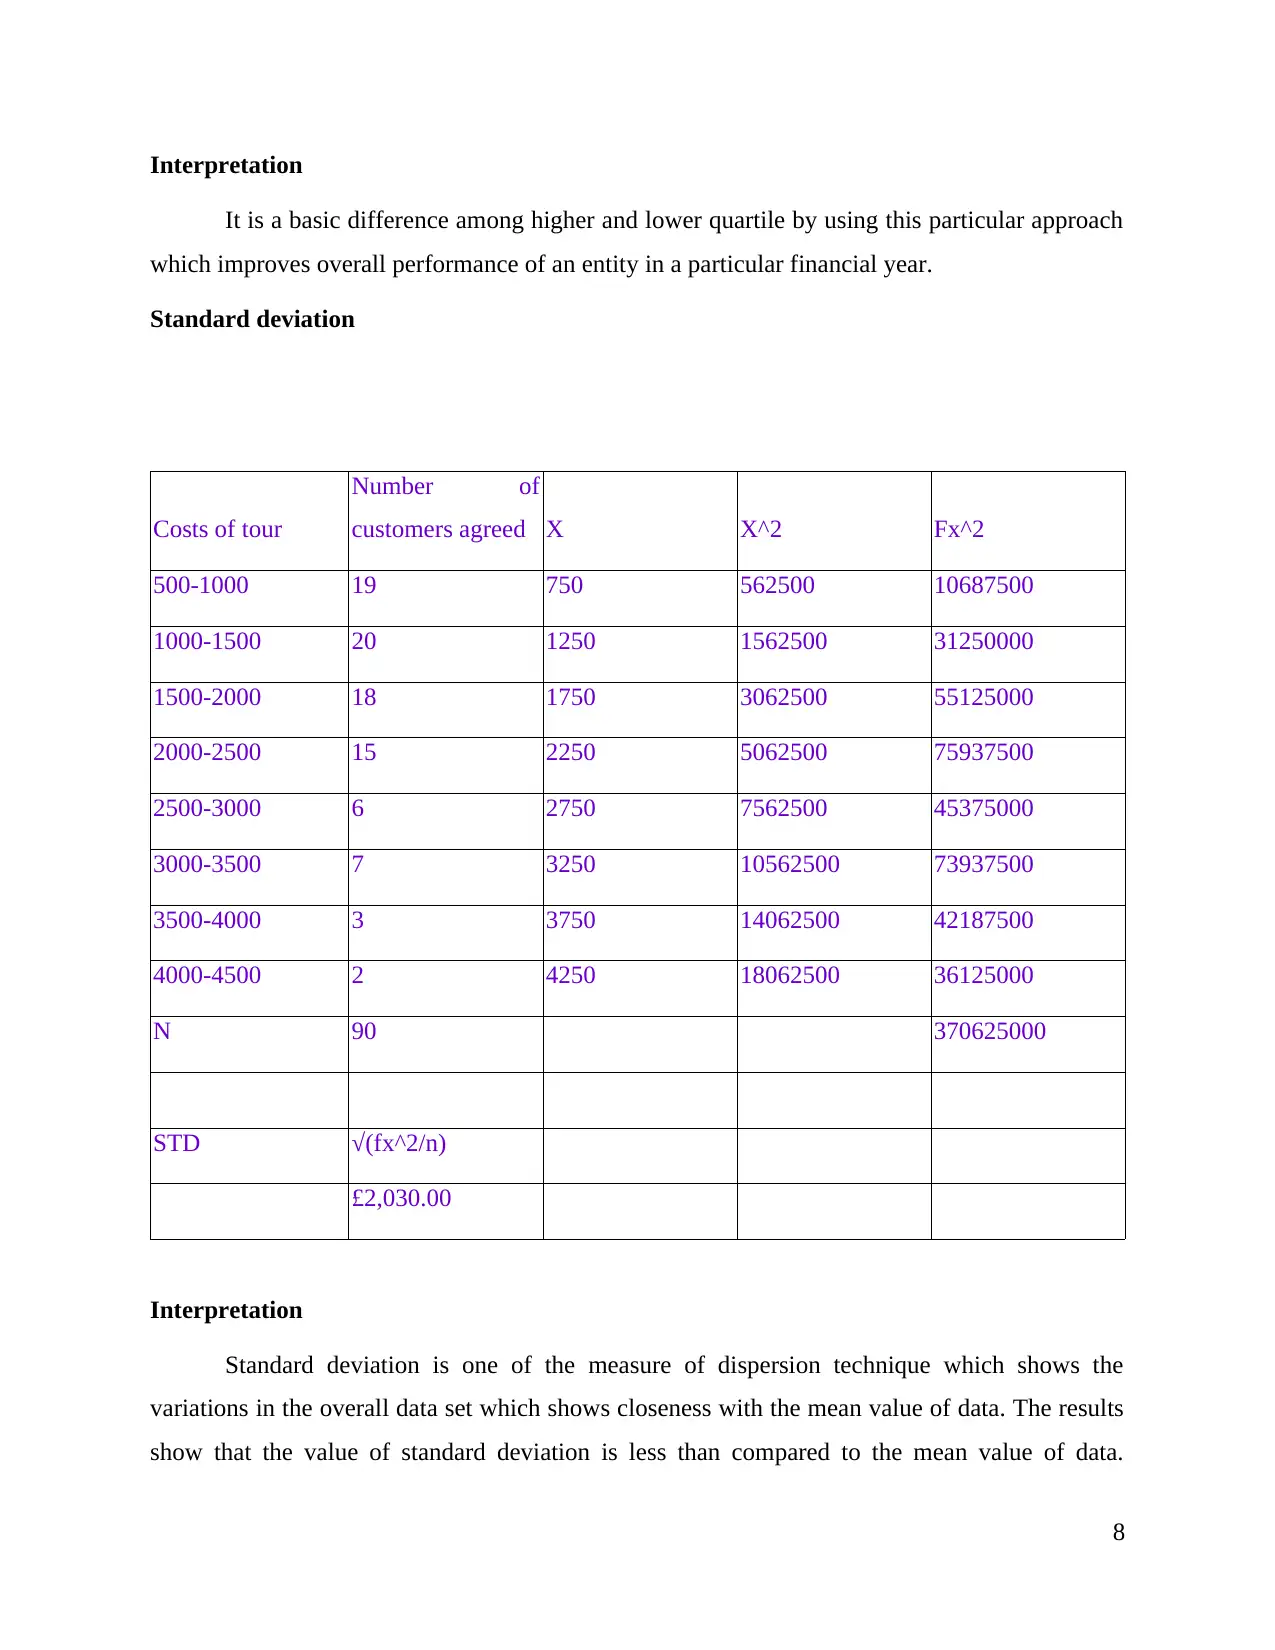
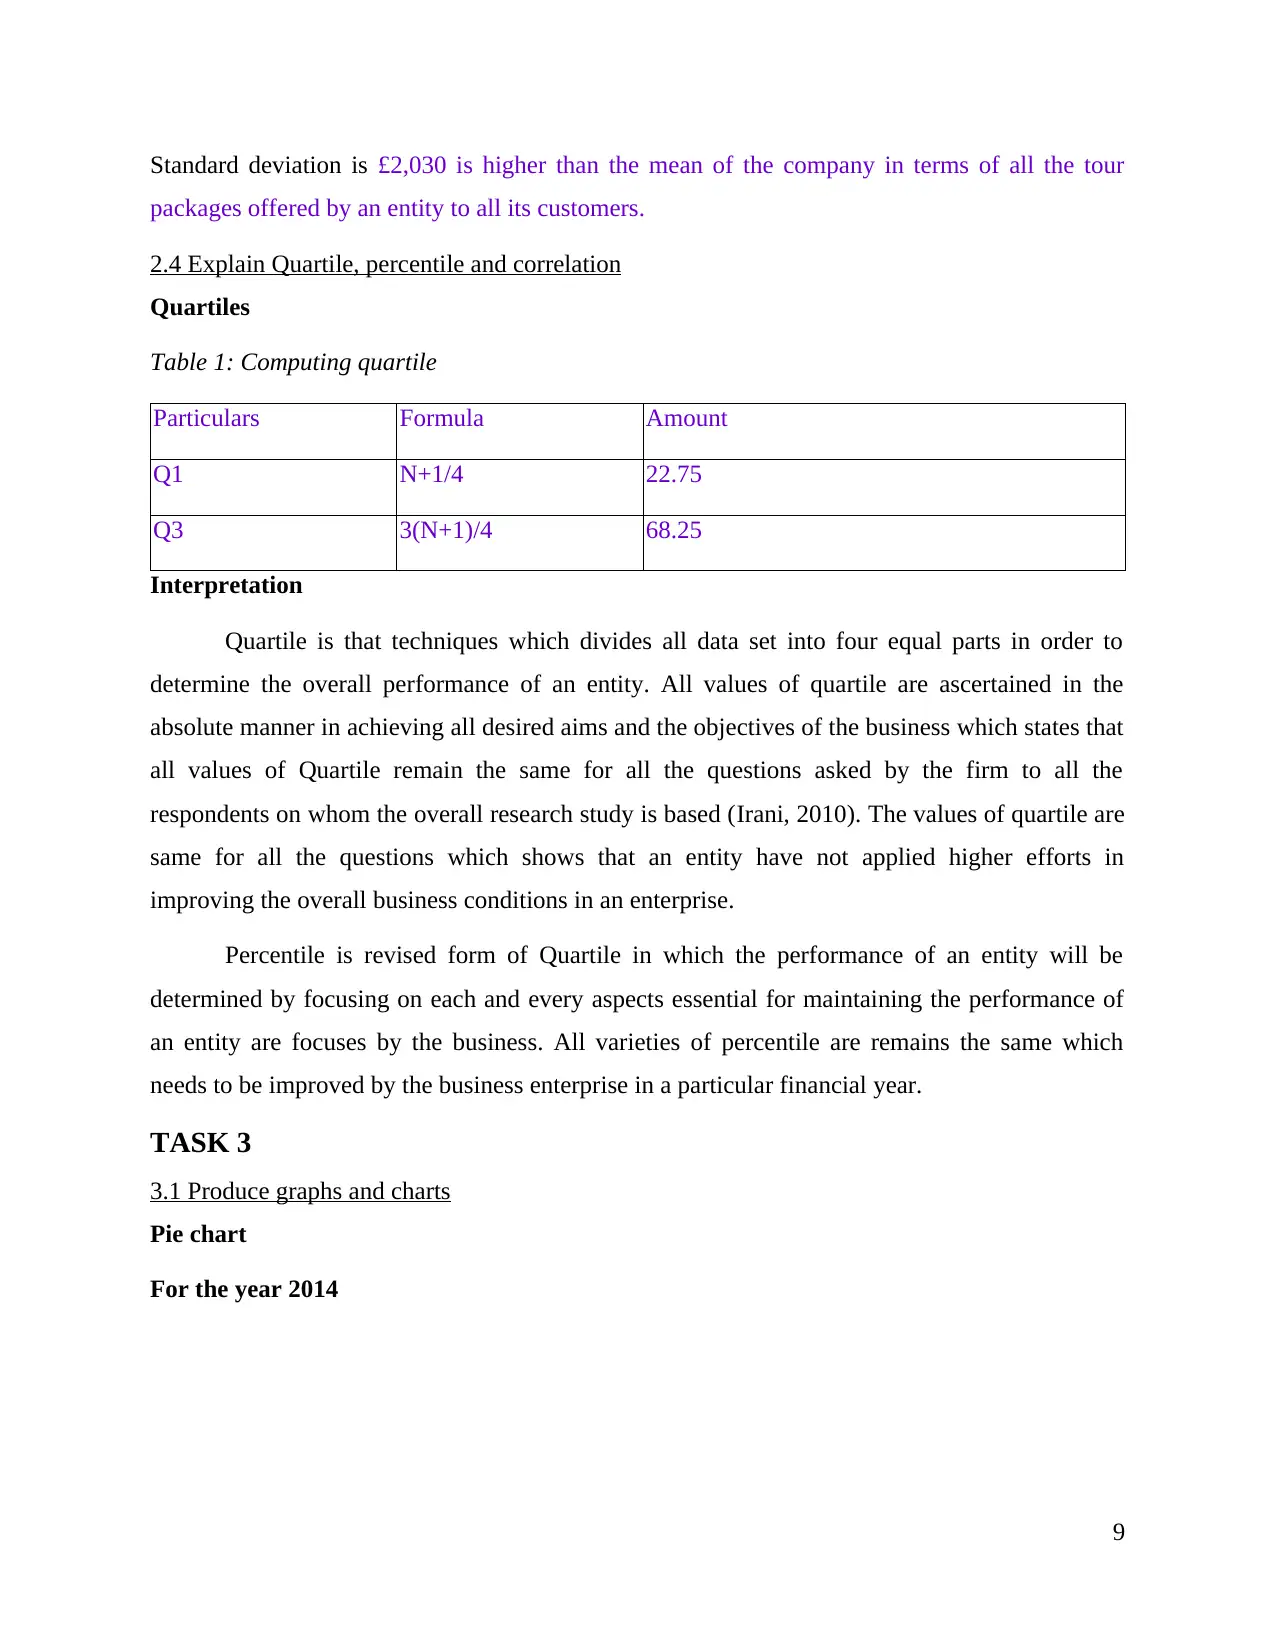
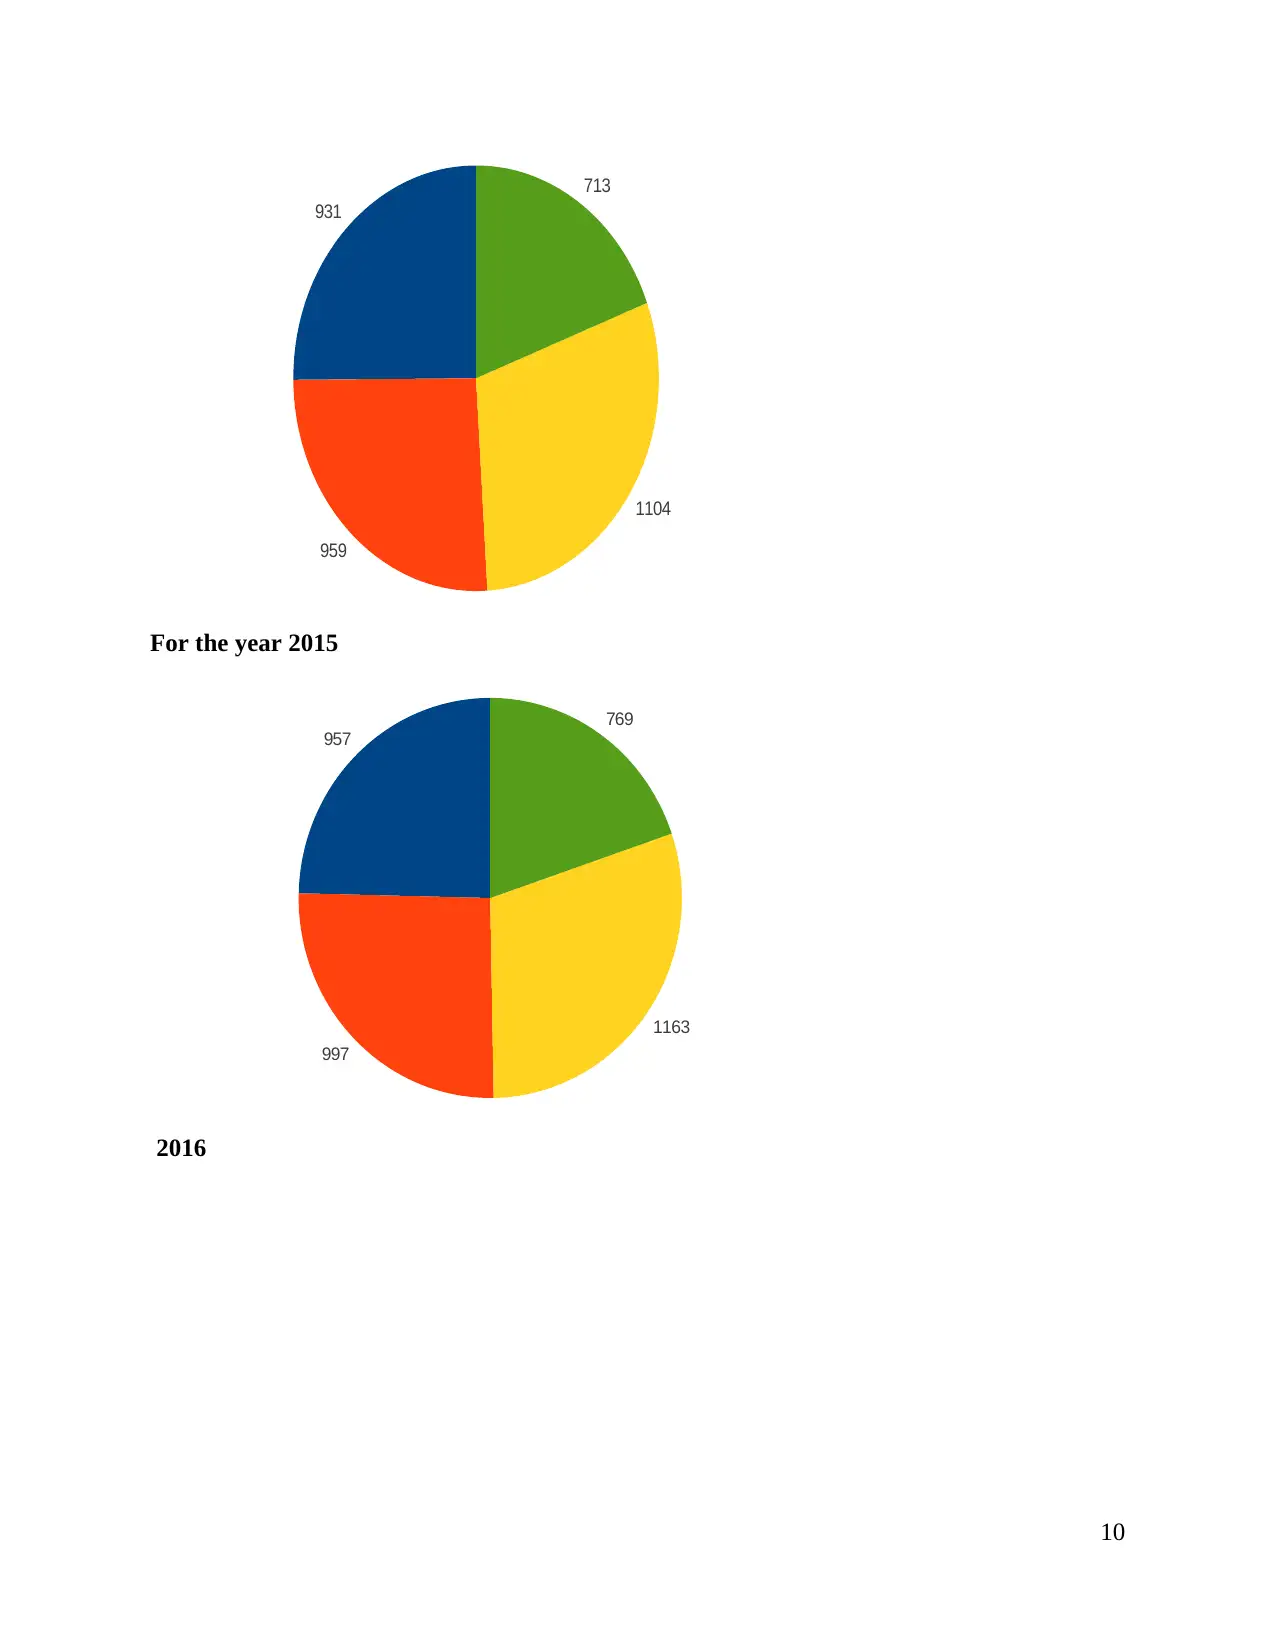
This report delves into business decision-making processes, focusing on data analysis related to tour packages. It begins with an introduction to the importance of decision-making in achieving business objectives. The report outlines the methodology, including primary and secondary data collection methods, such as questionnaires and travel magazines. It details the survey methodology, including sampling techniques and questionnaire design. The report then summarizes the collected data using statistical tools like mean, median, mode, standard deviation, and interquartile range. The analysis includes measures of central tendency and dispersion, with interpretations of the results. Finally, the report presents the data visually using pie charts and bar charts to illustrate customer preferences and predict future performance, concluding with a discussion of quartiles, percentiles, and correlation.
Document Page
BUSINESS DECISION
MAKING
tabler-icon-diamond-filled.svg

Paraphrase This Document

Need a fresh take? Get an instant paraphrase of this document with our AI Paraphraser
Document Page
Document Page
INTRODUCTION
Decision plays an important role in enhancing overall skills and the capabilities of an
individual in order to achieve desired aims and the objectives within a given period. This project
report is all about considering each and every features of the tour packages in order to satisfy all
the needs and higher expectations of various customers in order to retain all of them within the
same business for long period in the same business. This project is al about creating data analysis
plan of collecting data and facts using two important methods such as primary and secondary.
Questionnaires is prepared to take the consent of all the visitors who intends to launch a new tour
package according to the tastes and preferences of various consumers located at the external
market. It includes various statistical tools such as mean, median, mode, standard deviation,
range and internal quartile range to test the feasibility of the collected data. The data will be
presented using graphs, bar charts and pic chart and tend line is used to predict the future
performance of an entity. Information processing tools are used to supply information from one
end to another and project tenure will be determined by preparing appropriate project plan and
feasibility will be checked through the application of various capital budgeting technique NPV
and IRR.
TASK 1
1.1 Identify sources of primary and secondary sources of data
Collection of data is regarded as one of the important approach in the research study as
this is act like an important pillar without which the building of research is not possible as an
individual starts research but will not conclude their overall research in the best possible manner.
There are two important sources of collection of data choose by an individual in order to collect
reliable amount of data in order to achieve all the desired aims and the objectives in a given
period to accomplish al desired aims and the objectives (Golbraikh and et.al., 2014). There are
two methods used in the overall research is given as below:
Data will be collected by a researcher about the details of al the visitors in knowing their
tastes and preferences about a particular destination. Destinations preferences of all the customer
is essential to be determine as this help an entity owner in customizing tour packages according
their wants.
1
Document Page
Primary research- In this kind of research data will be collected from its designated source by
an individual in order to support the research study in completing them in a given period for the
beneficial of the business entity. Questionnaires are used by an entity in order to take the consent
of all individuals in accomplishing all the goals and the objectives.
Secondary research- In this kind of approach external market sources will be accessed in order
to collect important data about the customer's tastes and preferences, market trends as major aim
of an entity is accomplished all goals and the objectives of the business in order to complete the
research. Travel magazines will be used as one of the external source in which details about the
travel and tourism industry will be identified. Census data will be assessed in identifying he
income patterns of all the customers in order to design prices for various tour packages.
1.2 Present survey methodology
Methodologies play a significant role in a particular survey in which desired aim of the
business to provide right direction to the overall business (Haq, Brown and Moltchanova, 2014).
The survey conducted by the researcher will emphasize on considering all the facts and figures
important for concluding the research for the betterment of the firm.
Sampling used by an entity will help an individual in order to collect important facts and
figures in achieving all the goals and the objectives within a given period. Sample of 90
respondents will be selected by a researcher in order to take the answers of various respondents
on the viability of different tour destinations to be included in a variety of tour packages
designed by an entity.
Random sampling used by an individual in which data will be collected randomly as in
this stage every samples got equal chance of selection in contributing towards the conclusion of
overall research.
1.3 Design questionnaire
Questionnaire
Name _______________
Gender
Male
2
tabler-icon-diamond-filled.svg

Paraphrase This Document

Need a fresh take? Get an instant paraphrase of this document with our AI Paraphraser
Document Page
Female
Transgender
Que. 1. How old are you?
20-30 years old
30-40 years old
40-60 years old
60 years and above
Que. 2: What is your experience with the travel and tour operator while you book your tickets?
Good
Fair
Very Good
Awesome
Que. 3: What is the frequency of your travel booking?
Monthly
Quarterly
Half yearly
Yearly
Sometimes
Que. 4: You will buy a tour package or product for destination A such as Morocco in further
years ?
Strongly disagree
Disagree
Neutral
Agree
3
Document Page
Strongly agree
Que. 5. How much you are going to pay for tour package or product for every person or traveler
for the destination A like as Morocco ?
£500- £1000
£1000-£1500
£1500-£2000
Que. 6. I will buy a tour package or product for destination B such as Turkey in upcoming years
Strongly disagree
Disagree
Neutral
Agree
Strongly agree
Que. 7: How much you will spend on the ravel package for the destination B like as Turkey ?
£600 but less than 625
£625 but less than 650
£650 but less than 675
Que. 8: Do you purchase tour package for the famous destination like Cuba in future?
Strongly disagree
Disagree
Neutral
Agree
Strongly agree
Que. 9. How much do you pay for booking ravel package for the destination like Cuba?
£800 but less than 825
4
Document Page
£825 but less than 850
£850 but less than 875
Que. 10. Will you book a tour package for destination D such as Dubai in near future?
Strongly disagree
Disagree
Neutral
Agree
Strongly agree
Que. 11: How much you are ready to pay for tour package for destination D that is Dubai?
£900 but less than 925
£925 but less than 950
£950 but less than 975
£975 but less than 1000
TASK 2
2.1 Summarizing of data
Costs of tour
Number of customers
agreed X FX
500-1000 19 750 14250
1000-1500 20 1250 25000
1500-2000 18 1750 31500
2000-2500 15 2250 33750
2500-3000 6 2750 16500
3000-3500 7 3250 22750
3500-4000 3 3750 11250
5
tabler-icon-diamond-filled.svg

Paraphrase This Document

Need a fresh take? Get an instant paraphrase of this document with our AI Paraphraser
Document Page
4000-4500 2 4250 8500
N 90 163500
Mean £1816.67
Costs of tour
Number of customers
agreed X CF
500-1000 19 750 19
1000-1500 20 1250 39
1500-2000 18 1750 57
2000-2500 15 2250 72
2500-3000 6 2750 78
3000-3500 7 3250 85
3500-4000 3 3750 88
4000-4500 2 4250 90
Median 45.5
Lower Limit 1500
N 45.5
Cf 39
f 18
I 500
Median L+N1-cf/f*i
6
Document Page
Median £1680.56
Mode 0
2.2 Analyse range of results
Arithmetic average- It is one of the important technique of measures of central tendency that is
arithmetic mean determined by an entity in order to accomplish desired aims and the objectives
within a given period. The average will be ascertained by an entity in order to enhance its overall
skills and the capabilities in improving current market position. The mean value is decreasing for
all the questions. It can be evident from the above results that out f the total 90 respondents of a
research majority of customers will purchase the tour packages on an average of £1816.67.
Median- It is that part of measures of the central tendency which will divides the overall data set
into two equal set out of which one part is higher than other part of the data (Golbraikh and et.al.,
2014). It is used to create a market trend that shows that median value of al the questions is
fluctuating in nature. Customers will purchase at least this tour package costs of £1680.56 which
generates this much revenue for an entity.
Mode- Higher number of repetition found in the overall data set will help an entity in order to
achieve desired aims and the objectives as this particular technique is useful in showing
consistency in the performance.
2.3 Analyse data using suitable measures of dispersion
Inter quartile range
Particulars Amount
Q1 22.75
Q3 68.25
IQR Q3-Q1
IQR 45.5
IQR= Q3-Q1
7
Document Page
Interpretation
It is a basic difference among higher and lower quartile by using this particular approach
which improves overall performance of an entity in a particular financial year.
Standard deviation
Costs of tour
Number of
customers agreed X X^2 Fx^2
500-1000 19 750 562500 10687500
1000-1500 20 1250 1562500 31250000
1500-2000 18 1750 3062500 55125000
2000-2500 15 2250 5062500 75937500
2500-3000 6 2750 7562500 45375000
3000-3500 7 3250 10562500 73937500
3500-4000 3 3750 14062500 42187500
4000-4500 2 4250 18062500 36125000
N 90 370625000
STD √(fx^2/n)
£2,030.00
Interpretation
Standard deviation is one of the measure of dispersion technique which shows the
variations in the overall data set which shows closeness with the mean value of data. The results
show that the value of standard deviation is less than compared to the mean value of data.
8
tabler-icon-diamond-filled.svg

Paraphrase This Document

Need a fresh take? Get an instant paraphrase of this document with our AI Paraphraser
Document Page
Standard deviation is £2,030 is higher than the mean of the company in terms of all the tour
packages offered by an entity to all its customers.
2.4 Explain Quartile, percentile and correlation
Quartiles
Table 1: Computing quartile
Particulars Formula Amount
Q1 N+1/4 22.75
Q3 3(N+1)/4 68.25
Interpretation
Quartile is that techniques which divides all data set into four equal parts in order to
determine the overall performance of an entity. All values of quartile are ascertained in the
absolute manner in achieving all desired aims and the objectives of the business which states that
all values of Quartile remain the same for all the questions asked by the firm to all the
respondents on whom the overall research study is based (Irani, 2010). The values of quartile are
same for all the questions which shows that an entity have not applied higher efforts in
improving the overall business conditions in an enterprise.
Percentile is revised form of Quartile in which the performance of an entity will be
determined by focusing on each and every aspects essential for maintaining the performance of
an entity are focuses by the business. All varieties of percentile are remains the same which
needs to be improved by the business enterprise in a particular financial year.
TASK 3
3.1 Produce graphs and charts
Pie chart
For the year 2014
9
Document Page
931
959
1104
713
For the year 2015
957
997
1163
769
2016
10
Document Page
1008
1035
1189
811
Interpretation
Pie chart is that tool used for the overall presentment of data which helps in showing
higher interest of different customers that helps in reflecting god performance of an entity. It has
been observed that yellow part has higher values which shows higher consent of all the
customers located in the external business market.
11
tabler-icon-diamond-filled.svg

Paraphrase This Document

Need a fresh take? Get an instant paraphrase of this document with our AI Paraphraser
Document Page
500-1000
1000-1500
1500-2000
2000-2500
2500-3000
3000-3500
3500-4000
4000-4500
0 5 10 15 20 25
Tour packages designed by customers
Number of customers agreed
Number of customers
Cost of tour
Interpretation
Bar chart presents the data in horizontal format to create strong relationship among all the
variables in order to predict the performance of all the tour packages. The consent of all the
customers are assessed on a specific parameter.
Line chart
12
Document Page
500 1000 1500 2000 2500 3000 4000 4500
0
5
10
15
20
25
Tastes and preferences of customers
Number of customers agreed
Number of customers
Cost of tour package
Interpretation
Line chart is used as visual presentation of all the collected data which help an individual
in order to interpret about the business performance (Mir and Pinnington, 2014). It can be seen
from the above data that three year performance of an entity is fluctuating from one year to
another.
13
Document Page
3.2 Create trend line
1000 1500 2000 2500 3000 3500 4000 4500
0
5
10
15
20
25
f(x) = -2.93x + 24.43
R² = 0.91
Tastes and preferences of customers
Number of customers agreed
Linear (Number of customers
agreed)
Number of customers
Cost of tour package
Interpretations
Trend line of the above figures shows the performance of an entity that its performance is
declining from higher towards the downward position. It can be said that sales is decreasing over
the period due to higher prices of products.
3.3 Prepare business presentations
3.4 Prepare formal business report
To
The director of tour operator
Date- 18th April 2017
Sub- Product development
Introduction
Tour packages are developed by an entity after considering all the features of the products along
with all the tastes and preferences of consumers takes places at the external market. The
consumer's satisfaction is the important too used by an individual for the betterment of their
business as they held liable for meeting all needs and the expectations of the external market
14
tabler-icon-diamond-filled.svg

Paraphrase This Document

Need a fresh take? Get an instant paraphrase of this document with our AI Paraphraser
Document Page
users (Ford and Richardson, 2013). This project report is emphasises on eliminating external
market competition by strengthening current performance of an entity.
Data collection
Data can be collected by the researcher after conducting appropriate research study by
satisfying all the customers or who intends to book travel service as the destinations selected an
entity are the famous tourist destinations such as Morocco, Dubai, Cuba and Turkey. The
primary research will be conducted using questionnaires and secondary research will be
organizes by seeking external market trends and records of all the consumers.
Conclusion
It can be concluded from the above assignment that higher level of customers satisfaction is
used as direct weapon in designing new tour packages of an entity in order to grab higher
market share.
TASK 4
4.1 Use appropriate information processing tools
Supplying information internally in the business as the process of raw information
internal will help in generating reliable information to be pass on to the external market in
achieving al the desired aims and the objectives in a given period. There are various information
processing tools used by the travel and tour operator in communicating all important
announcements in the prices or any external market rends to be considered in the designing of
product is given as below:
Transaction processing tools- The business transactions will be managed properly in order to
generate higher business outcomes as their main motive is to accomplish all desired aims and the
objectives in a given span of time. There are various processing systems used by an entity in
order to process all the transactions in the business is given as below:
Batch processing- Tour packages designed by an entity are processed in the singular batches in
order to facilitate the business users in determining separate costs of all the batches separately in
order to provide ultimate benefit to an entity (Ford and Richardson, 2013). The basic advantage
15
Document Page
of using approach is to consider various needs and expectations of an entity towards increasing
the overall image of an entity in front of all the customers located in the external business
environment.
Use of transaction processing systems will help in maintaining data integrity which helps
in achieving desired aims and the objectives within a given period. The performance of an entity
will get increases with the passage of time. Different measures are used by an entity in order to
process its current business information supplied to the next stage of business.
4.2 prepare project plan and determine critical path
S. No. Name of activity Activity Preceding activity Duration (in days)
1 Analysing market trend A - 11
2
Analysing about consumers and
people of country B A 14
3
Choosing business mode for
deliver products and services C B 10
4
Funding the project using different
financing sources D B, C 7
5 Create a schedule or plan E D 6
6 Implementing above prepared plan F E 5
7 Launching the new tour product G E, F 2
16
Document Page
Interpretation
Gantt chart is one of the important used in the project management which helps in
scheduling all the business activities in order to facilitate the business users by generating higher
business outcomes in the less period. The primary aim of the business is to determine the
duration of overall project which is important aspects in generating business outcomes in the
near future (Nowduri, 2011). The Gantt chart is that particular approach used in showcasing al
the activities and tasks in the chronological order that helps in generating higher outcomes over
the period for the benefit of an enterprise. Every activity is represented using bar whose position
and length reflect the beginning date of a singular activity that helps in analyzing its end date in
order to accomplish desired aims and the objectives by generating higher business outcomes in
the near future. The length of all the business activity's is declining with the passage of time
which shows that all the activities is completing in lesser period which shows the ability of a
project manager in accomplishing all the tasks by showing its good leadership in the
organization.
17
tabler-icon-diamond-filled.svg

Paraphrase This Document

Need a fresh take? Get an instant paraphrase of this document with our AI Paraphraser
Document Page
Interpretation
Critical path is that approach used by every entity as the starting of project accomplishing
all the tasks is not enough without knowing its completion time in advance as this would help in
attracting all the customers towards the tour operator's business. The customers are interested in
the business of tour operator whoever completes the tour packages within less period as
compared to all other competitors in the external market to grab higher market share and interest
of all the customers towards an entity to beat all there customers (Schulam and Saria, 2015). The
critical path determined from the above activity states that the total project completion time of
the above project is 2+3+4+5+7 that is 42 days or we can say that this particular project requires
6 weeks.
4.3 Use financial tools to test feasibility of project
Name of Tour
Initial
investment Variable cost Fixed cost Profit
Cash
flow(VC+FC)
Tour A
(Morocco) 520000 500 225000 90200 315700
Tour B
( Turkey) 475000 475 250000 100190 350665
Tour C (Cuba) 459000 775 275000 110310 386085
18
Document Page
Tour D
(Dubai) 550000 850 300000 120340 421190
Name of tour
Initial
investment Cash flow PV@9% Present value NPV
Tour A
(Morocco) 520000 315700 0.5263157895
166157.89473
6842
-
353842.10526
3158
Tour B
( Turkey) 475000 350665 0.5263157895
184560.52631
5789
-
290439.47368
4211
Tour C (Cuba) 459000 386085 0.5263157895
203202.63157
8947
-
255797.36842
1053
Tour D
(Dubai) 550000 421190 0.5263157895
221678.94736
8421
-
328321.05263
1579
Interpretation
Net present value method is regarded as non-conventional method which focuses on
evaluating profit generated by the business project in the near future for the beneficial of tour
operator who are assessing all the tour packages by analyzing their current costs on the basis of
discounting rate of 9%. This particular approach has adopted time value of money concept in
which current discounting rate is used to generate higher market returns in the near for the
beneficial of an entity as their primary motive is to accomplish desired aims and the objectives
within a give period (Indiveri and Liu, 2015). In the above technique, all return are in negative
out of which lesser negative return will be considered in which negative outcomes can be
19
Document Page
improved by shifting initial investment and the overall discounting rate. Hence, Cuba will be
taken into consideration as it has generated lesser returns in the near future.
Name of tour Initial investment Cash flow IRR
Tour A (Morocco) -520000 315700 39.29%
Tour B ( Turkey) -475000 350665 26.18%
Tour C (Cuba) -459000 386085 15.89%
Tour D (Dubai) -550000 421190 23.42%
Interpretation
Internal rate of returns termed as modern technique capital budgeting whose major aim is
to determine the overall performance of an entity in the near future. It is that rate at which the
cost incurred by the business will be generated trough the cash flows produces by a particular
project in the business which helps in selecting or rejecting a particular project for the future
purpose. It can be said that this point is regarded as break even point where business just recover
their initial costs at his particular rate (Measures of Central Tendency, 2017). Higher IRR will be
selected in comparison with the internal costs of capital as higher the rate higher will be the
business returns generated by the business in a particular year. Hence, tour packages will be
selected on the basis of IRR is Morocco as their IRR is higher as compared to all other packages
of tour.
CONCLUSION
It can be summarized from above project report that decisions plays a significant role in
the business as this improves current business conditions. This project selects best appropriate
tour packages by evaluating its feasibility by applying capital appraisal techniques like NPV and
IRR that will generate higher returns in the near future. This project report is all about assessing
statistical accuracy of all the data collected about the tour packages designed by an entity in
order to satisfy variety of needs and the expectations of the business owner. The data plan will be
created in which reliable data will be collected through using primary as well as secondary
20
tabler-icon-diamond-filled.svg

Paraphrase This Document

Need a fresh take? Get an instant paraphrase of this document with our AI Paraphraser
Document Page
research technique in order to collect important facts and figures for the beneficial of the current
aim of the research.
21
chevron_up_icon
1 out of 23
circle_padding
hide_on_mobile
zoom_out_icon
[object Object]