Business Decision Making Report: Data Analysis and Survey Findings
VerifiedAdded on 2020/07/22
|41
|5733
|92
Report
AI Summary
This report provides a comprehensive analysis of business decision-making, focusing on data collection and survey methodologies. It begins with an introduction to the importance of informed decision-making in business, followed by a detailed discussion of primary and secondary research methods, including data collection plans and sampling frameworks. The report outlines the process of questionnaire framing and presents the survey instrument used to gather data from students. The subsequent sections delve into data estimation, dispersion analysis, and the use of quartiles, percentiles, and correlations to interpret the collected data. Graphical presentations, trend lines, and a PowerPoint presentation are used to visually represent the findings, culminating in a comprehensive report on the survey results. Furthermore, the report explores information processing tools, project planning using the critical path method, and concludes with a summary of the key findings and recommendations, referencing relevant academic sources.

BUSINESS DECISION
MAKING
MAKING
Paraphrase This Document
Need a fresh take? Get an instant paraphrase of this document with our AI Paraphraser
TABLE OF CONTENTS
INTRODUCTION...........................................................................................................................1
TASK 1............................................................................................................................................1
1.1 Data collection plan..........................................................................................................1
1.2 Survey method and sampling framework.........................................................................3
1.3 Questionnaire framing......................................................................................................4
TASK 2............................................................................................................................................8
2.1 Data estimation on collected data from survey................................................................8
2.2 Data estimations on collected data...................................................................................9
2.3 Dispersion of collected data...........................................................................................10
2.4 Quartiles, percentile and correlation of collected data from survey...............................10
TASK 3..........................................................................................................................................11
3.1 Graphical presentation of collected data from survey....................................................11
3.2 Trend line for forecasting...............................................................................................16
3.3 Power point presentation of collected data.....................................................................17
3.4 Report on result from survey..........................................................................................17
TASK 4..........................................................................................................................................18
4.1 Information processing tools..........................................................................................18
4.2 Project plan and critical path method.............................................................................20
4.3.........................................................................................................................................21
CONCLUSION..............................................................................................................................21
REFERENCE.................................................................................................................................22

ILLUSTRATION INDEX
Illustration 1: Time schedule for accomplishing project plan.......................................................20
Illustration 2: Network diagram.....................................................................................................20
Illustration 3: NPV and IRR as investment appraisal techniques for decision making on
projection.......................................................................................................................................21
⊘ This is a preview!⊘
Do you want full access?
Subscribe today to unlock all pages.
Trusted by 1+ million students worldwide
INTRODUCTION
The business decision making is the most crucial part in the business as it requires
extensive research before going to make the decisions. But business have to make sure that the
firm are requires making sure that the research is done properly so that the business could run
(Cao and et.al., 2015). In the given reports, the students suggestions are required about their
experience and satisfaction. This can only be achieved by way of doing surveys and other modes
of collecting information. This is observed that the management can conduct surveys and collect
data so that the could frame the decisions effectively. Now, this also pointed out that the data
collection techniques are also needed to assess so that the management can collect the
information that are needed by the firm. However, data can be gathered via primary resources
and the secondary resources. But there is need to know about which one need to follow by the
company (Bremer, 2015).
TASK 1
1.1 Data collection plan
There is need to know the plan which are required to be produced in order to get the
information in a most effective manner. The information can be gathered to fulfil the information
needs so that the management can frame their strategy in a better way. The administration are
required to ascertain about what kind of information they want so that they can frame the
decisions. Basically there are two kinds by which data can be collected. These are primary data
and the other one is secondary data. These are explained hereunder:
Primary research: Primary resource is a tool which is done for the first time and it requires huge
resources in order to gather the information. The primary resources can be gathered by way of
doing survey, conducting interviews and any other ways. The reliability of the primary data is at
the topmost level (Gaillard, 2014). This also seen that the management make the decisions in an
effective manner so that the objectives and targets can be attained. The primary data is the
collected for the first time and it requires high degree of concentration while collecting the
information. The primary data can be gathered via telephone, interviews, conducting surveys in
the potential markets so that the intended information can be gathered. This kind of source for
collecting information requires huge capital. That is why, this can also possible in the small scale
business. Primary research is not suitable for the organisation or any association which requires
the data at a large scale.
Paraphrase This Document
Need a fresh take? Get an instant paraphrase of this document with our AI Paraphraser
Secondary Research: This is the research which is already published. Secondary data is
required in order to get the business decisions within a less amount of spending while conducting
research. The sources for conducting secondary research are books, journals and other published
information. This research is easy to gather and requires less amount while gathering the data
from this tool. The secondary research use of previous information for some other purposes and
the data is easily available. Secondary research is also recognised as a desk research. Secondary
research covers already published reports in a library, internet, or the surveys. It can also need to
cover scientific reports that were created by the medical councils, universities, and other
governmental bodies. This covers the summery, collection and synthesis of the already published
research rather than of doing primary research. However, sometimes this research technique is
required at the beginning of the research to identify what kind of data is required in order to have
the research.
The main tool is to have the raw data, for analysing, implementing and storing them, so that the
researcher would be able to ensure that the data are of high quality. But before going to gather
the data, researcher is required to face the following issues which are effectively meet. These are: Identifying on methods: There are various learnings and teaching methods that are
implemented in order to gather analyse the data (Chen, 2014). There are basically two
types of data collection techniques. Quantitative data and qualitative data collection
techniques. Quantitative data is mainly needs to focus on the numerical facts and figures
that is required to draw a valid conclusions so that the user can frame the decisions in a
better and effective manner. Frame a data collection plan: The data collection plan is started from developing the
structure of the data gathering process (Delen, 2014). This also seen that before going to
gather the data it is essential to frame the plan so the that the collected data is able to
assist in making the decisions. Under this point researcher need to know about the data
the he/she going to present. Person responsible for collecting and process the data: The data which is going to
collect, need to know about the person who is going to gather the data in order to get the
objective.
Data gathering: This is the main question which are required to be framed in order to
overlapping in the data. While gathering the data, there is a need to know about the
source from where the data can be collected or gathered, and then assess whether the
source from where the data is collected are reliable or justifiable. The researcher wants to
know about the time where the data collection process can be started. The researcher also
wants to know about the data collection period within which the data could be collected.
The cost for collecting data is also needed to assess so that the researcher can manage all
this. In this data gathering process, there is need to know about the individual who is
going to collect the data.
By considering primary and secondary resources, researcher would plan the survey that
he is going to entertain for getting the relevant data from the general public so that the survey
would be be convened effectively. There is a need to make certain arrangement in their research
survey and makes efforts in order to have effective survey. Under this plan, researcher will use
both of the data collection method for gathering the data from students from diverse streams.
1.2 Survey method and sampling framework
Survey is the method which is usually used in order to gather information and in this
manner, information is gathered by young generation about their enrolment and number of
satisfaction. For making the report, it is required that the primary research are required to be
conducted which will assist for making the research. There are so many kinds of research
methodologies and samplings which have been emerged with the assistance of the research
project. Some of them have been mentioned hereunder: Survey methodologies: This is most essential as that the representatives of the college to
identify what might be the view, behaviour and perception of entire students which
represents the UKCBC college (Goodall, 2014). Before going to convene the research, it
will be need to determine the students from whom the information can be gathered.
Under this case, they are the students which are studying in the cited college. The most
important aim for which the research is convened is the gathering of the concerned
information and for that it would be needed that entire powerful strategies which should
be considered. In the research methodology, there are so many research methodology
there are so many aspects which are needed to be discussed and they are investigated
below:
⊘ This is a preview!⊘
Do you want full access?
Subscribe today to unlock all pages.
Trusted by 1+ million students worldwide
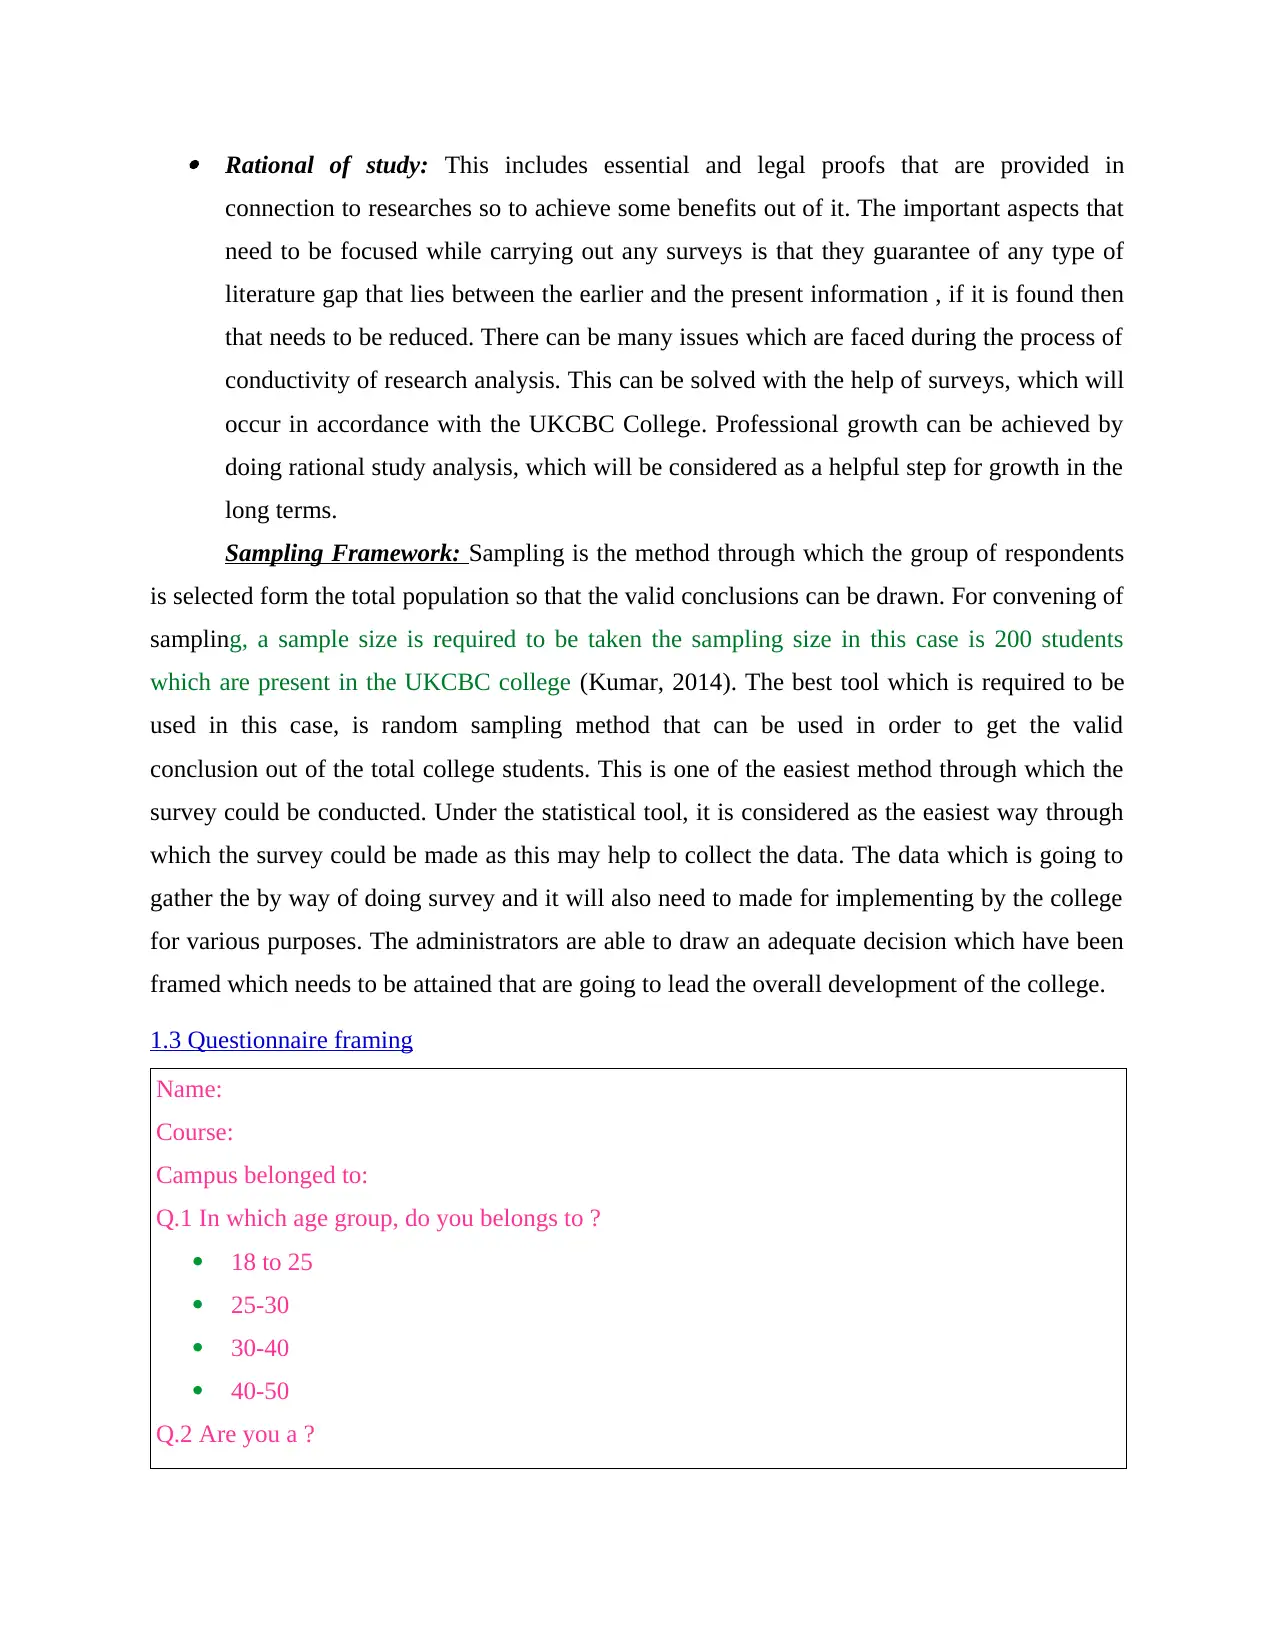
Rational of study: This includes essential and legal proofs that are provided in
connection to researches so to achieve some benefits out of it. The important aspects that
need to be focused while carrying out any surveys is that they guarantee of any type of
literature gap that lies between the earlier and the present information , if it is found then
that needs to be reduced. There can be many issues which are faced during the process of
conductivity of research analysis. This can be solved with the help of surveys, which will
occur in accordance with the UKCBC College. Professional growth can be achieved by
doing rational study analysis, which will be considered as a helpful step for growth in the
long terms.
Sampling Framework: Sampling is the method through which the group of respondents
is selected form the total population so that the valid conclusions can be drawn. For convening of
sampling, a sample size is required to be taken the sampling size in this case is 200 students
which are present in the UKCBC college (Kumar, 2014). The best tool which is required to be
used in this case, is random sampling method that can be used in order to get the valid
conclusion out of the total college students. This is one of the easiest method through which the
survey could be conducted. Under the statistical tool, it is considered as the easiest way through
which the survey could be made as this may help to collect the data. The data which is going to
gather the by way of doing survey and it will also need to made for implementing by the college
for various purposes. The administrators are able to draw an adequate decision which have been
framed which needs to be attained that are going to lead the overall development of the college.
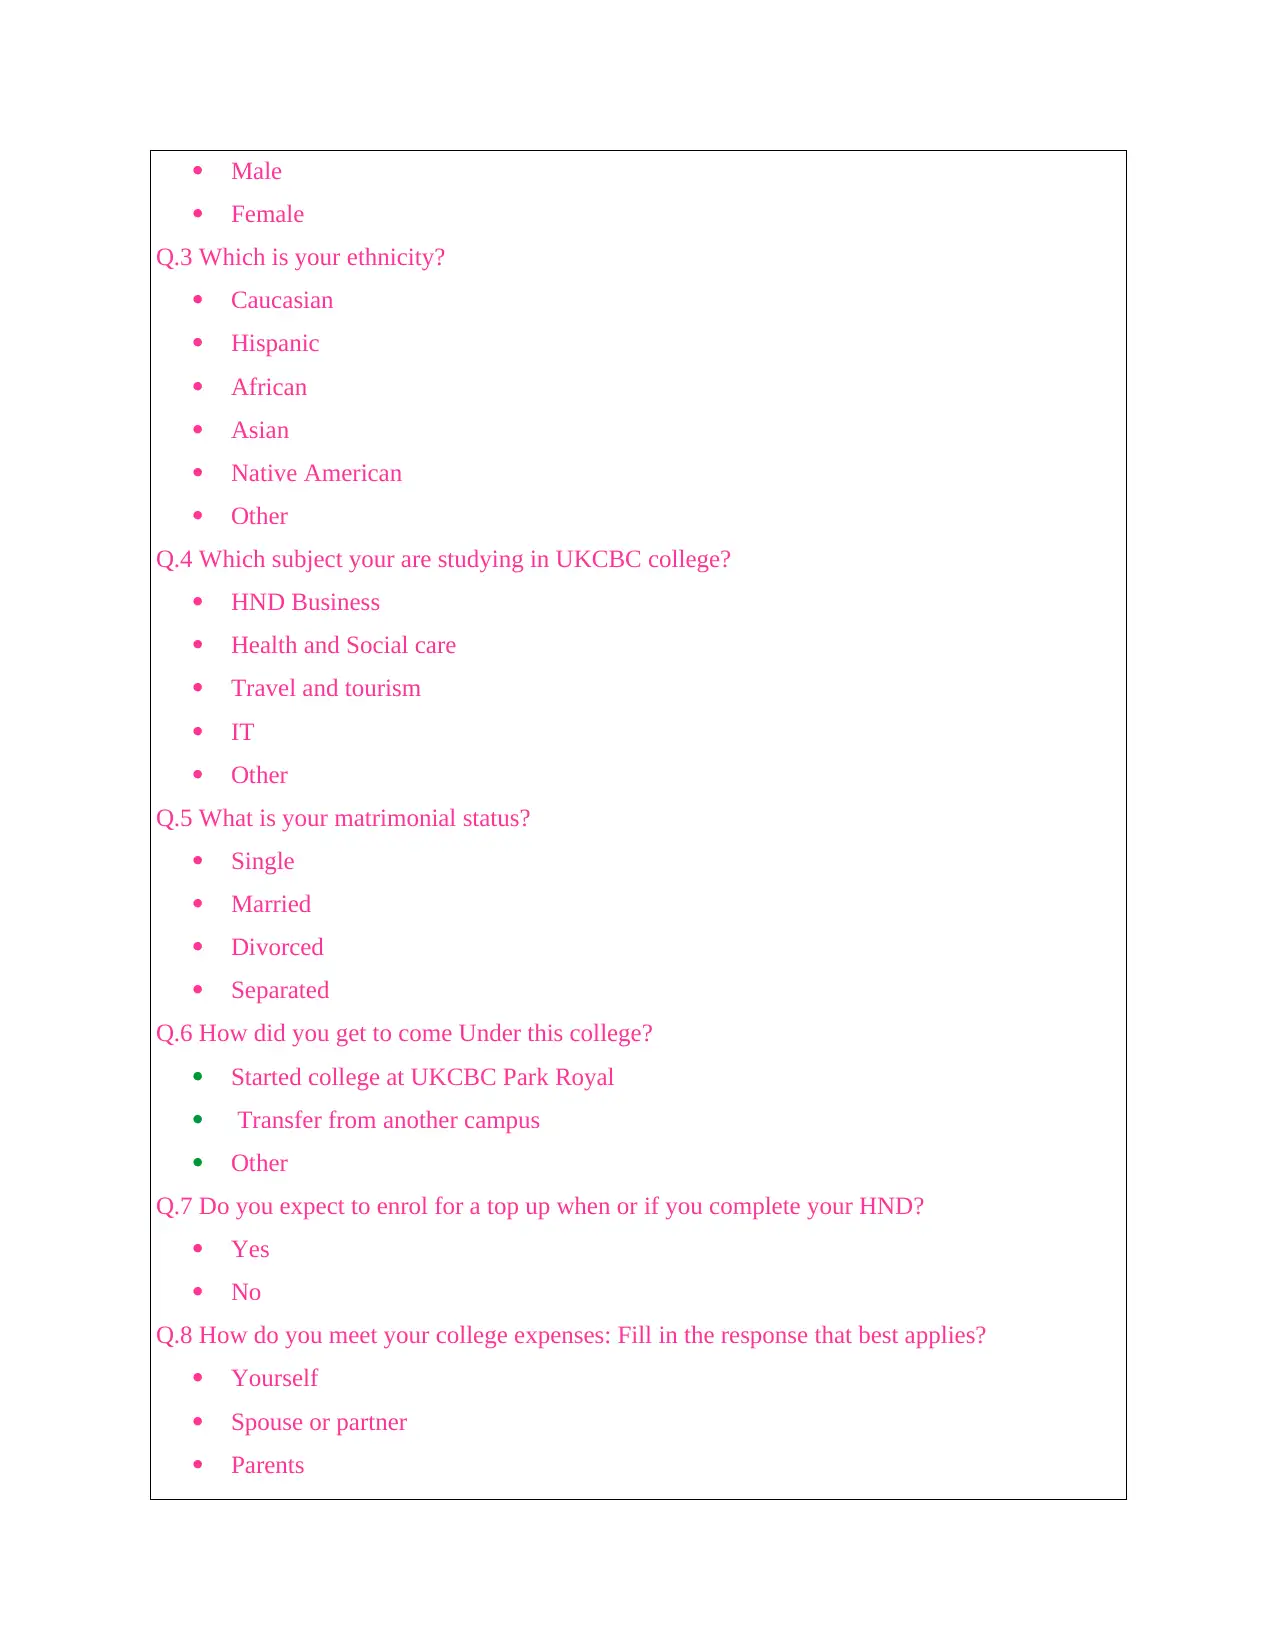
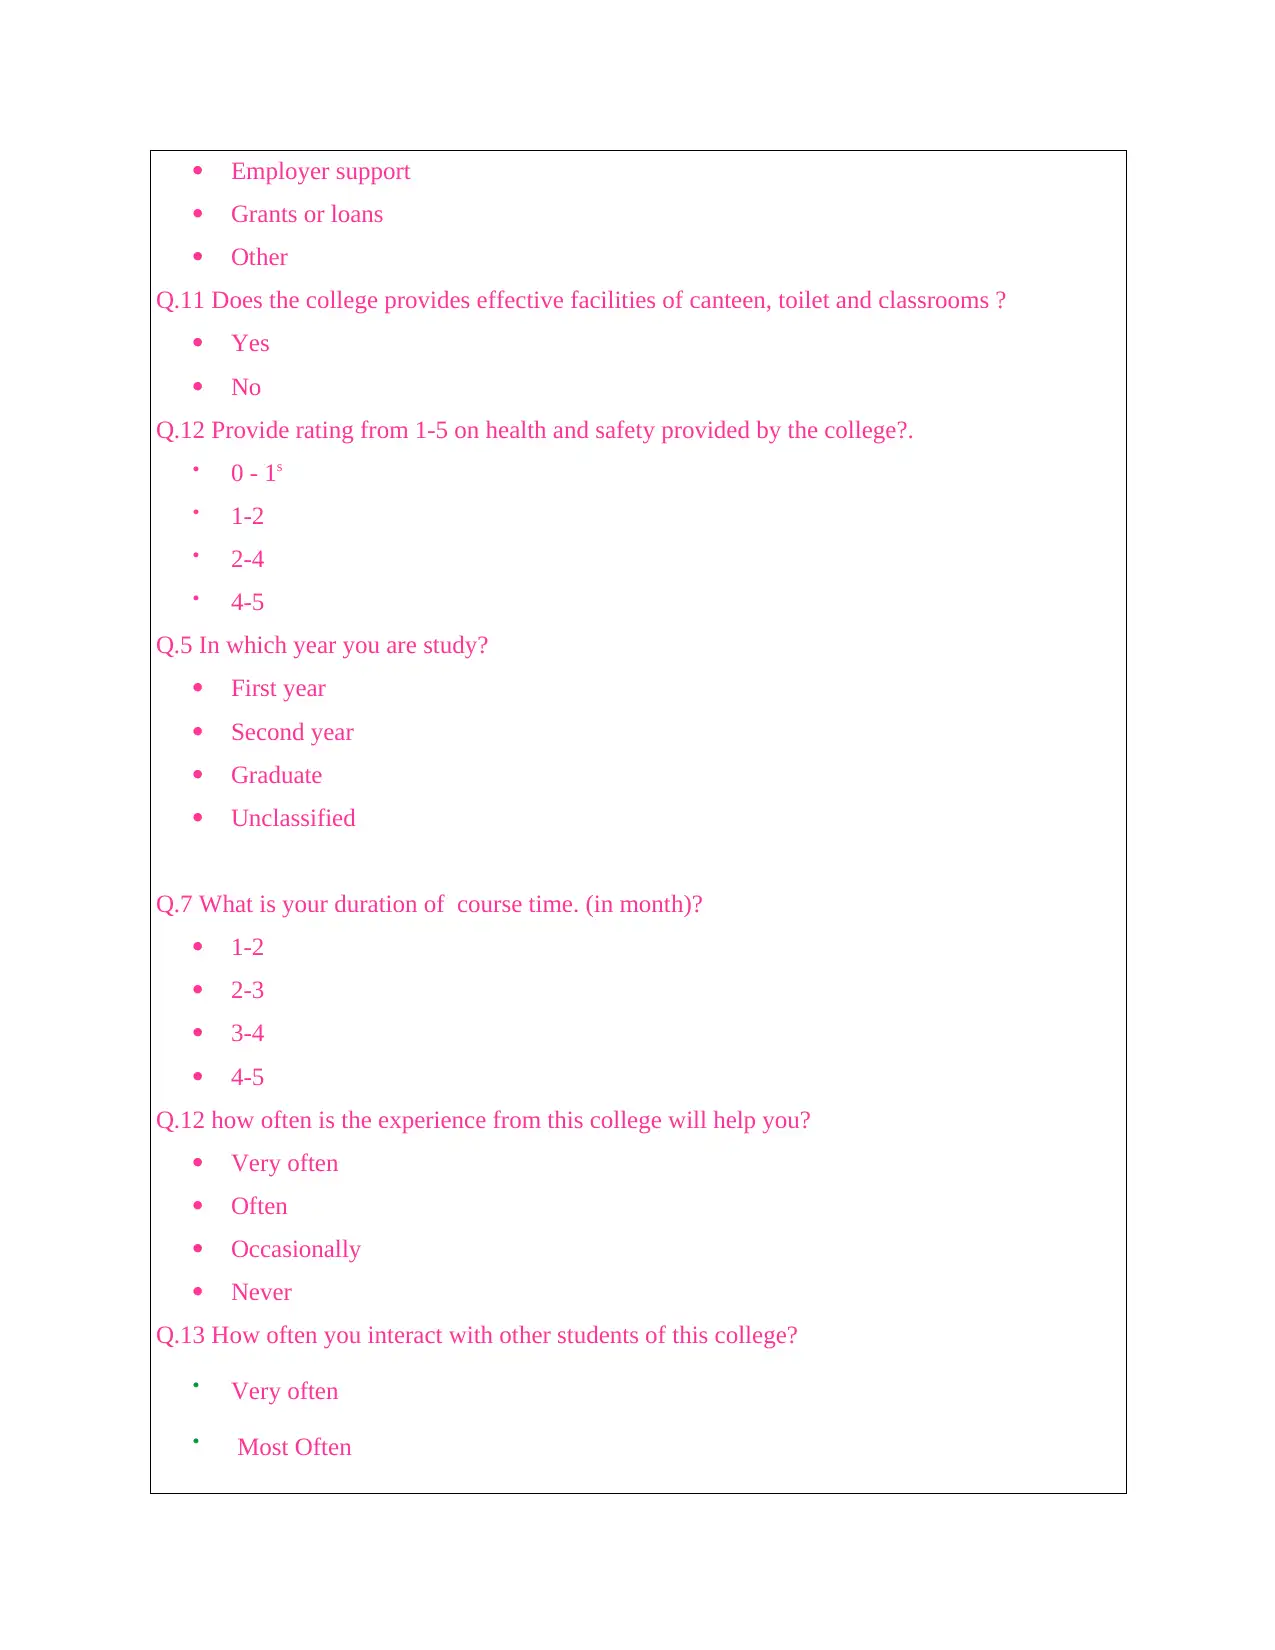
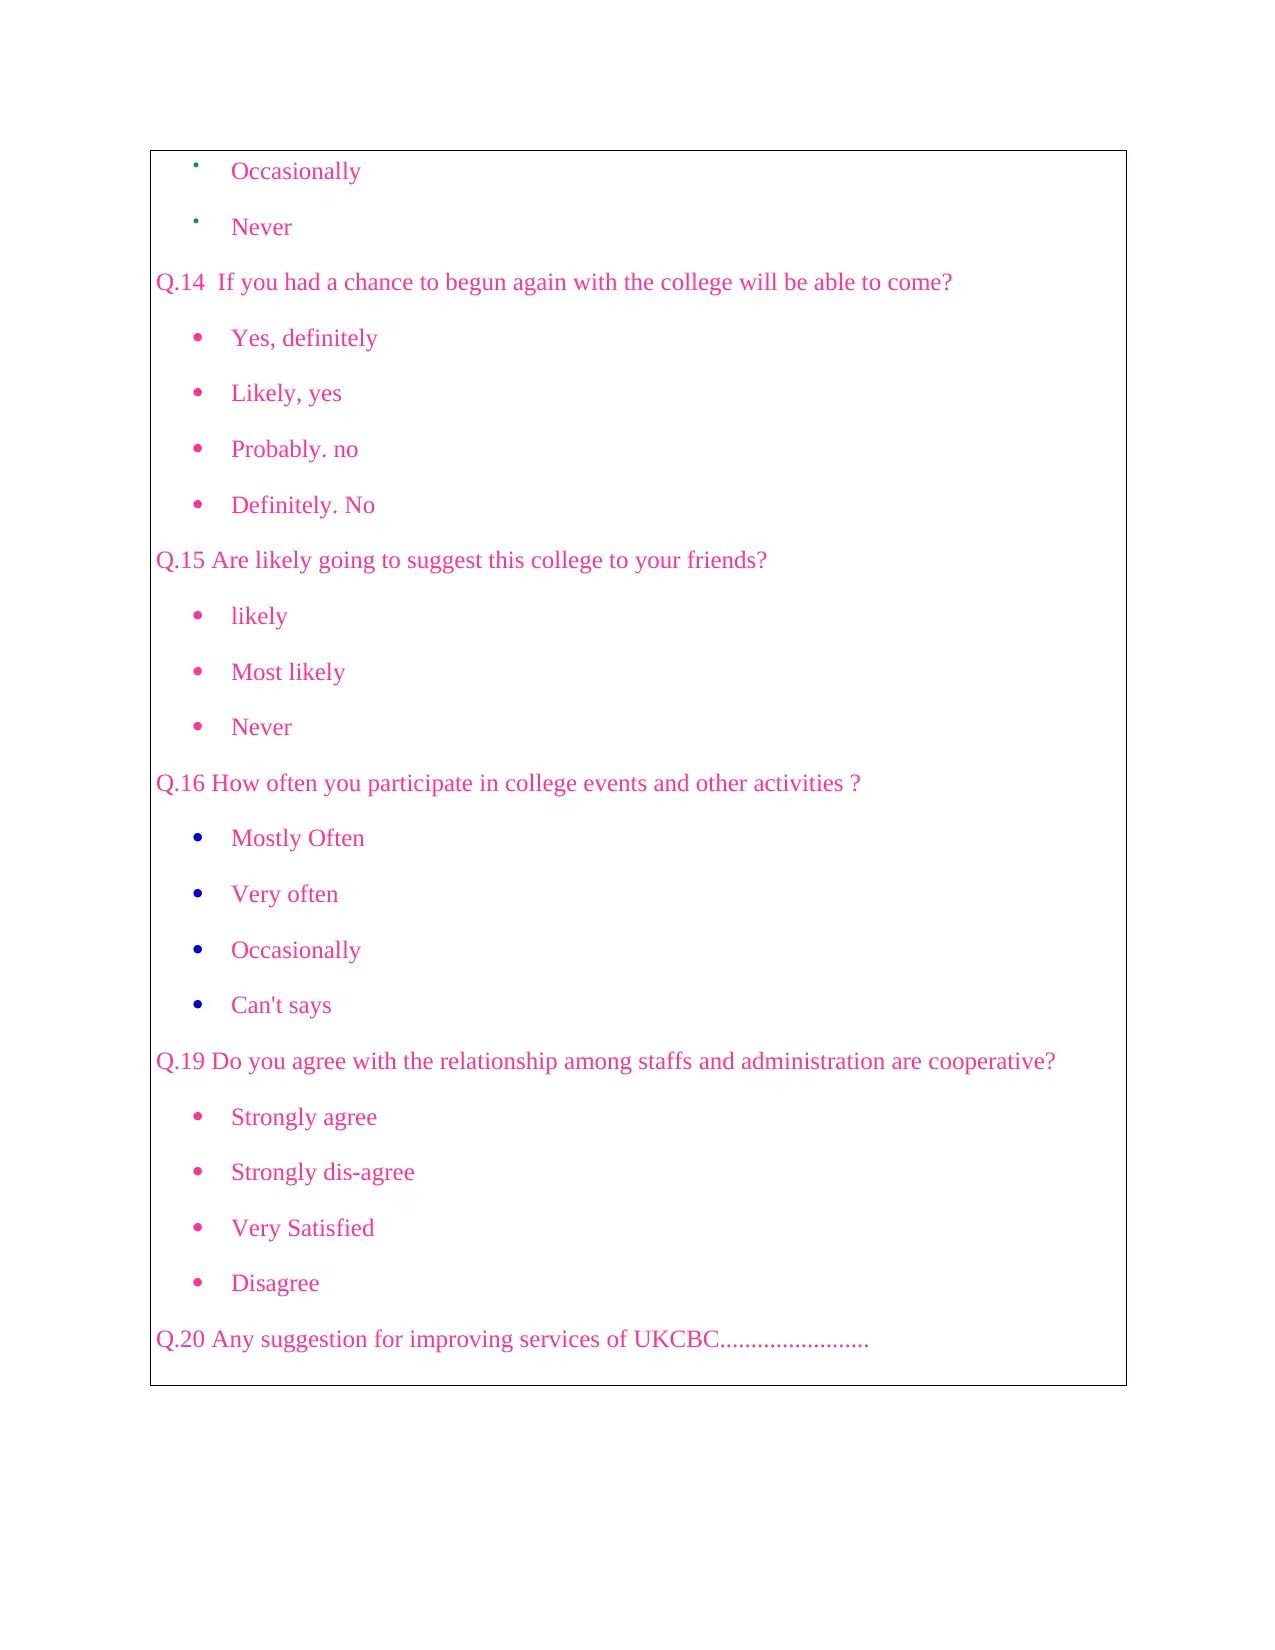
1.3 Questionnaire framing
Name:
Course:
Campus belonged to:
Q.1 In which age group, do you belongs to ?
18 to 25
25-30
30-40
40-50
Q.2 Are you a ?
connection to researches so to achieve some benefits out of it. The important aspects that
need to be focused while carrying out any surveys is that they guarantee of any type of
literature gap that lies between the earlier and the present information , if it is found then
that needs to be reduced. There can be many issues which are faced during the process of
conductivity of research analysis. This can be solved with the help of surveys, which will
occur in accordance with the UKCBC College. Professional growth can be achieved by
doing rational study analysis, which will be considered as a helpful step for growth in the
long terms.
Sampling Framework: Sampling is the method through which the group of respondents
is selected form the total population so that the valid conclusions can be drawn. For convening of
sampling, a sample size is required to be taken the sampling size in this case is 200 students
which are present in the UKCBC college (Kumar, 2014). The best tool which is required to be
used in this case, is random sampling method that can be used in order to get the valid
conclusion out of the total college students. This is one of the easiest method through which the
survey could be conducted. Under the statistical tool, it is considered as the easiest way through
which the survey could be made as this may help to collect the data. The data which is going to
gather the by way of doing survey and it will also need to made for implementing by the college
for various purposes. The administrators are able to draw an adequate decision which have been
framed which needs to be attained that are going to lead the overall development of the college.
1.3 Questionnaire framing
Name:
Course:
Campus belonged to:
Q.1 In which age group, do you belongs to ?
18 to 25
25-30
30-40
40-50
Q.2 Are you a ?
Paraphrase This Document
Need a fresh take? Get an instant paraphrase of this document with our AI Paraphraser
Male
Female
Q.3 Which is your ethnicity?
Caucasian
Hispanic
African
Asian
Native American
Other
Q.4 Which subject your are studying in UKCBC college?
HND Business
Health and Social care
Travel and tourism
IT
Other
Q.5 What is your matrimonial status?
Single
Married
Divorced
Separated
Q.6 How did you get to come Under this college?
Started college at UKCBC Park Royal
Transfer from another campus
Other
Q.7 Do you expect to enrol for a top up when or if you complete your HND?
Yes
No
Q.8 How do you meet your college expenses: Fill in the response that best applies?
Yourself
Spouse or partner
Parents
Employer support
Grants or loans
Other
Q.11 Does the college provides effective facilities of canteen, toilet and classrooms ?
Yes
No
Q.12 Provide rating from 1-5 on health and safety provided by the college?.
0 - 1s
1-2
2-4
4-5
Q.5 In which year you are study?
First year
Second year
Graduate
Unclassified
Q.7 What is your duration of course time. (in month)?
1-2
2-3
3-4
4-5
Q.12 how often is the experience from this college will help you?
Very often
Often
Occasionally
Never
Q.13 How often you interact with other students of this college?
Very often
Most Often
⊘ This is a preview!⊘
Do you want full access?
Subscribe today to unlock all pages.
Trusted by 1+ million students worldwide
Occasionally
Never
Q.14 If you had a chance to begun again with the college will be able to come?
Yes, definitely
Likely, yes
Probably. no
Definitely. No
Q.15 Are likely going to suggest this college to your friends?
likely
Most likely
Never
Q.16 How often you participate in college events and other activities ?
Mostly Often
Very often
Occasionally
Can't says
Q.19 Do you agree with the relationship among staffs and administration are cooperative?
Strongly agree
Strongly dis-agree
Very Satisfied
Disagree
Q.20 Any suggestion for improving services of UKCBC........................
Never
Q.14 If you had a chance to begun again with the college will be able to come?
Yes, definitely
Likely, yes
Probably. no
Definitely. No
Q.15 Are likely going to suggest this college to your friends?
likely
Most likely
Never
Q.16 How often you participate in college events and other activities ?
Mostly Often
Very often
Occasionally
Can't says
Q.19 Do you agree with the relationship among staffs and administration are cooperative?
Strongly agree
Strongly dis-agree
Very Satisfied
Disagree
Q.20 Any suggestion for improving services of UKCBC........................
Paraphrase This Document
Need a fresh take? Get an instant paraphrase of this document with our AI Paraphraser
TASK 2
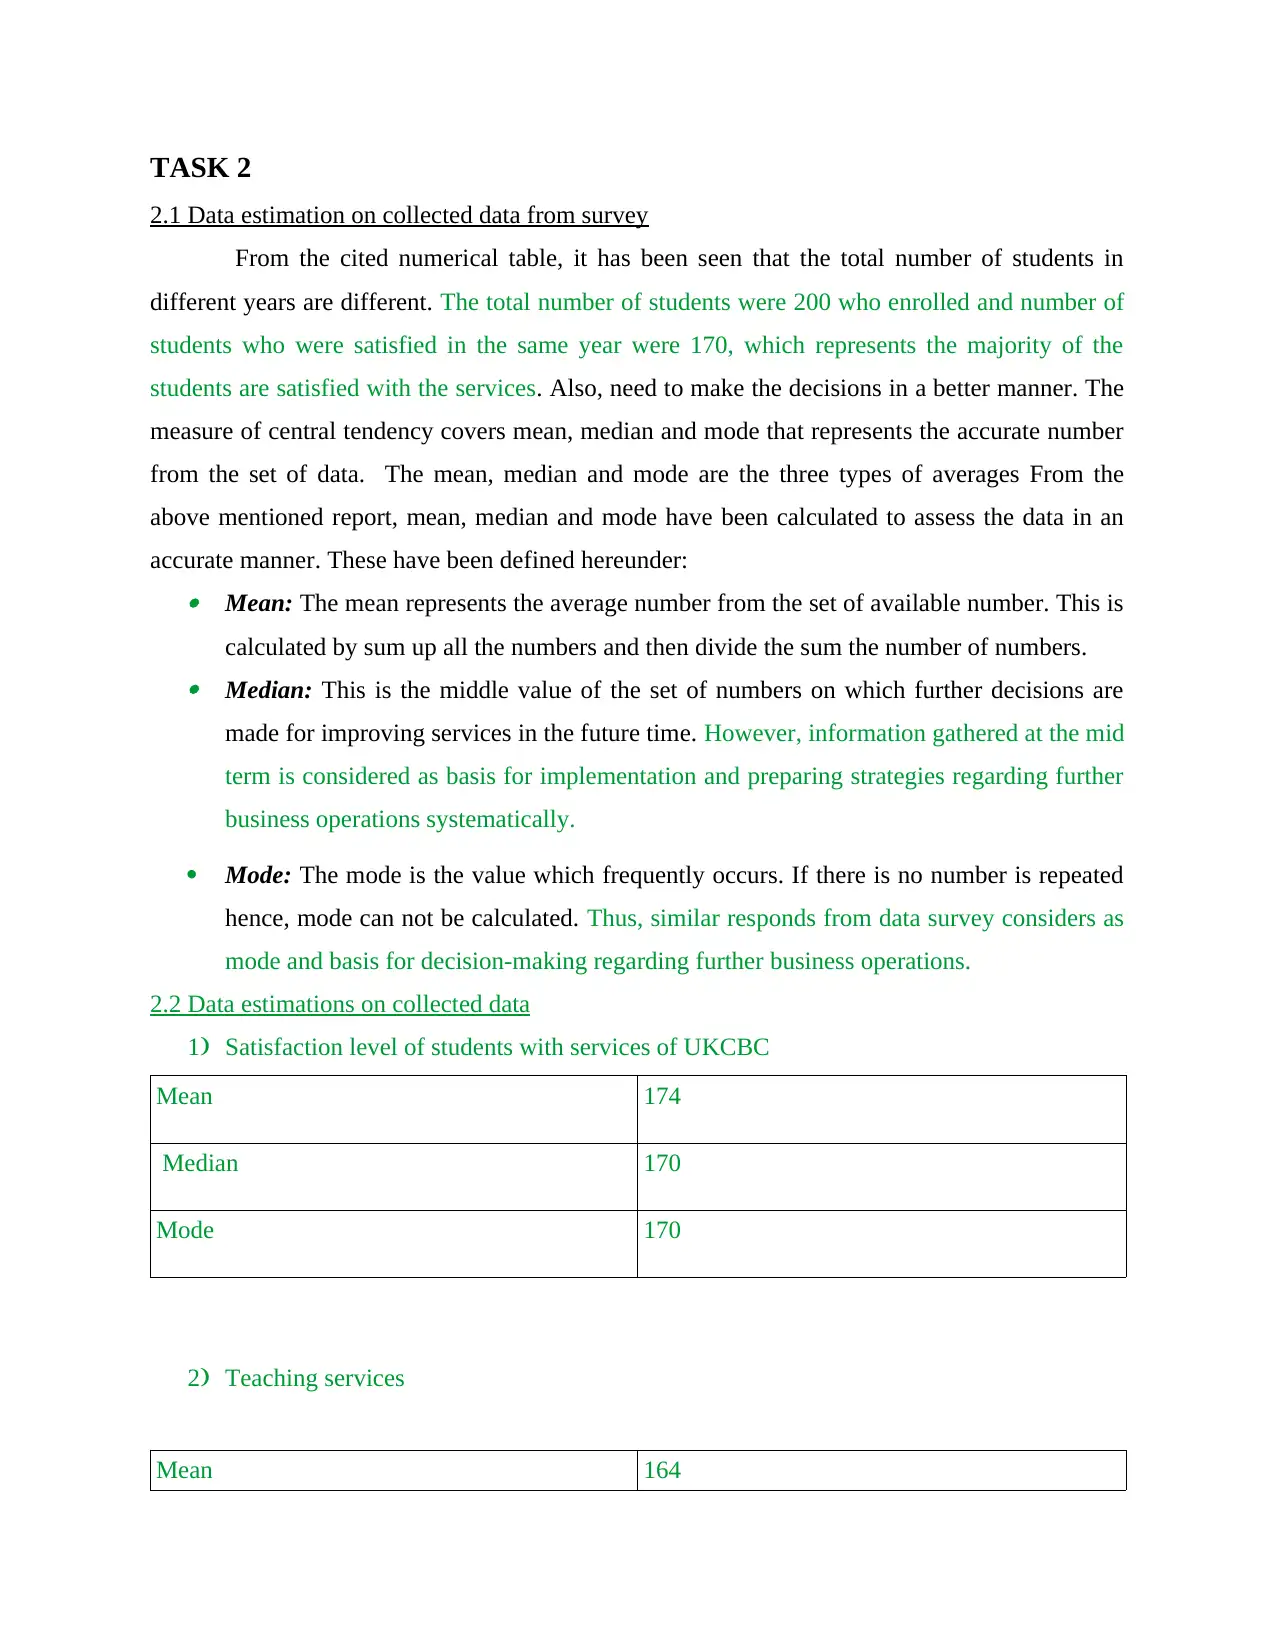
2.1 Data estimation on collected data from survey
From the cited numerical table, it has been seen that the total number of students in
different years are different. The total number of students were 200 who enrolled and number of
students who were satisfied in the same year were 170, which represents the majority of the
students are satisfied with the services. Also, need to make the decisions in a better manner. The
measure of central tendency covers mean, median and mode that represents the accurate number
from the set of data. The mean, median and mode are the three types of averages From the
above mentioned report, mean, median and mode have been calculated to assess the data in an
accurate manner. These have been defined hereunder: Mean: The mean represents the average number from the set of available number. This is
calculated by sum up all the numbers and then divide the sum the number of numbers. Median: This is the middle value of the set of numbers on which further decisions are
made for improving services in the future time. However, information gathered at the mid
term is considered as basis for implementation and preparing strategies regarding further
business operations systematically.
Mode: The mode is the value which frequently occurs. If there is no number is repeated
hence, mode can not be calculated. Thus, similar responds from data survey considers as
mode and basis for decision-making regarding further business operations.
2.2 Data estimations on collected data
1) Satisfaction level of students with services of UKCBC
Mean 174
Median 170
Mode 170
2) Teaching services
Mean 164
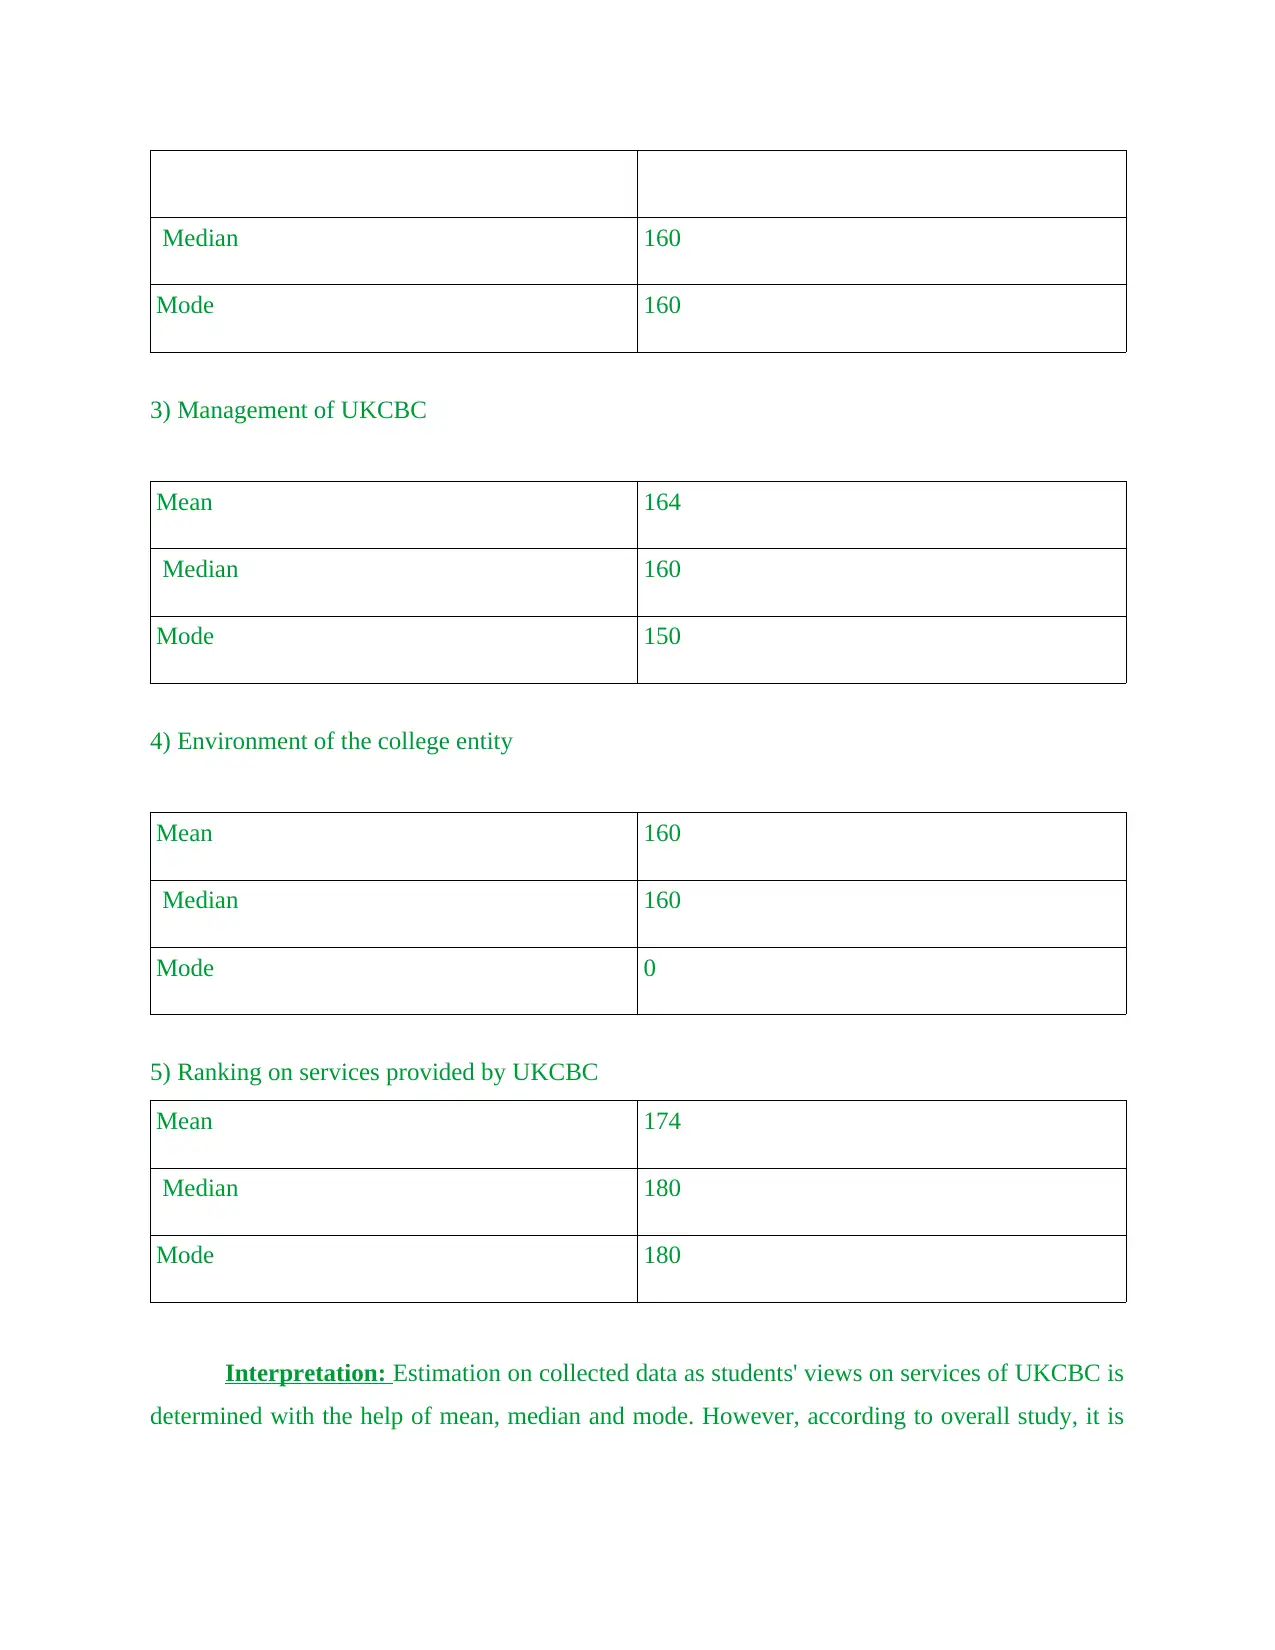
Median 160
Mode 160
3) Management of UKCBC
Mean 164
Median 160
Mode 150
4) Environment of the college entity
Mean 160
Median 160
Mode 0
5) Ranking on services provided by UKCBC
Mean 174
Median 180
Mode 180
Interpretation: Estimation on collected data as students' views on services of UKCBC is
determined with the help of mean, median and mode. However, according to overall study, it is
⊘ This is a preview!⊘
Do you want full access?
Subscribe today to unlock all pages.
Trusted by 1+ million students worldwide
1 out of 41
Related Documents


Your All-in-One AI-Powered Toolkit for Academic Success.
+13062052269
info@desklib.com
Available 24*7 on WhatsApp / Email
![[object Object]](/_next/static/media/star-bottom.7253800d.svg)
Unlock your academic potential
Copyright © 2020–2026 A2Z Services. All Rights Reserved. Developed and managed by ZUCOL.