Business Decision Making Report: Data Analysis, Survey, and Investment
VerifiedAdded on 2020/06/03
|24
|4911
|484
Report
AI Summary
This report provides a detailed analysis of business decision-making processes, focusing on a case study of Excellent School Education Plc, which is planning to open a new branch. The report covers the creation of plans for collecting primary and secondary data, including survey methodologies and questionnaire design. It delves into data estimation tools, calculating mean, median, mode, dispersion, and quartiles. Furthermore, the report includes the creation of graphs using spreadsheets, scatter graphs, and line charts to visualize data related to age and weight. Finally, it explores investment appraisal methods, including NPV and IRR calculations, and presents a project plan for a hypothetical company, Speedy Filters Plc. The report aims to equip readers with the knowledge and tools to make effective business decisions through data-driven analysis and strategic planning.

BUSINESS DECISION
MAKING
MAKING
Paraphrase This Document
Need a fresh take? Get an instant paraphrase of this document with our AI Paraphraser
TABLE OF CONTENTS
INTRODUCTION...........................................................................................................................1
TASK 1............................................................................................................................................1
1.1Creation of plan for collection of primary and secondary data for a given business
problem...................................................................................................................................1
1.2 Survey methodology and use of sampling frame.............................................................2
1.3 Questionnaire for a business problem..............................................................................3
TASK 2............................................................................................................................................4
2.1 Data estimation tools........................................................................................................4
2.2 Mean, median and mode of collected data.......................................................................6
2.3 Dispersion of collected data.............................................................................................6
2.4 Quartiles and coefficient of the data.................................................................................7
TASK 3............................................................................................................................................9
3.1 Produce the graph using Spreadsheet and draw valid conclusion....................................9
3.2 Producing scatter graphs through considering data of age and weight..........................12
3.3 Preparinmg line chart using the data set of age and weight...........................................13
TASK 4..........................................................................................................................................14
4.1 Investment appraisal methods and their advantages & disadvantages...........................14
4.2 Project plan for Speedy Filters Plc.................................................................................15
4.3 Estimation of NPV & IRR for the proposed project......................................................18
CONCLUSION..............................................................................................................................19
REFERENCES..............................................................................................................................20
Index of Tables
Table 1: Data estimation on collected data......................................................................................2
Table 2: SD and Variance analysis of collected data.......................................................................3
Table 3: Quartiles of collected data.................................................................................................4
Table 4: Correlation between admissions and profit at LBBA........................................................4
⊘ This is a preview!⊘
Do you want full access?
Subscribe today to unlock all pages.
Trusted by 1+ million students worldwide

ILLUSTRATION INDEX
Illustration 1: Formula used for calculating mean...........................................................................1
Illustration 2: Median for odd number of respondents....................................................................2
Illustration 3: Standard deviation measurement..............................................................................3
Paraphrase This Document
Need a fresh take? Get an instant paraphrase of this document with our AI Paraphraser
INTRODUCTION
Business decision making is considered as an important aspect that is needed in
appropriate and full consideration so that no problems in this regards can occur in future (Ford
and Richardson, 2013). The main objective behind this report to develop techniques for the data
gathering and implantation about the business perspective, also gaining an understanding of the
tools which are available for creation and presentation of useful information in order to make
effective business decisions. A case of Excellent School Education Plc is taken in to
consideration which is a private school in North London for students from affluent back grounds
and achieved best results of its input. Thus, they want to open a new branch of school in Surrey
for which is business decision is being made. Further, there are various important methods have
been used by researcher to determine the opportunities for enterprise to expand their business
operations.
TASK 1
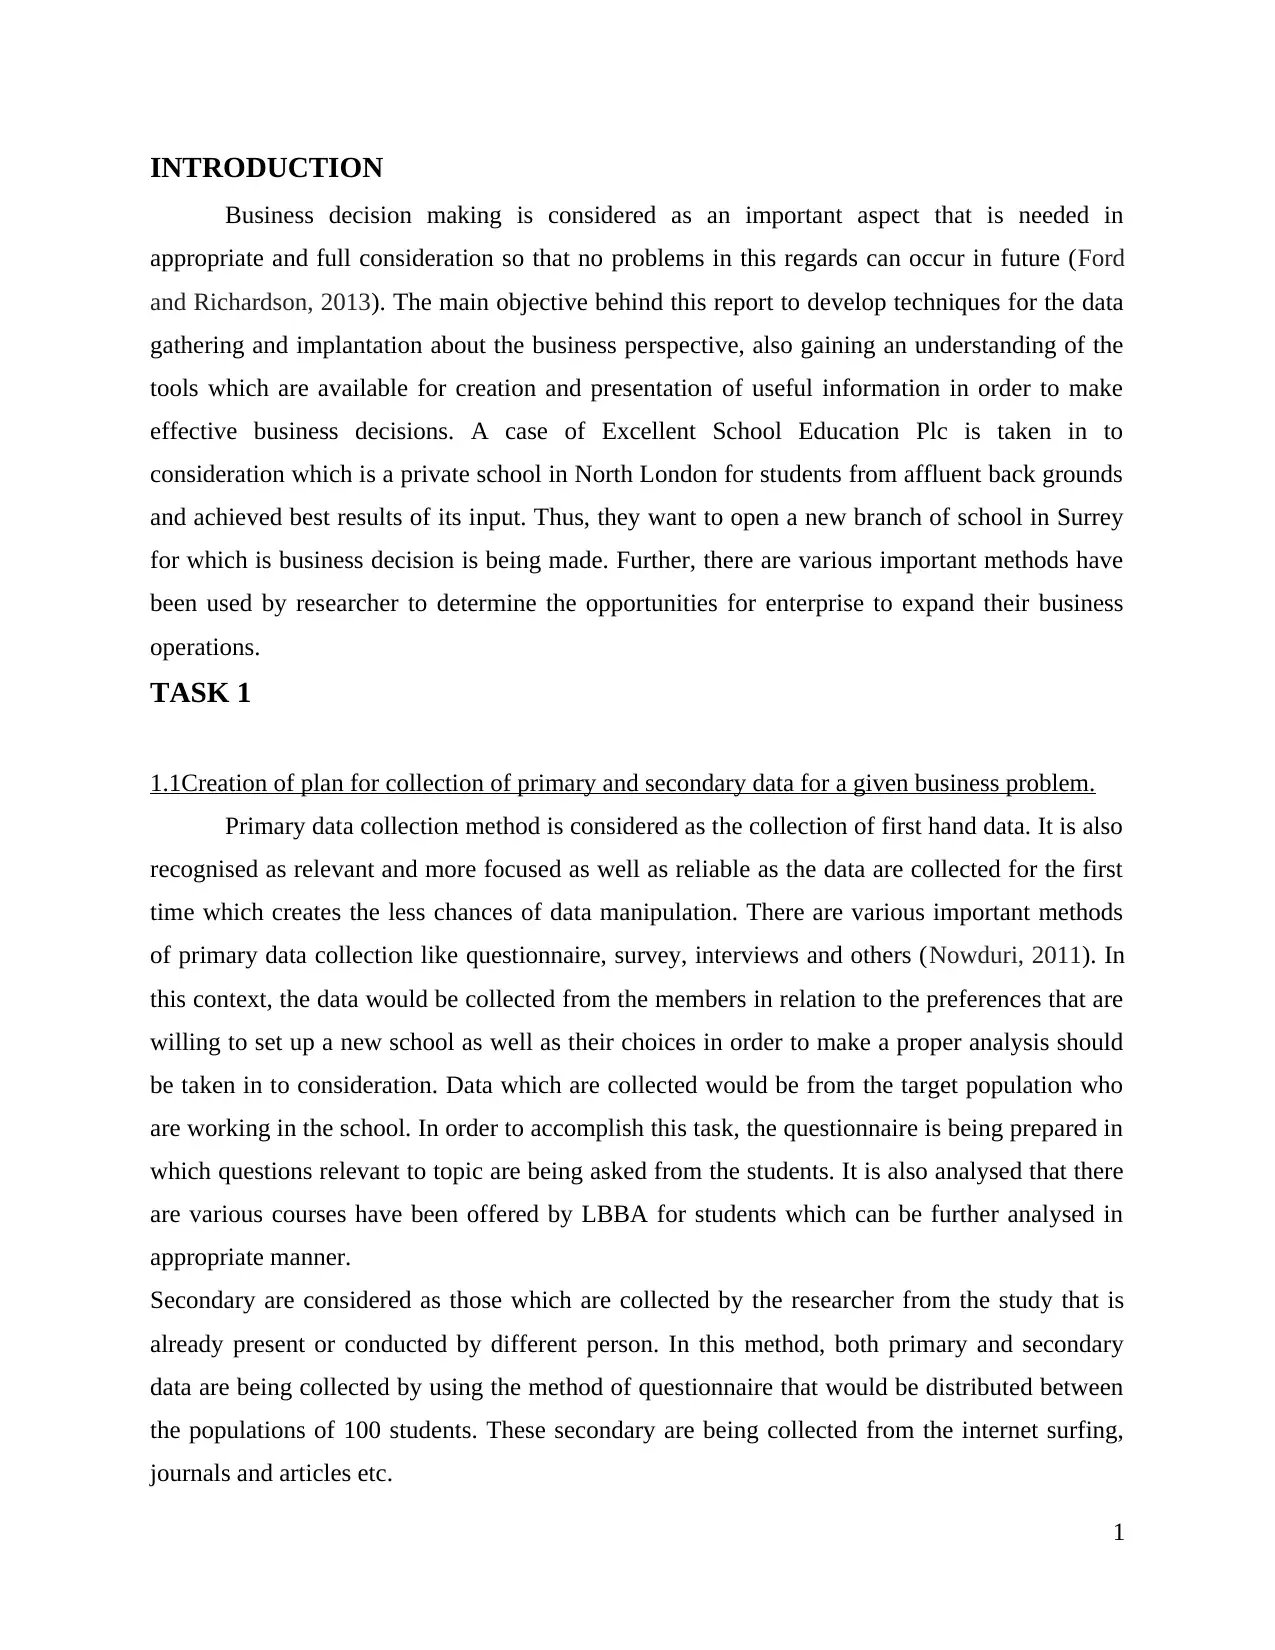
1.1Creation of plan for collection of primary and secondary data for a given business problem.
Primary data collection method is considered as the collection of first hand data. It is also
recognised as relevant and more focused as well as reliable as the data are collected for the first
time which creates the less chances of data manipulation. There are various important methods
of primary data collection like questionnaire, survey, interviews and others (Nowduri, 2011). In
this context, the data would be collected from the members in relation to the preferences that are
willing to set up a new school as well as their choices in order to make a proper analysis should
be taken in to consideration. Data which are collected would be from the target population who
are working in the school. In order to accomplish this task, the questionnaire is being prepared in
which questions relevant to topic are being asked from the students. It is also analysed that there
are various courses have been offered by LBBA for students which can be further analysed in
appropriate manner.
Secondary are considered as those which are collected by the researcher from the study that is
already present or conducted by different person. In this method, both primary and secondary
data are being collected by using the method of questionnaire that would be distributed between
the populations of 100 students. These secondary are being collected from the internet surfing,
journals and articles etc.
1
Business decision making is considered as an important aspect that is needed in
appropriate and full consideration so that no problems in this regards can occur in future (Ford
and Richardson, 2013). The main objective behind this report to develop techniques for the data
gathering and implantation about the business perspective, also gaining an understanding of the
tools which are available for creation and presentation of useful information in order to make
effective business decisions. A case of Excellent School Education Plc is taken in to
consideration which is a private school in North London for students from affluent back grounds
and achieved best results of its input. Thus, they want to open a new branch of school in Surrey
for which is business decision is being made. Further, there are various important methods have
been used by researcher to determine the opportunities for enterprise to expand their business
operations.
TASK 1
1.1Creation of plan for collection of primary and secondary data for a given business problem.
Primary data collection method is considered as the collection of first hand data. It is also
recognised as relevant and more focused as well as reliable as the data are collected for the first
time which creates the less chances of data manipulation. There are various important methods
of primary data collection like questionnaire, survey, interviews and others (Nowduri, 2011). In
this context, the data would be collected from the members in relation to the preferences that are
willing to set up a new school as well as their choices in order to make a proper analysis should
be taken in to consideration. Data which are collected would be from the target population who
are working in the school. In order to accomplish this task, the questionnaire is being prepared in
which questions relevant to topic are being asked from the students. It is also analysed that there
are various courses have been offered by LBBA for students which can be further analysed in
appropriate manner.
Secondary are considered as those which are collected by the researcher from the study that is
already present or conducted by different person. In this method, both primary and secondary
data are being collected by using the method of questionnaire that would be distributed between
the populations of 100 students. These secondary are being collected from the internet surfing,
journals and articles etc.
1
Plan for the collection of all the required data-
In this research, all the primary data are collected from the methods of questionnaire
which will be distributed among the sample population of 100 people in order gathered correct
and relevant information. It being estimated that all the required data would be collected in the
period of 10 days, so that its analysis and interpretation can be presented in suitable manner.
Further, appropriate method of sampling is being used to so that no extra efforts are needed to be
made by the researcher in implementation of plan.
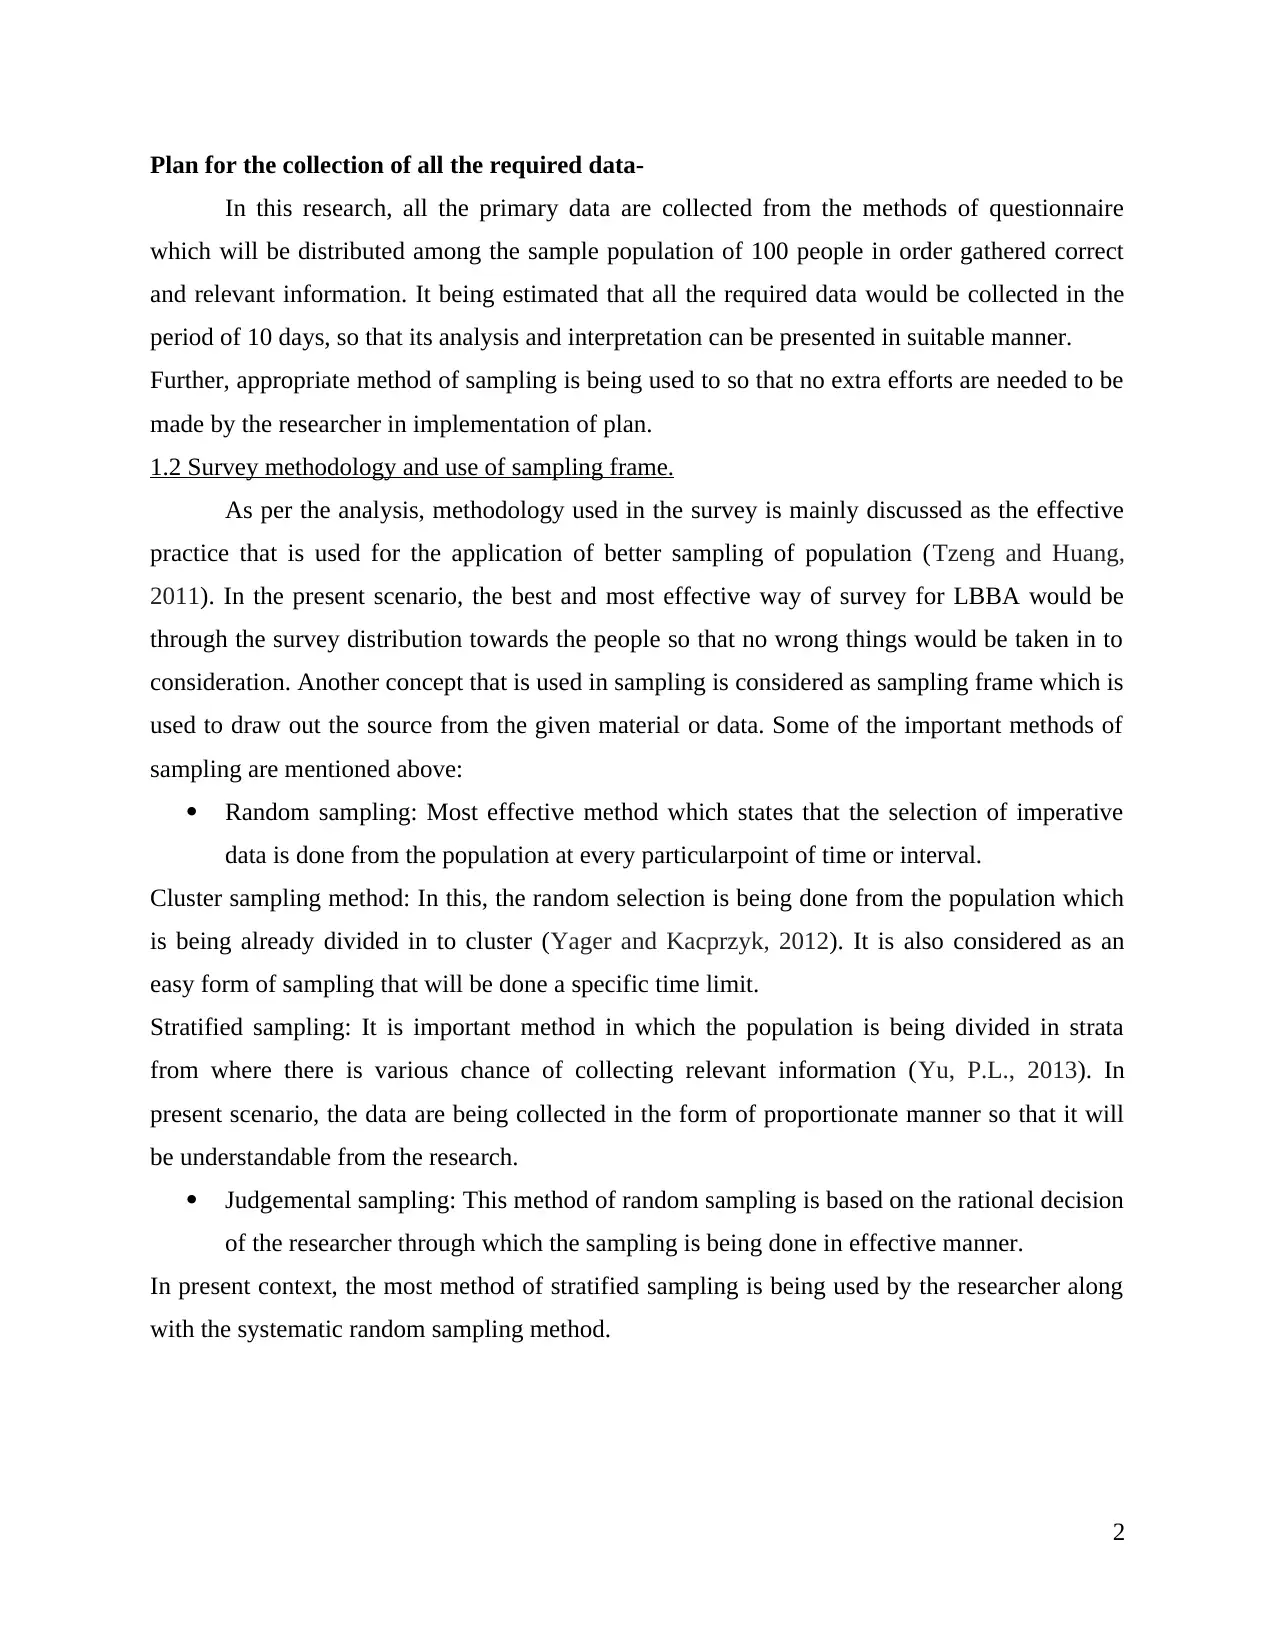
1.2 Survey methodology and use of sampling frame.
As per the analysis, methodology used in the survey is mainly discussed as the effective
practice that is used for the application of better sampling of population (Tzeng and Huang,
2011). In the present scenario, the best and most effective way of survey for LBBA would be
through the survey distribution towards the people so that no wrong things would be taken in to
consideration. Another concept that is used in sampling is considered as sampling frame which is
used to draw out the source from the given material or data. Some of the important methods of
sampling are mentioned above:
Random sampling: Most effective method which states that the selection of imperative
data is done from the population at every particularpoint of time or interval.
Cluster sampling method: In this, the random selection is being done from the population which
is being already divided in to cluster (Yager and Kacprzyk, 2012). It is also considered as an
easy form of sampling that will be done a specific time limit.
Stratified sampling: It is important method in which the population is being divided in strata
from where there is various chance of collecting relevant information (Yu, P.L., 2013). In
present scenario, the data are being collected in the form of proportionate manner so that it will
be understandable from the research.
Judgemental sampling: This method of random sampling is based on the rational decision
of the researcher through which the sampling is being done in effective manner.
In present context, the most method of stratified sampling is being used by the researcher along
with the systematic random sampling method.
2
In this research, all the primary data are collected from the methods of questionnaire
which will be distributed among the sample population of 100 people in order gathered correct
and relevant information. It being estimated that all the required data would be collected in the
period of 10 days, so that its analysis and interpretation can be presented in suitable manner.
Further, appropriate method of sampling is being used to so that no extra efforts are needed to be
made by the researcher in implementation of plan.
1.2 Survey methodology and use of sampling frame.
As per the analysis, methodology used in the survey is mainly discussed as the effective
practice that is used for the application of better sampling of population (Tzeng and Huang,
2011). In the present scenario, the best and most effective way of survey for LBBA would be
through the survey distribution towards the people so that no wrong things would be taken in to
consideration. Another concept that is used in sampling is considered as sampling frame which is
used to draw out the source from the given material or data. Some of the important methods of
sampling are mentioned above:
Random sampling: Most effective method which states that the selection of imperative
data is done from the population at every particularpoint of time or interval.
Cluster sampling method: In this, the random selection is being done from the population which
is being already divided in to cluster (Yager and Kacprzyk, 2012). It is also considered as an
easy form of sampling that will be done a specific time limit.
Stratified sampling: It is important method in which the population is being divided in strata
from where there is various chance of collecting relevant information (Yu, P.L., 2013). In
present scenario, the data are being collected in the form of proportionate manner so that it will
be understandable from the research.
Judgemental sampling: This method of random sampling is based on the rational decision
of the researcher through which the sampling is being done in effective manner.
In present context, the most method of stratified sampling is being used by the researcher along
with the systematic random sampling method.
2
⊘ This is a preview!⊘
Do you want full access?
Subscribe today to unlock all pages.
Trusted by 1+ million students worldwide
1.3 Questionnaire for a business problem.
It is method of survey in which the questions are asked from the sample population related to the
study (Albright, Winston and Zappe, 2010). A questionnaire is being prepared by the researcher
which is mentioned below:
Question1Gender?
a)Male
b)Female
Question2 Select your age group?
a) 15 to 20 years
b) 21 to 25 years
c) 25 to 30 years
d) 30 and above
Question 3 Do you think that expansion plan is beneficial for organization?
a) Yes
b) No
Question 4 Does the organization have appropriate financial position to expand its
operations?
a) Yes
b) No
Question 5 Do you think that organization has achieved a sustainable growth in their
business operations?
a) Yes
b) No
Question 6 Do you have made any suggestion to the organization related to business plan?
a) Yes
b) No
Question 7 Do you think that there is need for establish a new business plan?
a) Yes
b) No
3
Paraphrase This Document
Need a fresh take? Get an instant paraphrase of this document with our AI Paraphraser
Question 8: Do you think that the policies and plans of organization are effective?
a) Yes
b) No
Question 9 Does the organization have recognition among the students?
a) Yes
b) No
Question 10 Up to what to extent there are chances of achievement of success in new
business decision for organization.
a) Extensive
b) limited extent
c) Inclusive
TASK 2
2.1 Data estimation tools
Data estimation is a process of estimating collected data in respect of evaluating mean,
median and mode. On the basis of these estimations, further decisions are made regarding
business operations of the entity (Craft, 2013). In this regard, marks scored by a student in
business courses within LBBA school are evaluated. However, determining mean, median and
mode concepts on collected are to be discussed as below:
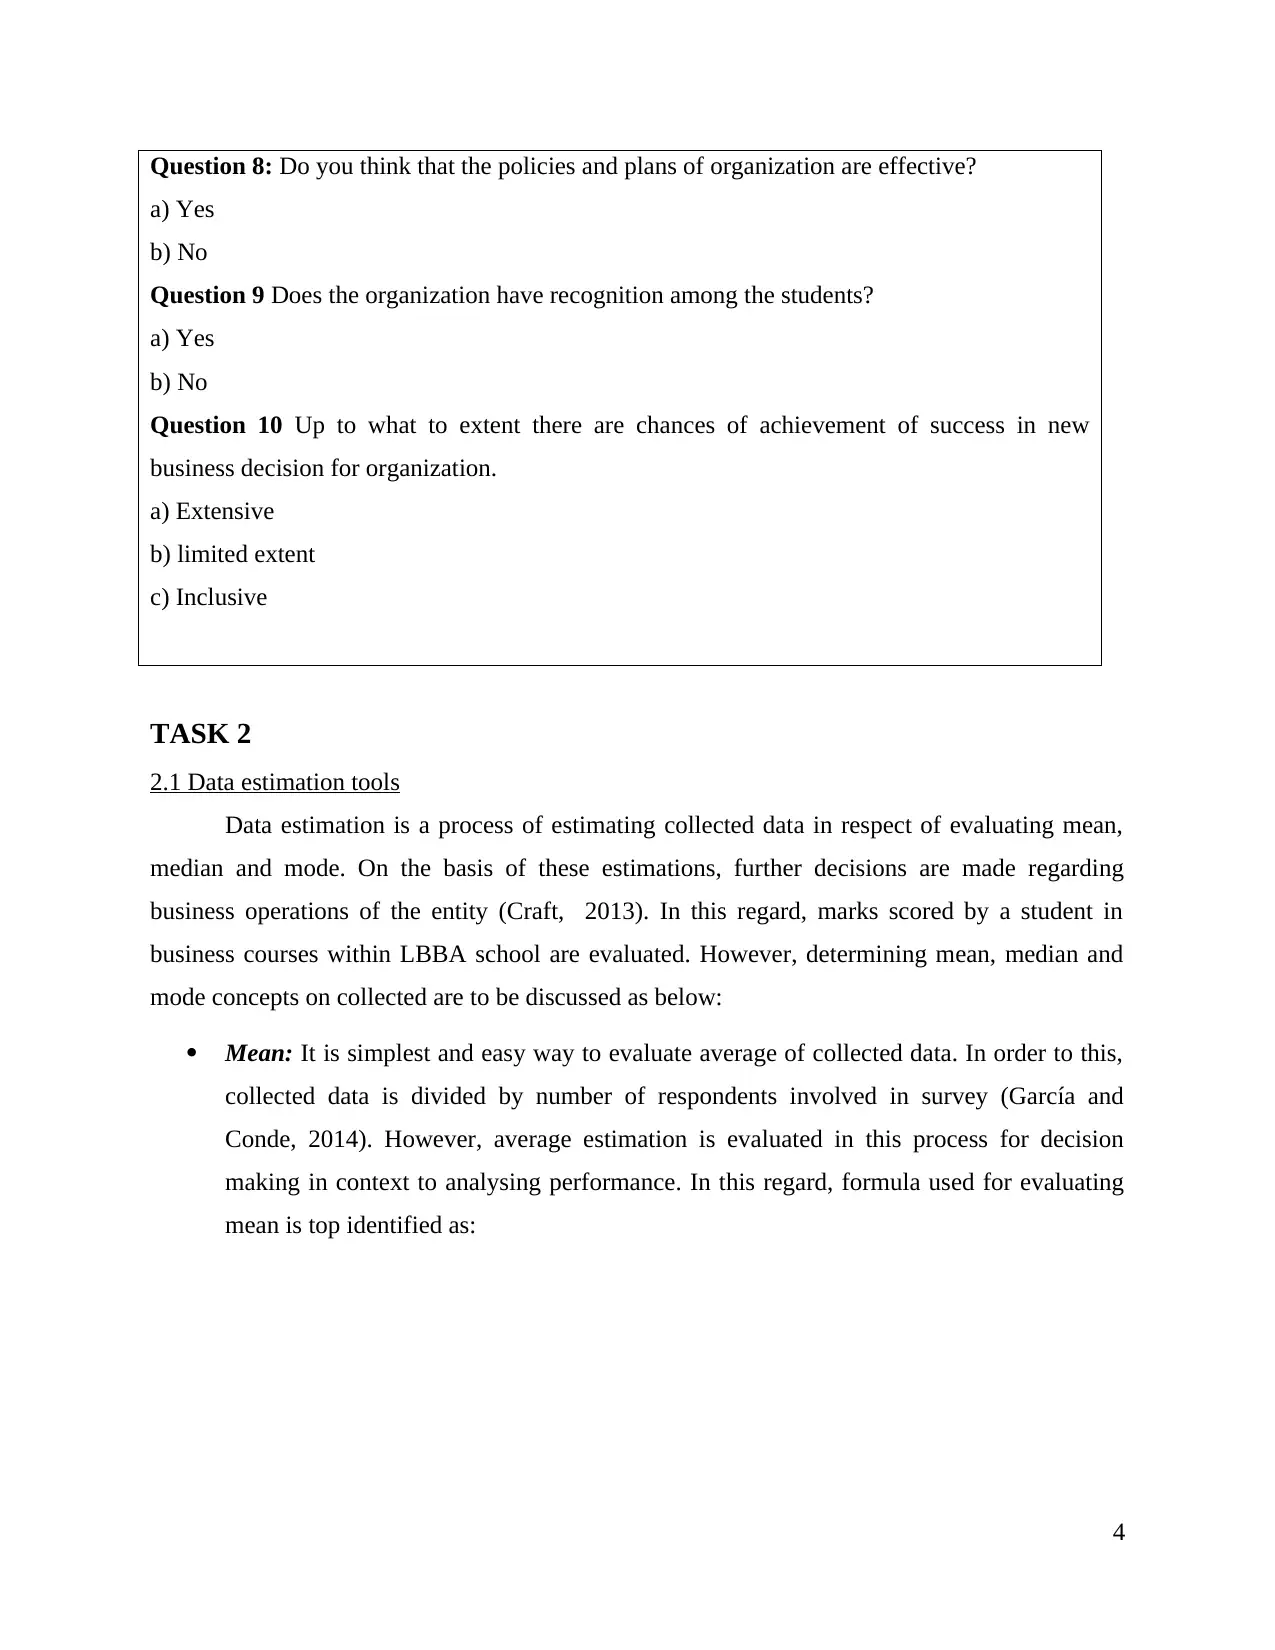
Mean: It is simplest and easy way to evaluate average of collected data. In order to this,
collected data is divided by number of respondents involved in survey (García and
Conde, 2014). However, average estimation is evaluated in this process for decision
making in context to analysing performance. In this regard, formula used for evaluating
mean is top identified as:
4
a) Yes
b) No
Question 9 Does the organization have recognition among the students?
a) Yes
b) No
Question 10 Up to what to extent there are chances of achievement of success in new
business decision for organization.
a) Extensive
b) limited extent
c) Inclusive
TASK 2
2.1 Data estimation tools
Data estimation is a process of estimating collected data in respect of evaluating mean,
median and mode. On the basis of these estimations, further decisions are made regarding
business operations of the entity (Craft, 2013). In this regard, marks scored by a student in
business courses within LBBA school are evaluated. However, determining mean, median and
mode concepts on collected are to be discussed as below:
Mean: It is simplest and easy way to evaluate average of collected data. In order to this,
collected data is divided by number of respondents involved in survey (García and
Conde, 2014). However, average estimation is evaluated in this process for decision
making in context to analysing performance. In this regard, formula used for evaluating
mean is top identified as:
4
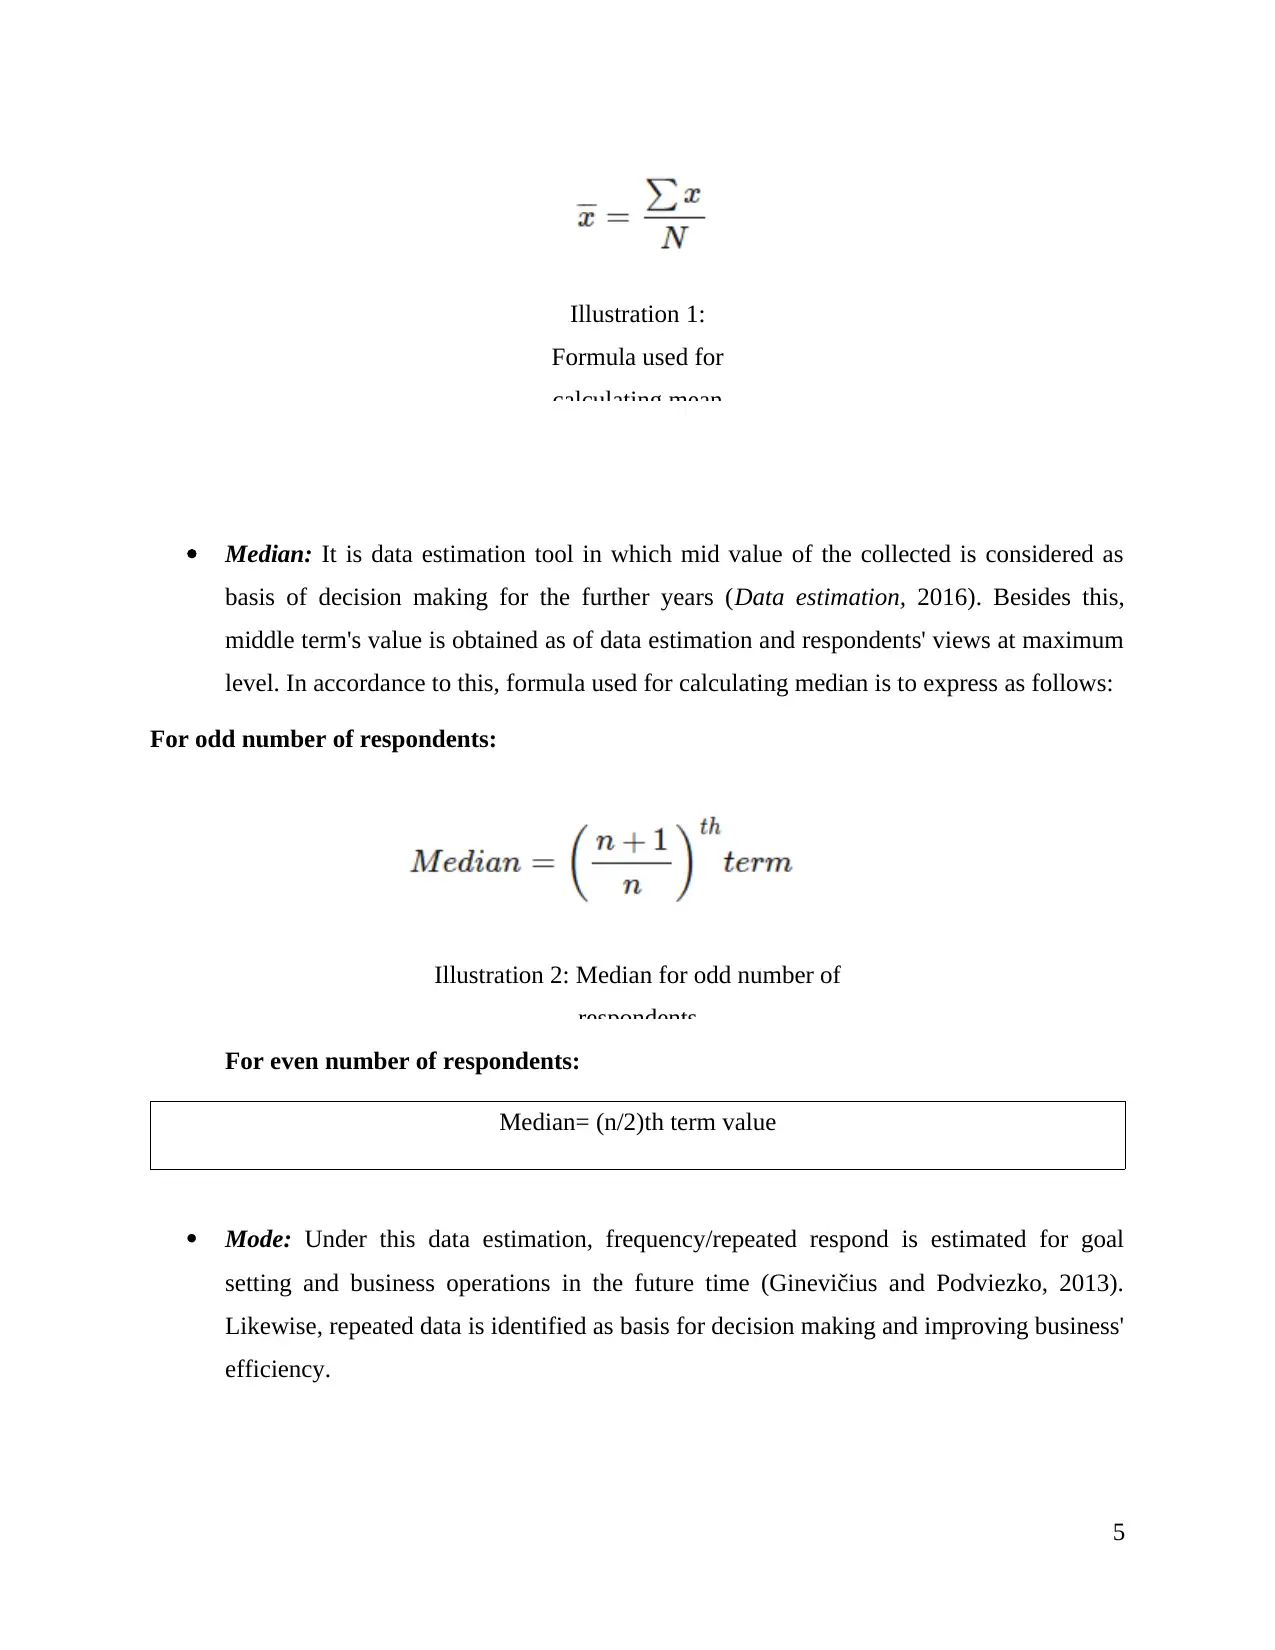
Illustration 1:
Formula used for
calculating mean
Median: It is data estimation tool in which mid value of the collected is considered as
basis of decision making for the further years (Data estimation, 2016). Besides this,
middle term's value is obtained as of data estimation and respondents' views at maximum
level. In accordance to this, formula used for calculating median is to express as follows:
For odd number of respondents:
Illustration 2: Median for odd number of
respondents
For even number of respondents:
Median= (n/2)th term value
Mode: Under this data estimation, frequency/repeated respond is estimated for goal
setting and business operations in the future time (Ginevičius and Podviezko, 2013).
Likewise, repeated data is identified as basis for decision making and improving business'
efficiency.
5
⊘ This is a preview!⊘
Do you want full access?
Subscribe today to unlock all pages.
Trusted by 1+ million students worldwide
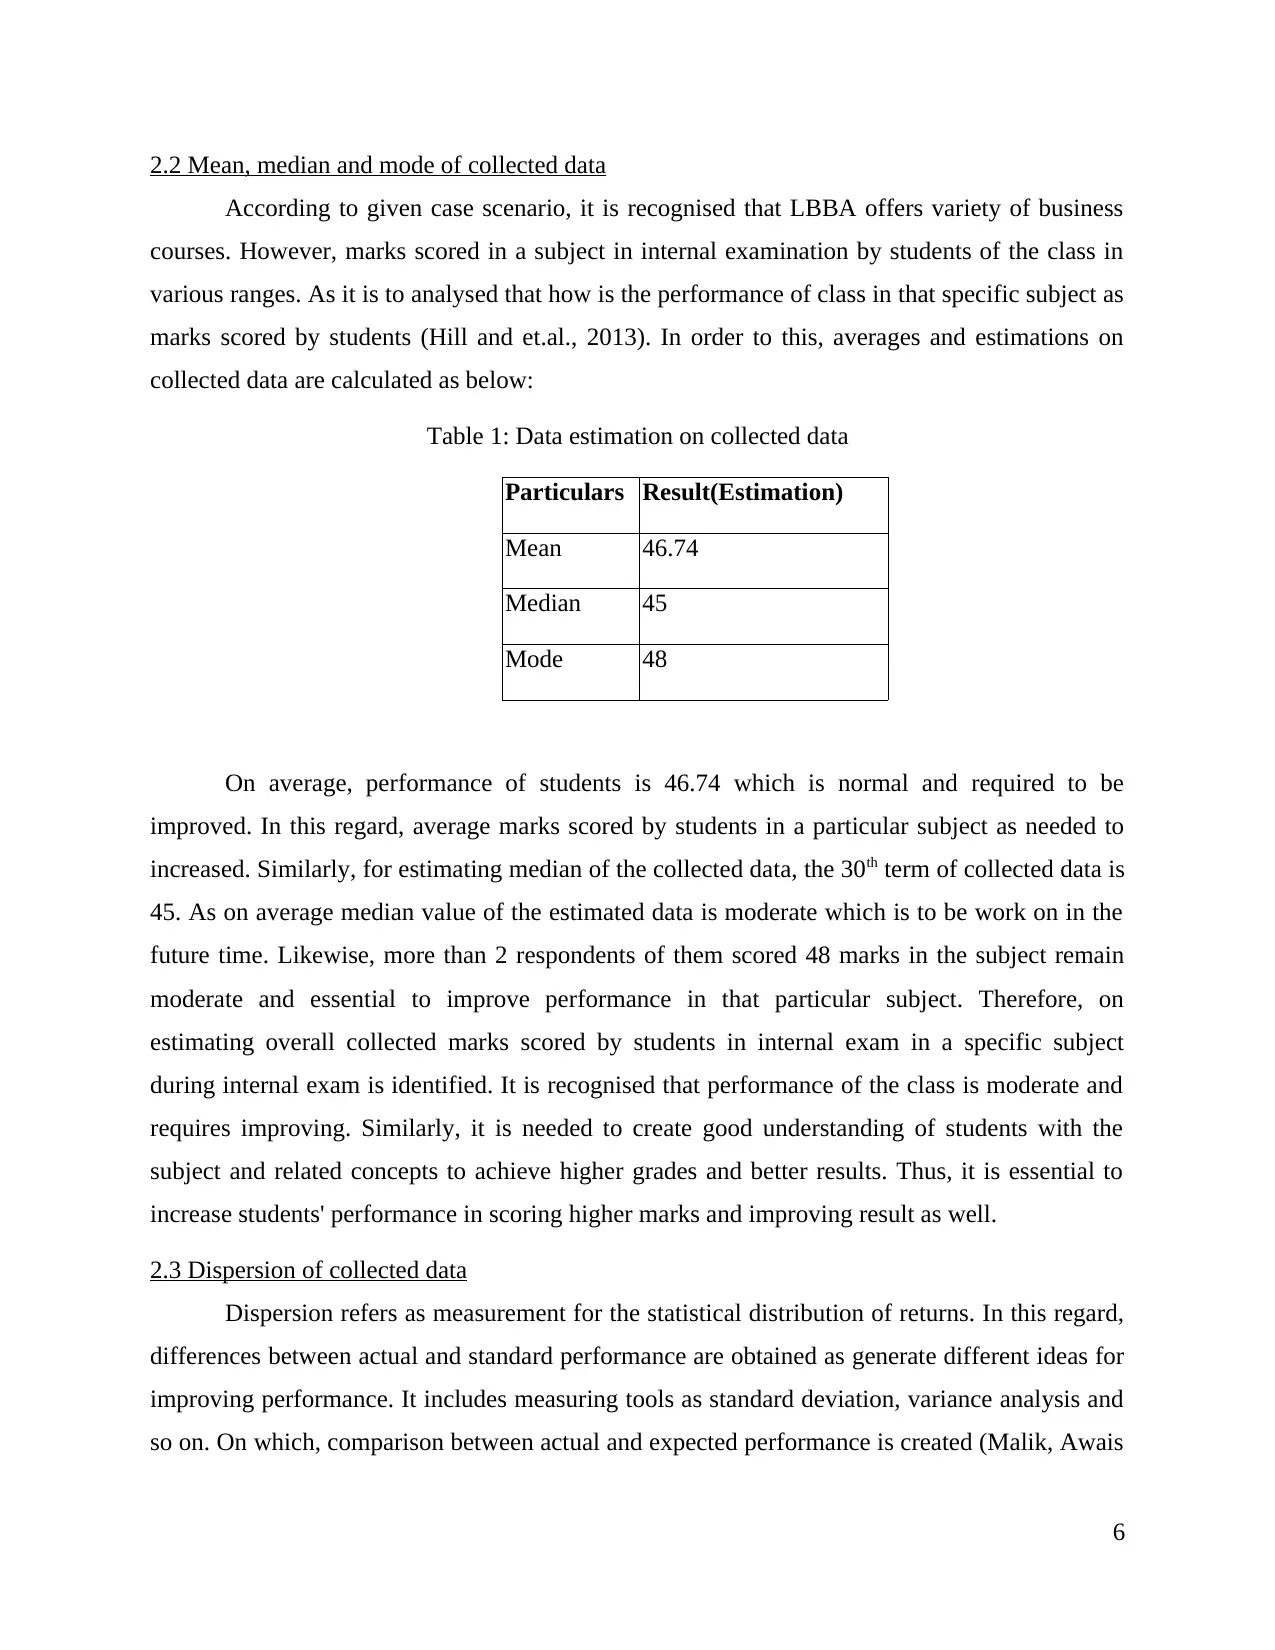
2.2 Mean, median and mode of collected data
According to given case scenario, it is recognised that LBBA offers variety of business
courses. However, marks scored in a subject in internal examination by students of the class in
various ranges. As it is to analysed that how is the performance of class in that specific subject as
marks scored by students (Hill and et.al., 2013). In order to this, averages and estimations on
collected data are calculated as below:
Table 1: Data estimation on collected data
Particulars Result(Estimation)
Mean 46.74
Median 45
Mode 48
On average, performance of students is 46.74 which is normal and required to be
improved. In this regard, average marks scored by students in a particular subject as needed to
increased. Similarly, for estimating median of the collected data, the 30th term of collected data is
45. As on average median value of the estimated data is moderate which is to be work on in the
future time. Likewise, more than 2 respondents of them scored 48 marks in the subject remain
moderate and essential to improve performance in that particular subject. Therefore, on
estimating overall collected marks scored by students in internal exam in a specific subject
during internal exam is identified. It is recognised that performance of the class is moderate and
requires improving. Similarly, it is needed to create good understanding of students with the
subject and related concepts to achieve higher grades and better results. Thus, it is essential to
increase students' performance in scoring higher marks and improving result as well.
2.3 Dispersion of collected data
Dispersion refers as measurement for the statistical distribution of returns. In this regard,
differences between actual and standard performance are obtained as generate different ideas for
improving performance. It includes measuring tools as standard deviation, variance analysis and
so on. On which, comparison between actual and expected performance is created (Malik, Awais
6
Paraphrase This Document
Need a fresh take? Get an instant paraphrase of this document with our AI Paraphraser
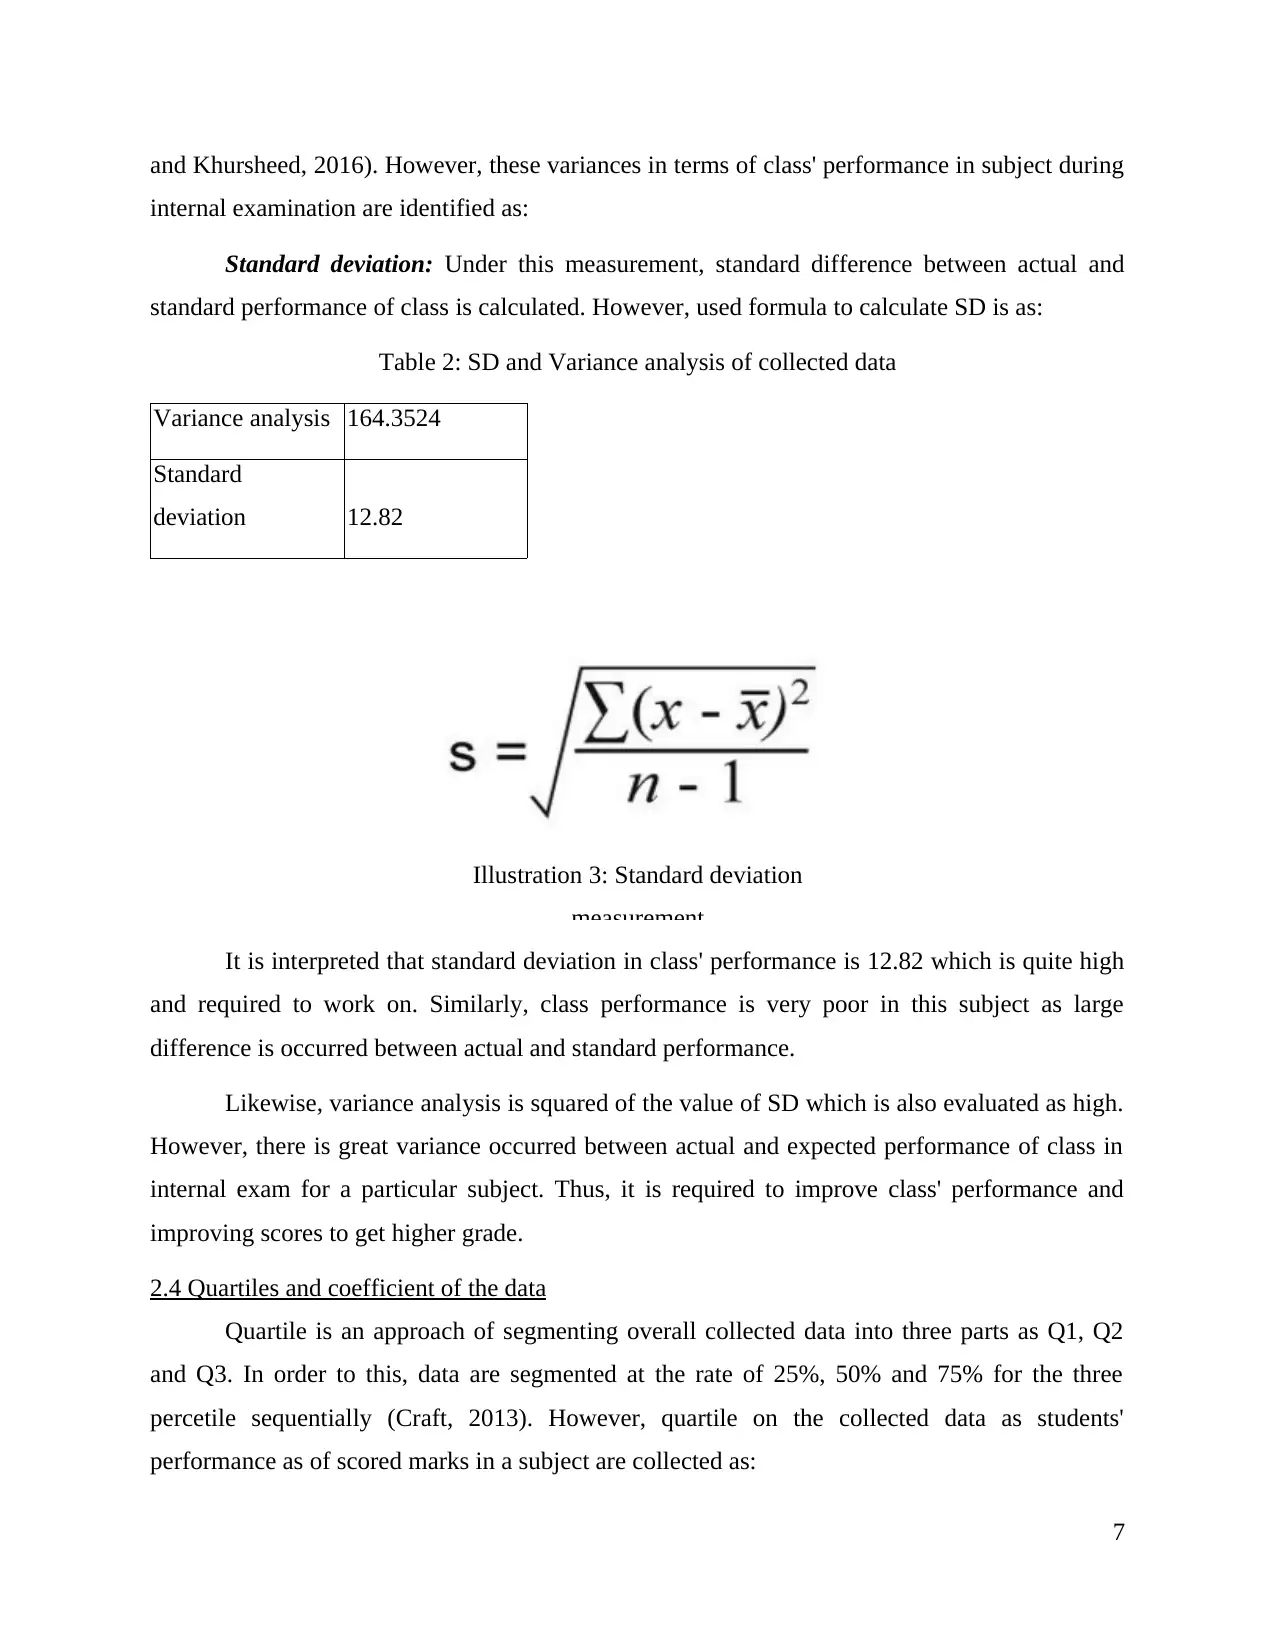
and Khursheed, 2016). However, these variances in terms of class' performance in subject during
internal examination are identified as:
Standard deviation: Under this measurement, standard difference between actual and
standard performance of class is calculated. However, used formula to calculate SD is as:
Table 2: SD and Variance analysis of collected data
Variance analysis 164.3524
Standard
deviation 12.82
Illustration 3: Standard deviation
measurement
It is interpreted that standard deviation in class' performance is 12.82 which is quite high
and required to work on. Similarly, class performance is very poor in this subject as large
difference is occurred between actual and standard performance.
Likewise, variance analysis is squared of the value of SD which is also evaluated as high.
However, there is great variance occurred between actual and expected performance of class in
internal exam for a particular subject. Thus, it is required to improve class' performance and
improving scores to get higher grade.
2.4 Quartiles and coefficient of the data
Quartile is an approach of segmenting overall collected data into three parts as Q1, Q2
and Q3. In order to this, data are segmented at the rate of 25%, 50% and 75% for the three
percetile sequentially (Craft, 2013). However, quartile on the collected data as students'
performance as of scored marks in a subject are collected as:
7
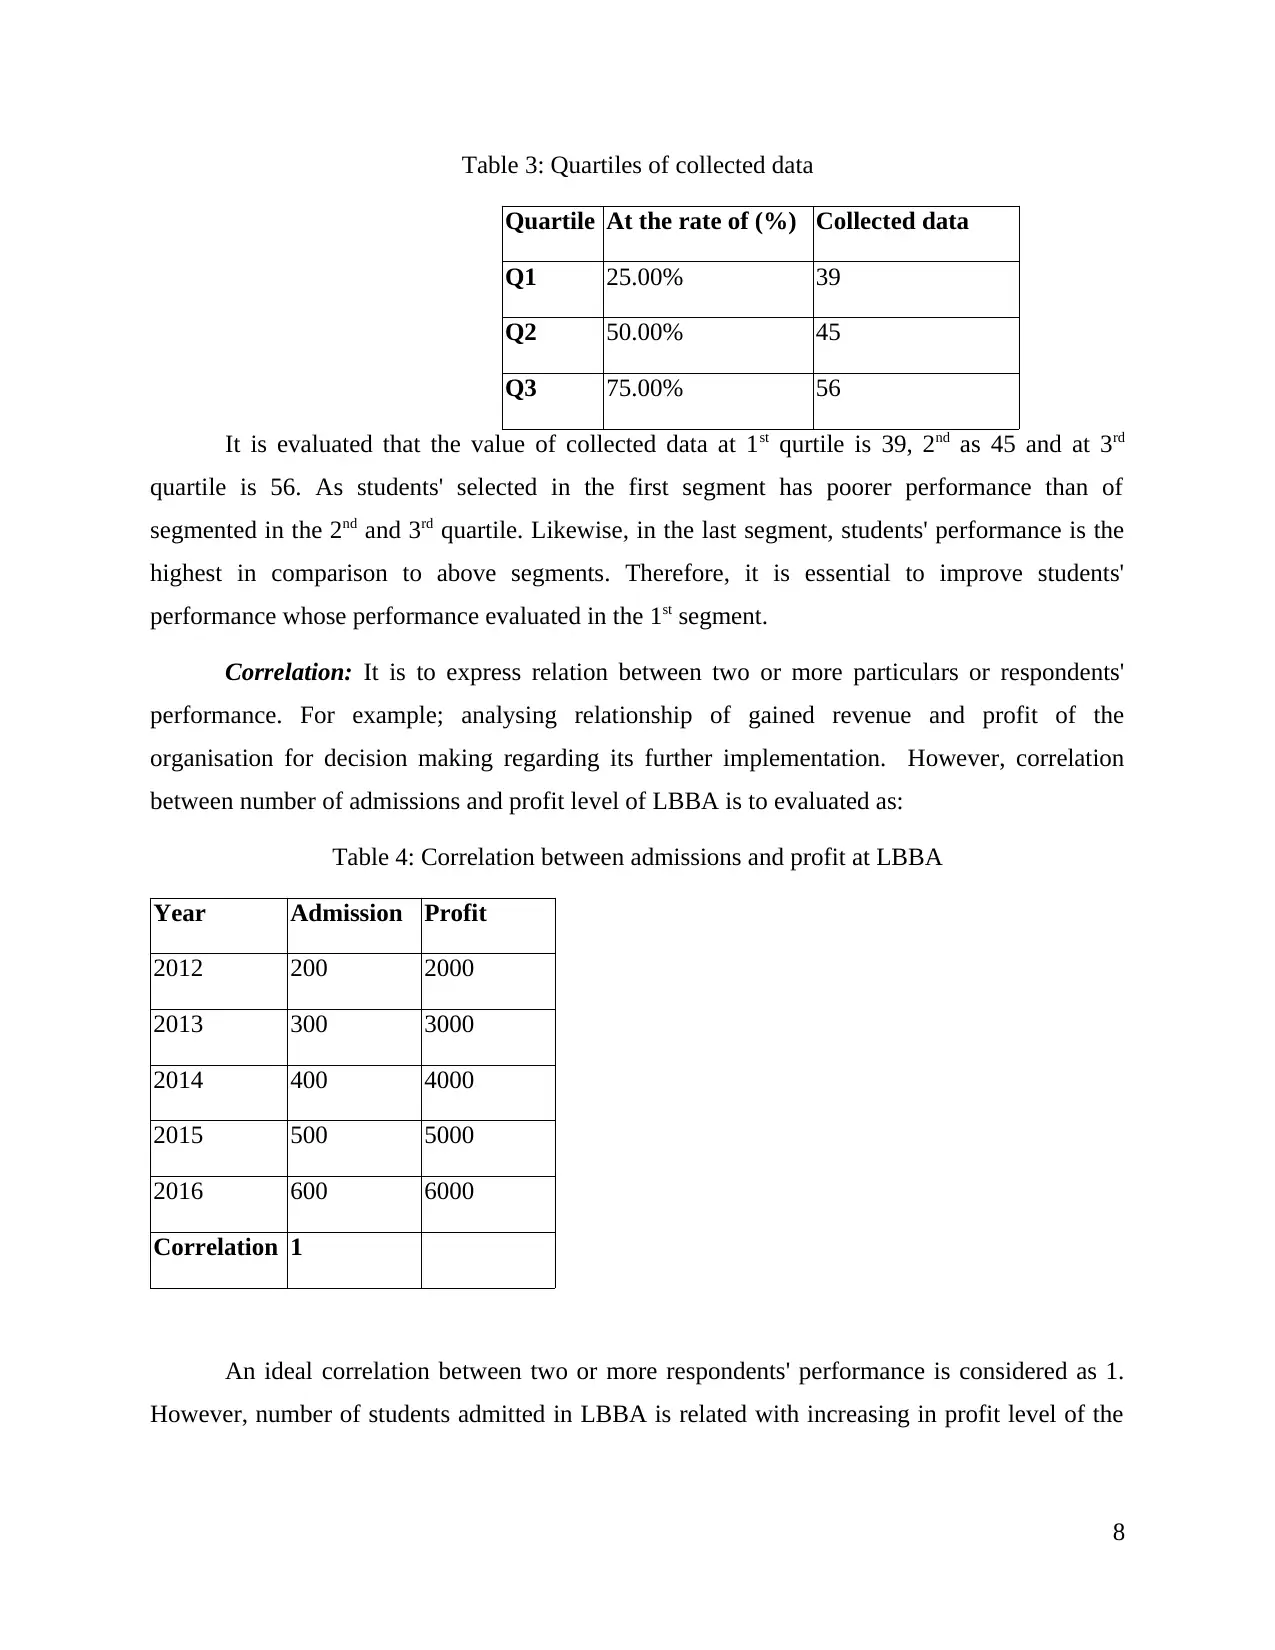
Table 3: Quartiles of collected data
Quartile At the rate of (%) Collected data
Q1 25.00% 39
Q2 50.00% 45
Q3 75.00% 56
It is evaluated that the value of collected data at 1st qurtile is 39, 2nd as 45 and at 3rd
quartile is 56. As students' selected in the first segment has poorer performance than of
segmented in the 2nd and 3rd quartile. Likewise, in the last segment, students' performance is the
highest in comparison to above segments. Therefore, it is essential to improve students'
performance whose performance evaluated in the 1st segment.
Correlation: It is to express relation between two or more particulars or respondents'
performance. For example; analysing relationship of gained revenue and profit of the
organisation for decision making regarding its further implementation. However, correlation
between number of admissions and profit level of LBBA is to evaluated as:
Table 4: Correlation between admissions and profit at LBBA
Year Admission Profit
2012 200 2000
2013 300 3000
2014 400 4000
2015 500 5000
2016 600 6000
Correlation 1
An ideal correlation between two or more respondents' performance is considered as 1.
However, number of students admitted in LBBA is related with increasing in profit level of the
8
⊘ This is a preview!⊘
Do you want full access?
Subscribe today to unlock all pages.
Trusted by 1+ million students worldwide
1 out of 24
Related Documents


Your All-in-One AI-Powered Toolkit for Academic Success.
+13062052269
info@desklib.com
Available 24*7 on WhatsApp / Email
![[object Object]](/_next/static/media/star-bottom.7253800d.svg)
Unlock your academic potential
Copyright © 2020–2026 A2Z Services. All Rights Reserved. Developed and managed by ZUCOL.