Business Decision Making Report: Data Analysis for Murano Restaurant
VerifiedAdded on 2020/11/23
|23
|4054
|217
Report
AI Summary
This report provides a detailed analysis of business decision-making processes, focusing on data collection, analysis, and interpretation for the Murano restaurant. The report begins with an introduction to the importance of effective business decisions and outlines the methodologies used, including primary and secondary data sources. Task 1 covers data collection methods, survey techniques, and questionnaire design. Task 2 delves into data interpretation, statistical analysis using measures of central tendency (mean, median, mode) and dispersion (range, standard deviation), and correlation coefficients. Task 3 focuses on data visualization through graphs and charts, trend line analysis, and formal report preparation. Finally, Task 4 examines the application of informational techniques, critical path analysis, and investment appraisal tools for decision-making. The report aims to provide insights into the restaurant's operations, customer feedback, and potential expansion strategies, offering a comprehensive overview of business decision-making in a practical context.
BUSINESS DECISION
MAKING
MAKING
Paraphrase This Document
Need a fresh take? Get an instant paraphrase of this document with our AI Paraphraser
TABLE OF CONTENTS
INTRODUCTION...........................................................................................................................1
TASK 1............................................................................................................................................1
1.1 Collection of data using various sources..........................................................................1
1.2: Methodologies used in survey and sample framing........................................................2
1.3 Designing a Questionnaire...............................................................................................3
TASK 2............................................................................................................................................4
2.1: Interpretation of the collected data..................................................................................4
2.2: Analysing the results.......................................................................................................7
2.3: Analysis of results using measures of dispersion............................................................8
2.4: Benefits attained in using quartile, Percentile and correlation coefficient......................9
TASK 3..........................................................................................................................................10
3.1: Analysis of result by preparing graphs and charts........................................................10
3.2: Drawing a trend line......................................................................................................14
3.3: Covered in PPT.............................................................................................................16
3.4: Preparation of formal report..........................................................................................16
TASK 4..........................................................................................................................................17
4.1: Using informational techniques is making decisions....................................................17
4.2: Critical path...................................................................................................................17
4.3: Investment appraisal tools.............................................................................................18
CONCLUSION..............................................................................................................................18
REFERENCES..............................................................................................................................19
INTRODUCTION
The decisions related to businesses are very critical and these decisions can change the
company's operations and play a vital role in the future profitability of the organisation. The
managers should take the decisions related to the company very effectively and considering all
the factors that will impact the business in present and future. These decisions are taken to
manage the day to day operations of the business so that the management is able to achieve the
long and short term objectives of the business in an more organised and efficient manner.(Power,
and Phillips-Wren, 2011)
For generating more effective outcomes from the operations , there is an need for
evaluations of the feedbacks that are provided by customers who are visiting Murano on a
regular basis. This research report of decision making will discuss about the collection of data
from various sources such as primary and secondary. For the purpose of achieving the objectives
, lots of research methods will be used by the Murano such as data sampling , uses of various
questionnaires in getting feedbacks and using bar graphs and charts for presentation and
interpretation of those answers. All the information is formally summarised in order to present a
report that will then be used in taking decisions by the internal management.
TASK 1
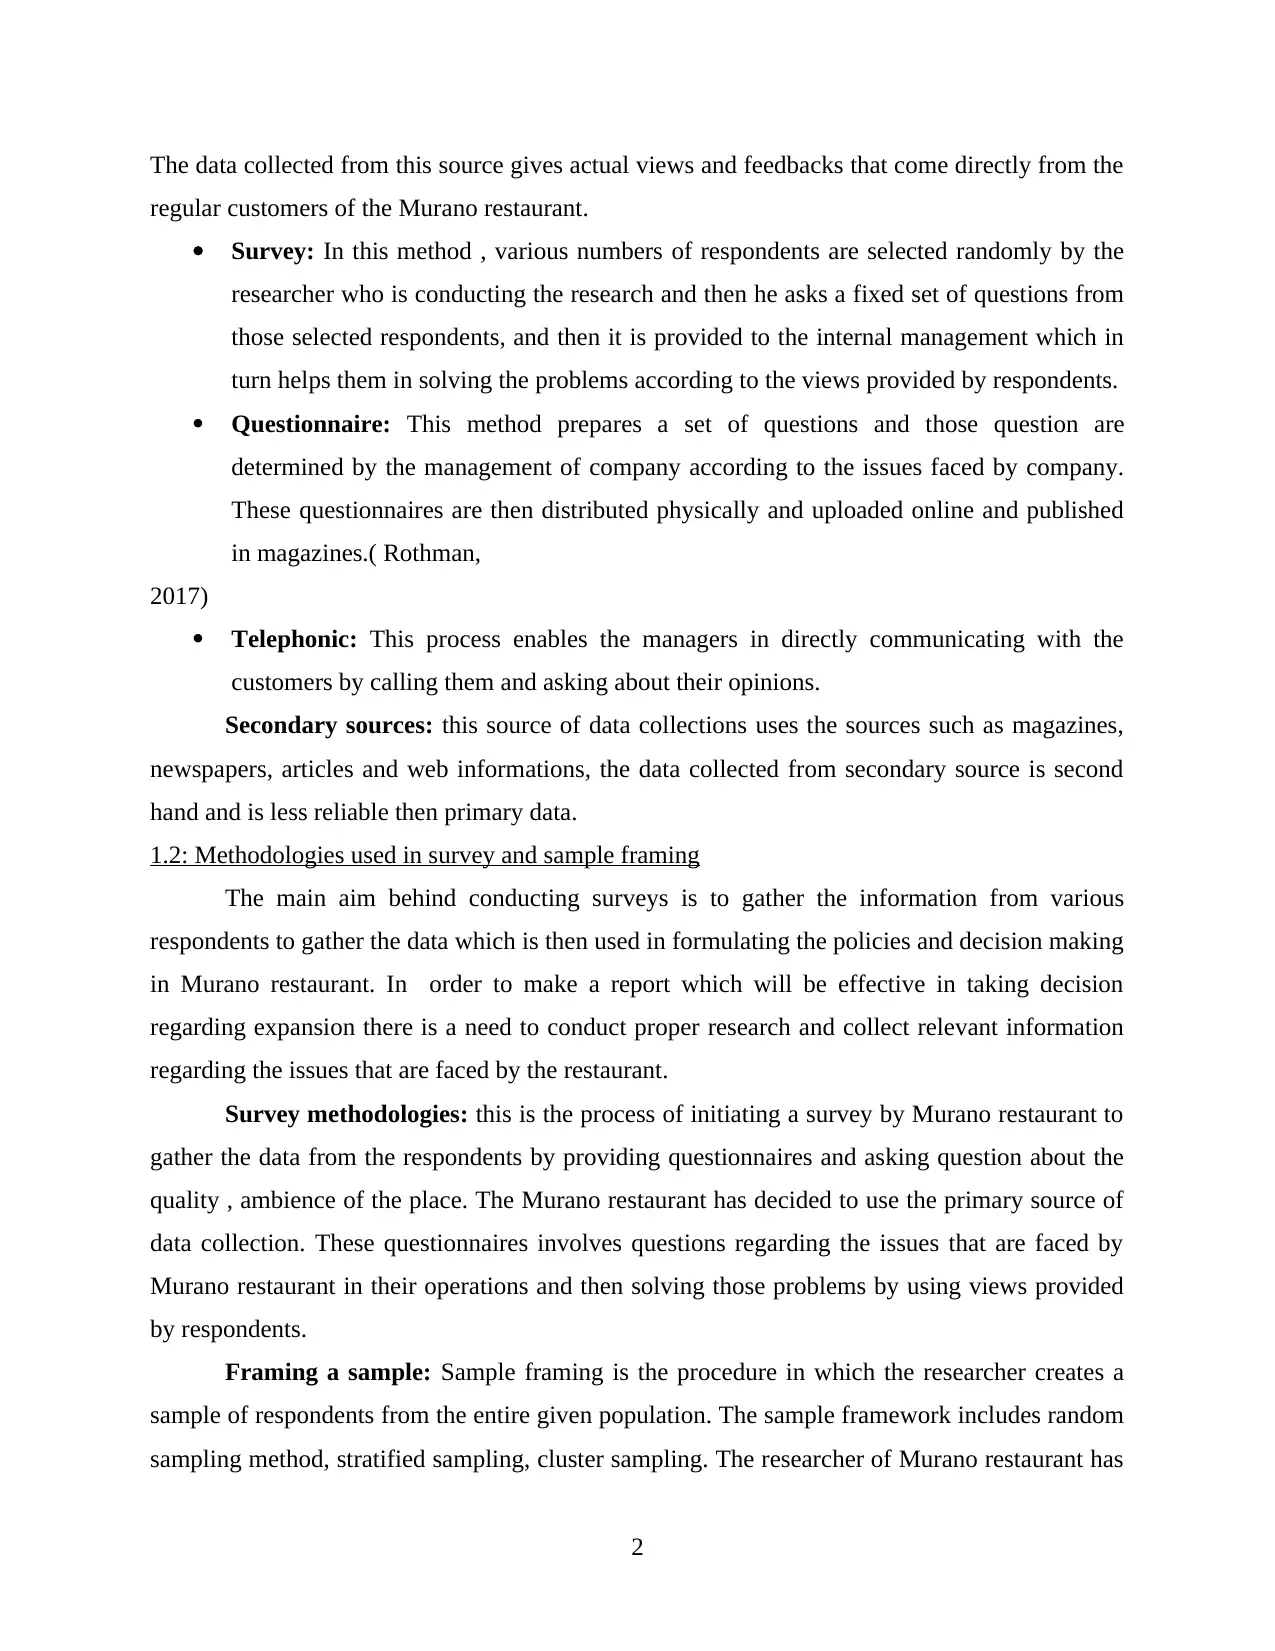
1.1 Collection of data using various sources
The Murano restaurant is current operating in London UK and providing hospitality and
foods & beverage services in the city. They are looking to expand their business further for
which they are required to collect the information from the customers and public regarding their
services and quality of food they are providing. Fot this purpose they are looking for various
sources from which they can gain the information for taking decisions regarding the expansion of
their restaurant. There are two common methods that are adopted by the Murano restaurant in
order to collect information, these are broadly described as primary and secondary source of data
collection. By using informations from these sources it is the responsibility of the researcher to
gather information which is reliable and accurate. These methods are as under:
Primary sources: this source of collection of data uses fresh sources of data collection
and the data gathered from this source is first hand and data acquired from this source is more
reliable and accurate. The primary sources includes surveys , questionnaire and online websites .
1
The decisions related to businesses are very critical and these decisions can change the
company's operations and play a vital role in the future profitability of the organisation. The
managers should take the decisions related to the company very effectively and considering all
the factors that will impact the business in present and future. These decisions are taken to
manage the day to day operations of the business so that the management is able to achieve the
long and short term objectives of the business in an more organised and efficient manner.(Power,
and Phillips-Wren, 2011)
For generating more effective outcomes from the operations , there is an need for
evaluations of the feedbacks that are provided by customers who are visiting Murano on a
regular basis. This research report of decision making will discuss about the collection of data
from various sources such as primary and secondary. For the purpose of achieving the objectives
, lots of research methods will be used by the Murano such as data sampling , uses of various
questionnaires in getting feedbacks and using bar graphs and charts for presentation and
interpretation of those answers. All the information is formally summarised in order to present a
report that will then be used in taking decisions by the internal management.
TASK 1
1.1 Collection of data using various sources
The Murano restaurant is current operating in London UK and providing hospitality and
foods & beverage services in the city. They are looking to expand their business further for
which they are required to collect the information from the customers and public regarding their
services and quality of food they are providing. Fot this purpose they are looking for various
sources from which they can gain the information for taking decisions regarding the expansion of
their restaurant. There are two common methods that are adopted by the Murano restaurant in
order to collect information, these are broadly described as primary and secondary source of data
collection. By using informations from these sources it is the responsibility of the researcher to
gather information which is reliable and accurate. These methods are as under:
Primary sources: this source of collection of data uses fresh sources of data collection
and the data gathered from this source is first hand and data acquired from this source is more
reliable and accurate. The primary sources includes surveys , questionnaire and online websites .
1
⊘ This is a preview!⊘
Do you want full access?
Subscribe today to unlock all pages.
Trusted by 1+ million students worldwide
The data collected from this source gives actual views and feedbacks that come directly from the
regular customers of the Murano restaurant.
Survey: In this method , various numbers of respondents are selected randomly by the
researcher who is conducting the research and then he asks a fixed set of questions from
those selected respondents, and then it is provided to the internal management which in
turn helps them in solving the problems according to the views provided by respondents.
Questionnaire: This method prepares a set of questions and those question are
determined by the management of company according to the issues faced by company.
These questionnaires are then distributed physically and uploaded online and published
in magazines.( Rothman,
2017)
Telephonic: This process enables the managers in directly communicating with the
customers by calling them and asking about their opinions.
Secondary sources: this source of data collections uses the sources such as magazines,
newspapers, articles and web informations, the data collected from secondary source is second
hand and is less reliable then primary data.
1.2: Methodologies used in survey and sample framing
The main aim behind conducting surveys is to gather the information from various
respondents to gather the data which is then used in formulating the policies and decision making
in Murano restaurant. In order to make a report which will be effective in taking decision
regarding expansion there is a need to conduct proper research and collect relevant information
regarding the issues that are faced by the restaurant.
Survey methodologies: this is the process of initiating a survey by Murano restaurant to
gather the data from the respondents by providing questionnaires and asking question about the
quality , ambience of the place. The Murano restaurant has decided to use the primary source of
data collection. These questionnaires involves questions regarding the issues that are faced by
Murano restaurant in their operations and then solving those problems by using views provided
by respondents.
Framing a sample: Sample framing is the procedure in which the researcher creates a
sample of respondents from the entire given population. The sample framework includes random
sampling method, stratified sampling, cluster sampling. The researcher of Murano restaurant has
2
Paraphrase This Document
Need a fresh take? Get an instant paraphrase of this document with our AI Paraphraser
used random sampling method for gathering information which is the most effective and
simplest method for selecting a sample from the population. (Sethi, and Zhang 2012) According
to this method the researcher chooses random respondents without discriminating so that the data
includes all type of information. Here the researcher of Murano is using a sample of 120
respondents from a given population. The issues that are questioned from these respondents
include:
diversification in services
Food product Quality and quantity
Rates
Ambience of Murano restaurant.
1.3 Designing a Questionnaire
Questionnaire
Murano restaurant
Respondent:
Sex:
Age:
Q1. Have you visited Murano restaurant ever?
Yes
No
Q2. What do you like most in Murano restaurant?
Services
Food
Ambience
Other
Q3. Are you satisfied with the quality of the food?
Yes
No
Q4. Is the price of food and services of Murano restaurant reasonable?
Yes
No
Q5. Are you satisfied with the diversification in the services and food products?
3
Satisfy
Highly satisfy
Dissatisfied
Q6. Which cuisine would you like the restaurant to serve in main course?
Italian
Chinese
French
Q7. Do you want that Murano introduce new dishes in its menu?
Yes, in breakfast
Yes, in main course
No
Q8. Which location you wish that Murano reaturant should establish its another branch?
Prime location
Country side
Q9. Feel free in providing your personal views?
Ans:....
TASK 2
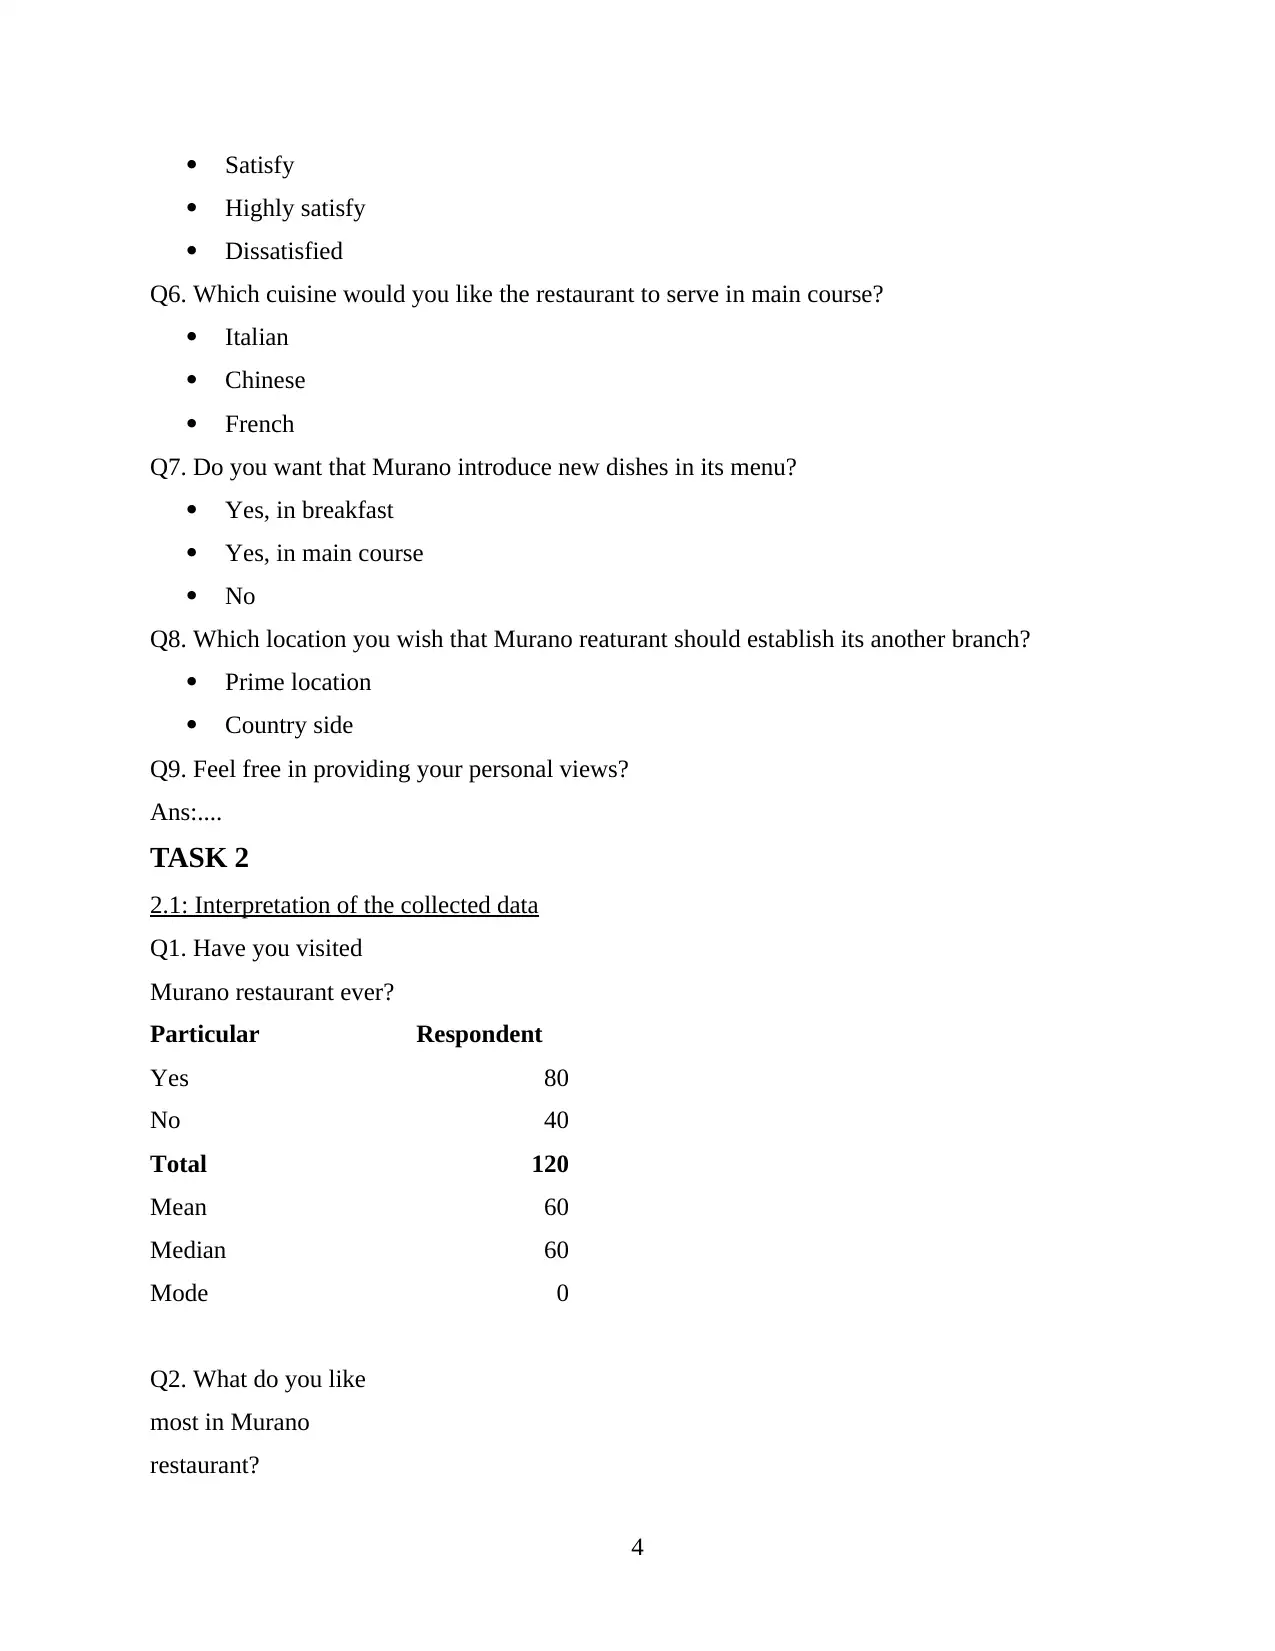
2.1: Interpretation of the collected data
Q1. Have you visited
Murano restaurant ever?
Particular Respondent
Yes 80
No 40
Total 120
Mean 60
Median 60
Mode 0
Q2. What do you like
most in Murano
restaurant?
4
Highly satisfy
Dissatisfied
Q6. Which cuisine would you like the restaurant to serve in main course?
Italian
Chinese
French
Q7. Do you want that Murano introduce new dishes in its menu?
Yes, in breakfast
Yes, in main course
No
Q8. Which location you wish that Murano reaturant should establish its another branch?
Prime location
Country side
Q9. Feel free in providing your personal views?
Ans:....
TASK 2
2.1: Interpretation of the collected data
Q1. Have you visited
Murano restaurant ever?
Particular Respondent
Yes 80
No 40
Total 120
Mean 60
Median 60
Mode 0
Q2. What do you like
most in Murano
restaurant?
4
⊘ This is a preview!⊘
Do you want full access?
Subscribe today to unlock all pages.
Trusted by 1+ million students worldwide
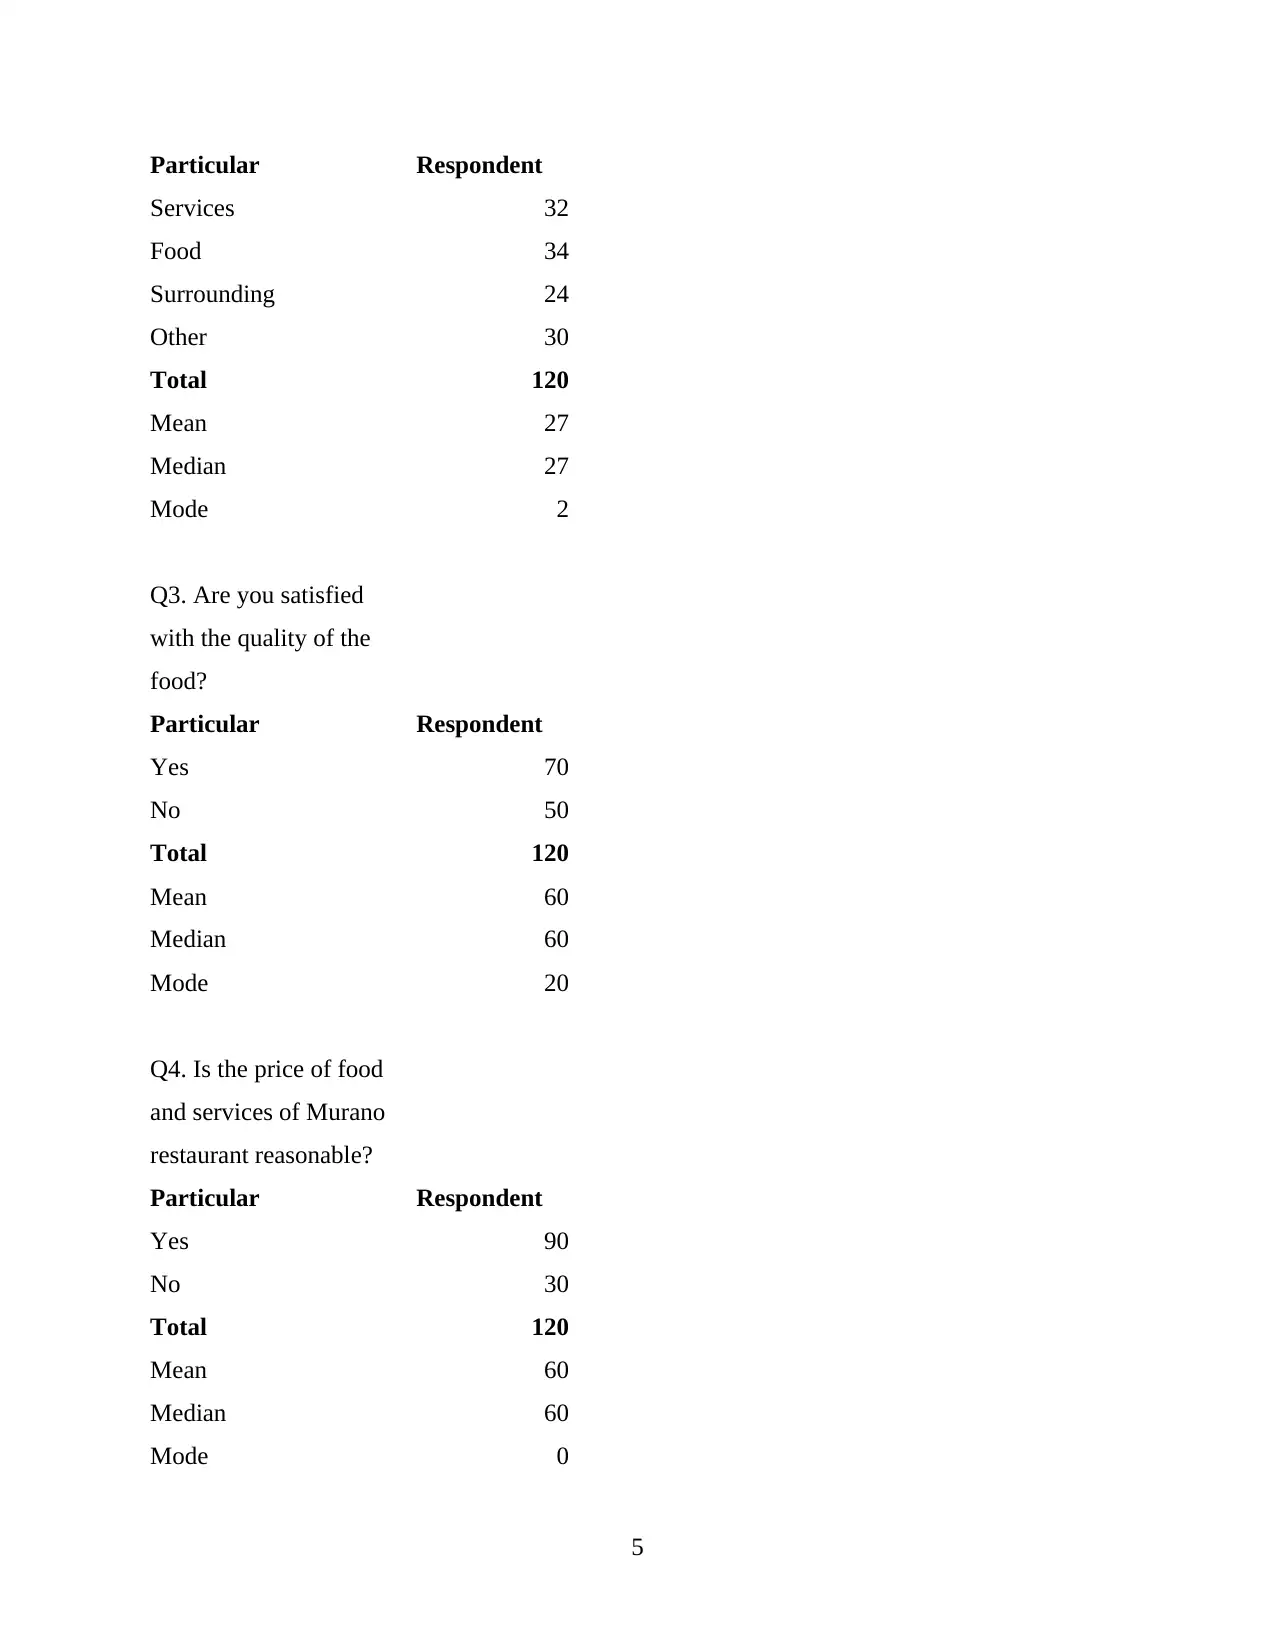
Particular Respondent
Services 32
Food 34
Surrounding 24
Other 30
Total 120
Mean 27
Median 27
Mode 2
Q3. Are you satisfied
with the quality of the
food?
Particular Respondent
Yes 70
No 50
Total 120
Mean 60
Median 60
Mode 20
Q4. Is the price of food
and services of Murano
restaurant reasonable?
Particular Respondent
Yes 90
No 30
Total 120
Mean 60
Median 60
Mode 0
5
Paraphrase This Document
Need a fresh take? Get an instant paraphrase of this document with our AI Paraphraser
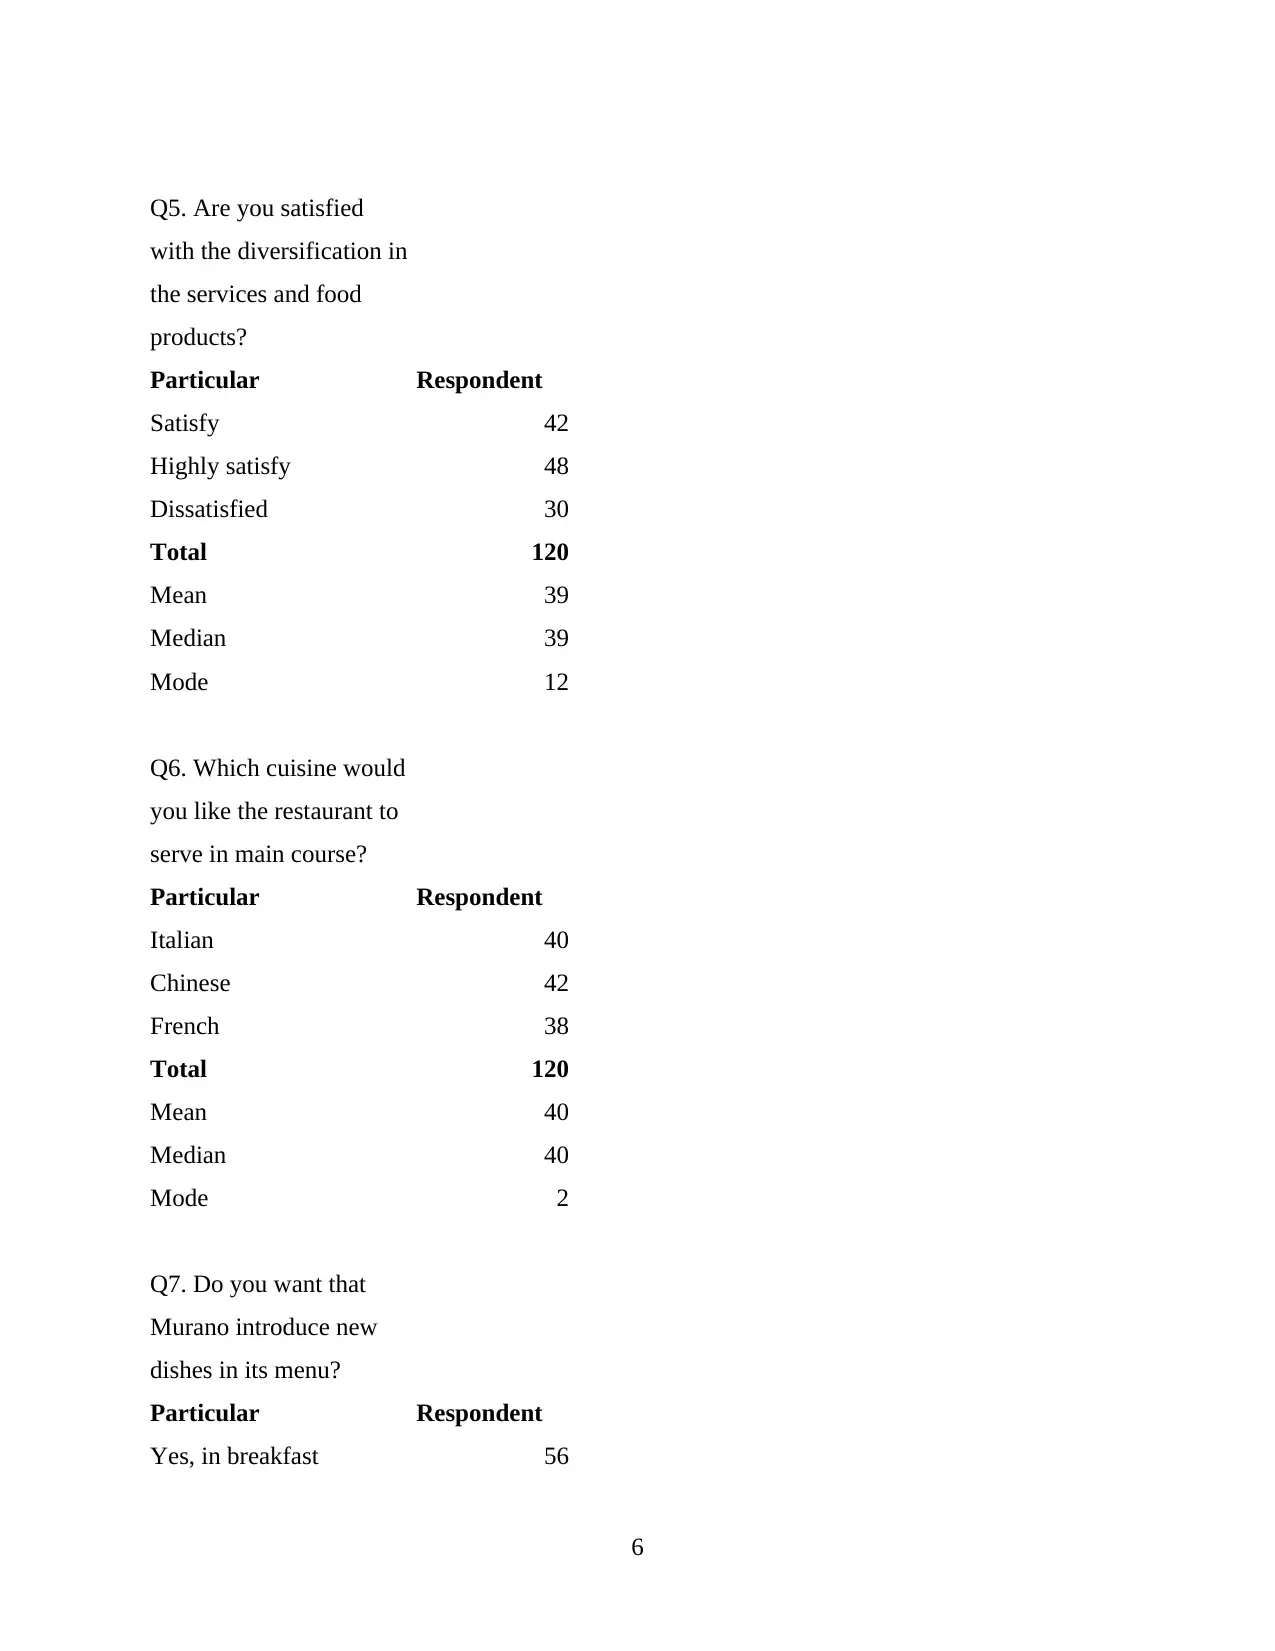
Q5. Are you satisfied
with the diversification in
the services and food
products?
Particular Respondent
Satisfy 42
Highly satisfy 48
Dissatisfied 30
Total 120
Mean 39
Median 39
Mode 12
Q6. Which cuisine would
you like the restaurant to
serve in main course?
Particular Respondent
Italian 40
Chinese 42
French 38
Total 120
Mean 40
Median 40
Mode 2
Q7. Do you want that
Murano introduce new
dishes in its menu?
Particular Respondent
Yes, in breakfast 56
6
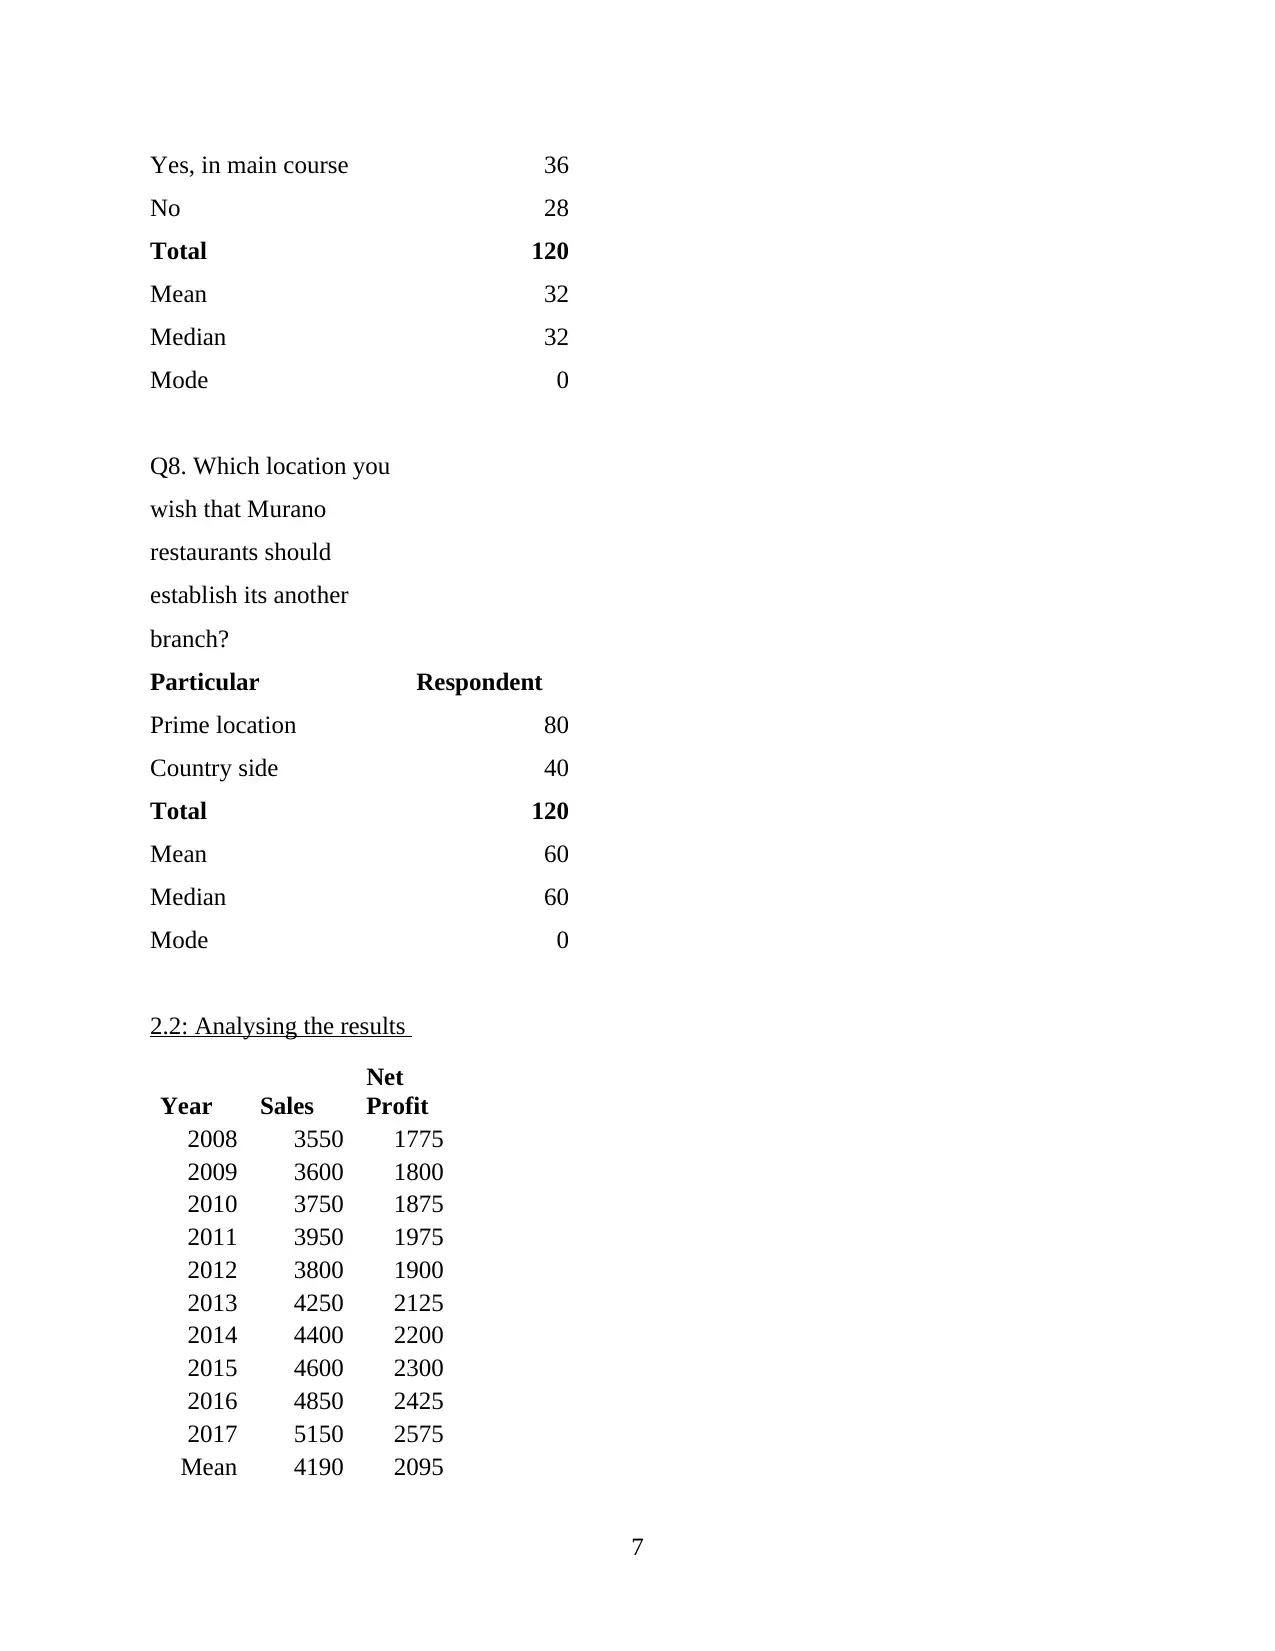
Yes, in main course 36
No 28
Total 120
Mean 32
Median 32
Mode 0
Q8. Which location you
wish that Murano
restaurants should
establish its another
branch?
Particular Respondent
Prime location 80
Country side 40
Total 120
Mean 60
Median 60
Mode 0
2.2: Analysing the results
Year Sales
Net
Profit
2008 3550 1775
2009 3600 1800
2010 3750 1875
2011 3950 1975
2012 3800 1900
2013 4250 2125
2014 4400 2200
2015 4600 2300
2016 4850 2425
2017 5150 2575
Mean 4190 2095
7
⊘ This is a preview!⊘
Do you want full access?
Subscribe today to unlock all pages.
Trusted by 1+ million students worldwide
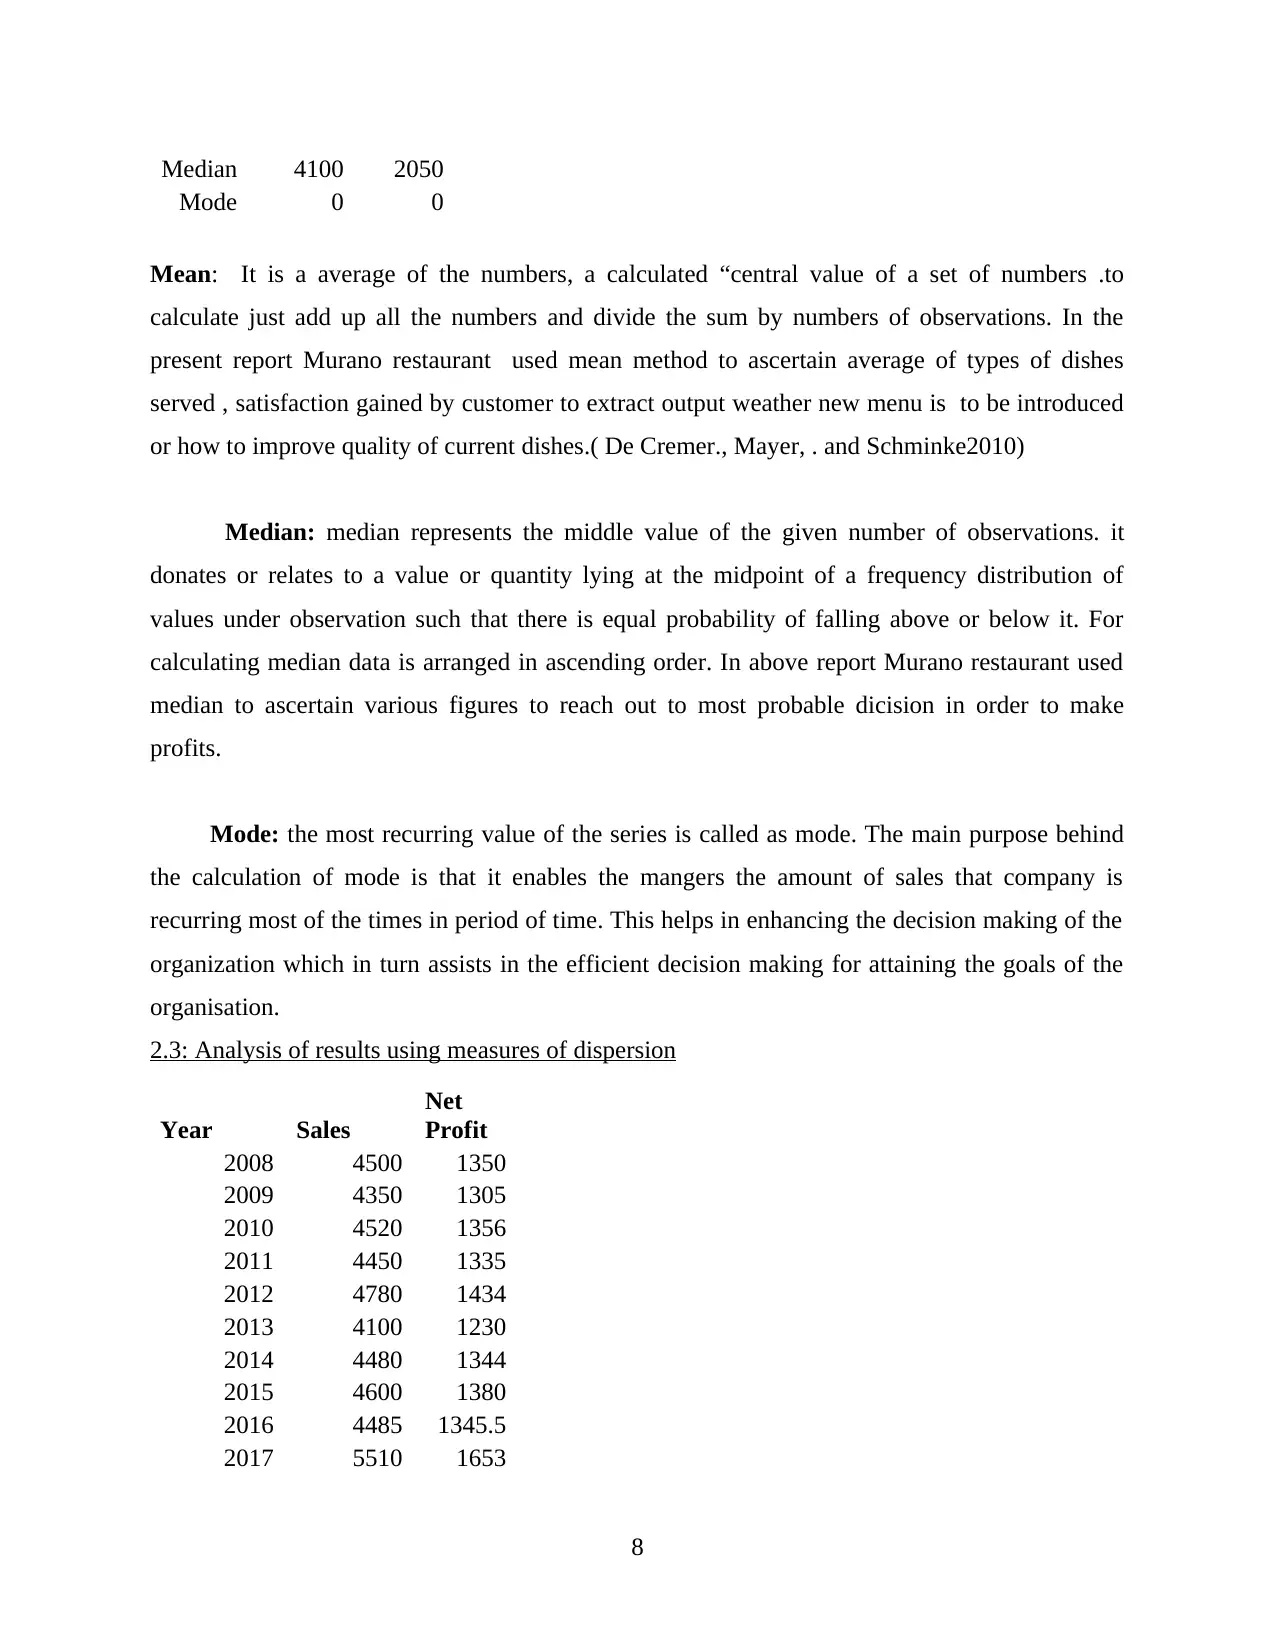
Median 4100 2050
Mode 0 0
Mean: It is a average of the numbers, a calculated “central value of a set of numbers .to
calculate just add up all the numbers and divide the sum by numbers of observations. In the
present report Murano restaurant used mean method to ascertain average of types of dishes
served , satisfaction gained by customer to extract output weather new menu is to be introduced
or how to improve quality of current dishes.( De Cremer., Mayer, . and Schminke2010)
Median: median represents the middle value of the given number of observations. it
donates or relates to a value or quantity lying at the midpoint of a frequency distribution of
values under observation such that there is equal probability of falling above or below it. For
calculating median data is arranged in ascending order. In above report Murano restaurant used
median to ascertain various figures to reach out to most probable dicision in order to make
profits.
Mode: the most recurring value of the series is called as mode. The main purpose behind
the calculation of mode is that it enables the mangers the amount of sales that company is
recurring most of the times in period of time. This helps in enhancing the decision making of the
organization which in turn assists in the efficient decision making for attaining the goals of the
organisation.
2.3: Analysis of results using measures of dispersion
Year Sales
Net
Profit
2008 4500 1350
2009 4350 1305
2010 4520 1356
2011 4450 1335
2012 4780 1434
2013 4100 1230
2014 4480 1344
2015 4600 1380
2016 4485 1345.5
2017 5510 1653
8
Paraphrase This Document
Need a fresh take? Get an instant paraphrase of this document with our AI Paraphraser
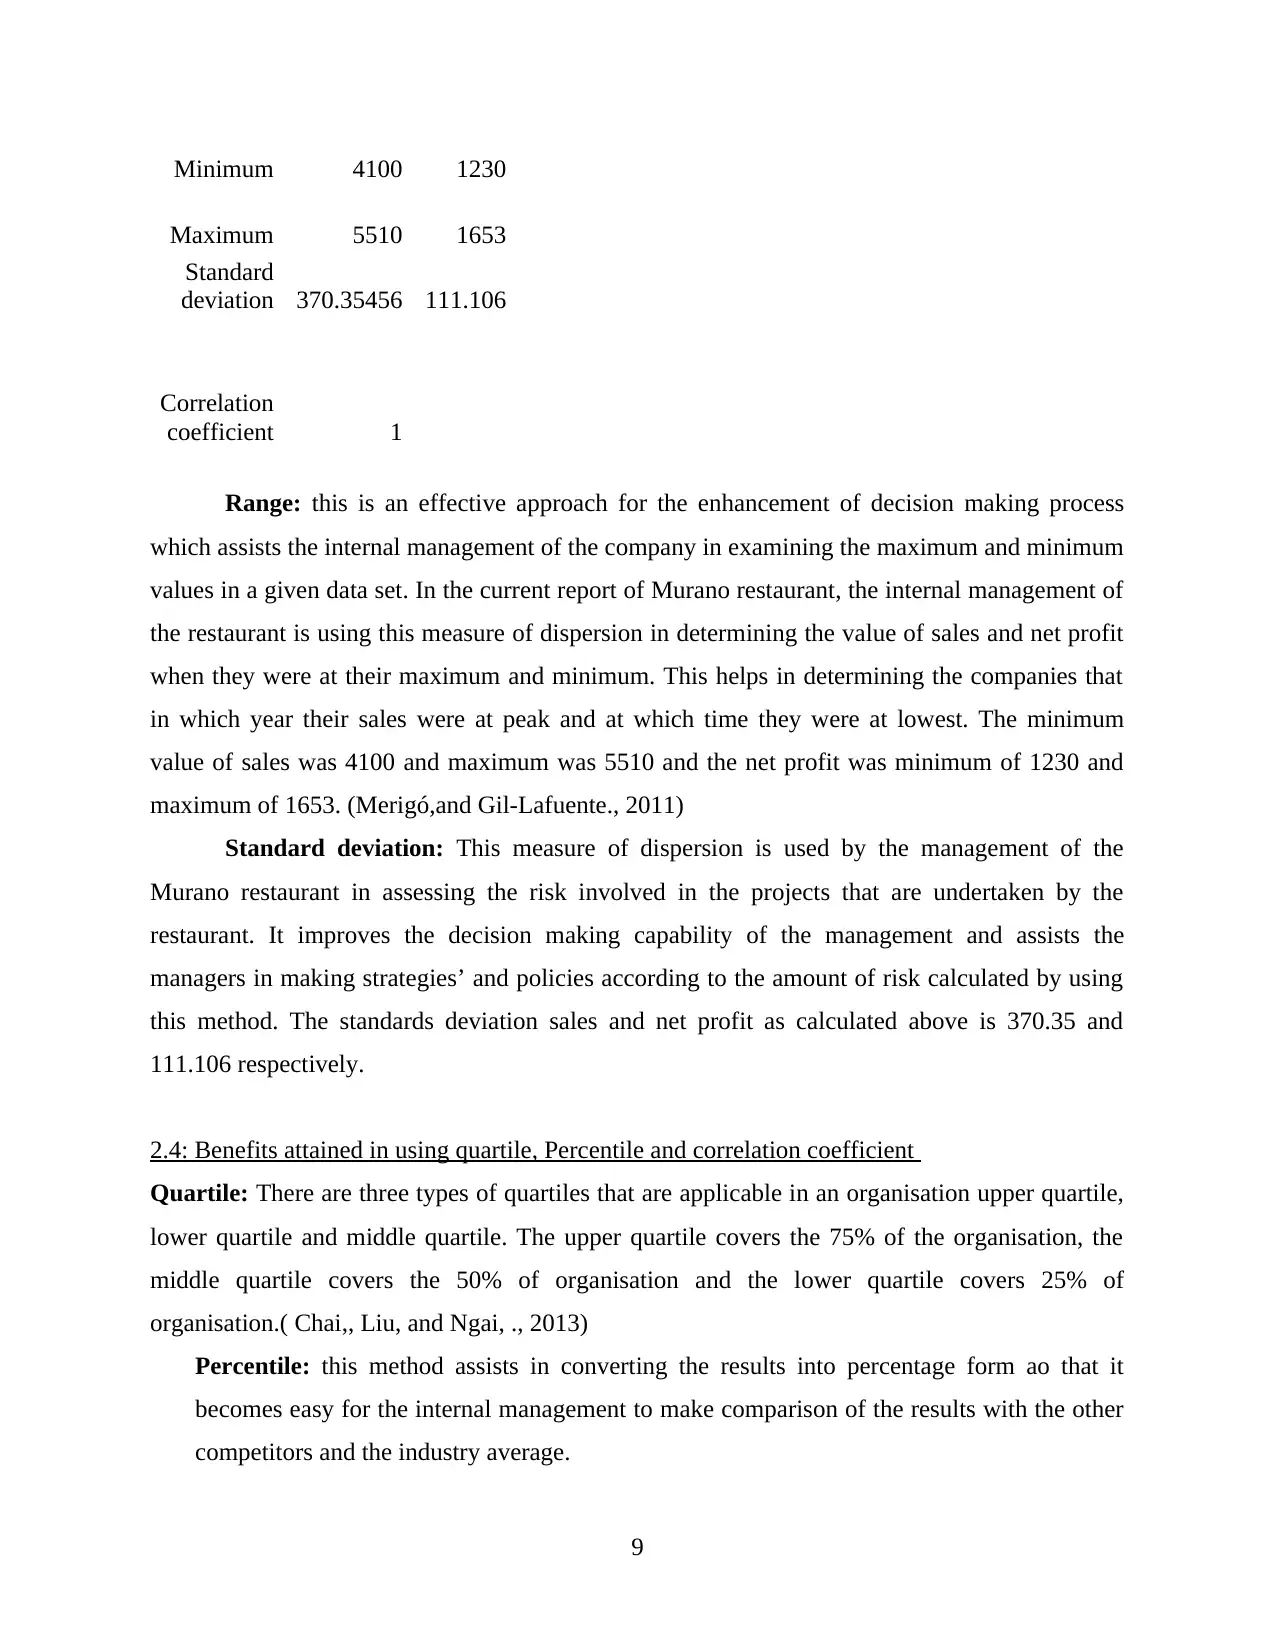
Minimum 4100 1230
Maximum 5510 1653
Standard
deviation 370.35456 111.106
Correlation
coefficient 1
Range: this is an effective approach for the enhancement of decision making process
which assists the internal management of the company in examining the maximum and minimum
values in a given data set. In the current report of Murano restaurant, the internal management of
the restaurant is using this measure of dispersion in determining the value of sales and net profit
when they were at their maximum and minimum. This helps in determining the companies that
in which year their sales were at peak and at which time they were at lowest. The minimum
value of sales was 4100 and maximum was 5510 and the net profit was minimum of 1230 and
maximum of 1653. (Merigó,and Gil-Lafuente., 2011)
Standard deviation: This measure of dispersion is used by the management of the
Murano restaurant in assessing the risk involved in the projects that are undertaken by the
restaurant. It improves the decision making capability of the management and assists the
managers in making strategies’ and policies according to the amount of risk calculated by using
this method. The standards deviation sales and net profit as calculated above is 370.35 and
111.106 respectively.
2.4: Benefits attained in using quartile, Percentile and correlation coefficient
Quartile: There are three types of quartiles that are applicable in an organisation upper quartile,
lower quartile and middle quartile. The upper quartile covers the 75% of the organisation, the
middle quartile covers the 50% of organisation and the lower quartile covers 25% of
organisation.( Chai,, Liu, and Ngai, ., 2013)
Percentile: this method assists in converting the results into percentage form ao that it
becomes easy for the internal management to make comparison of the results with the other
competitors and the industry average.
9
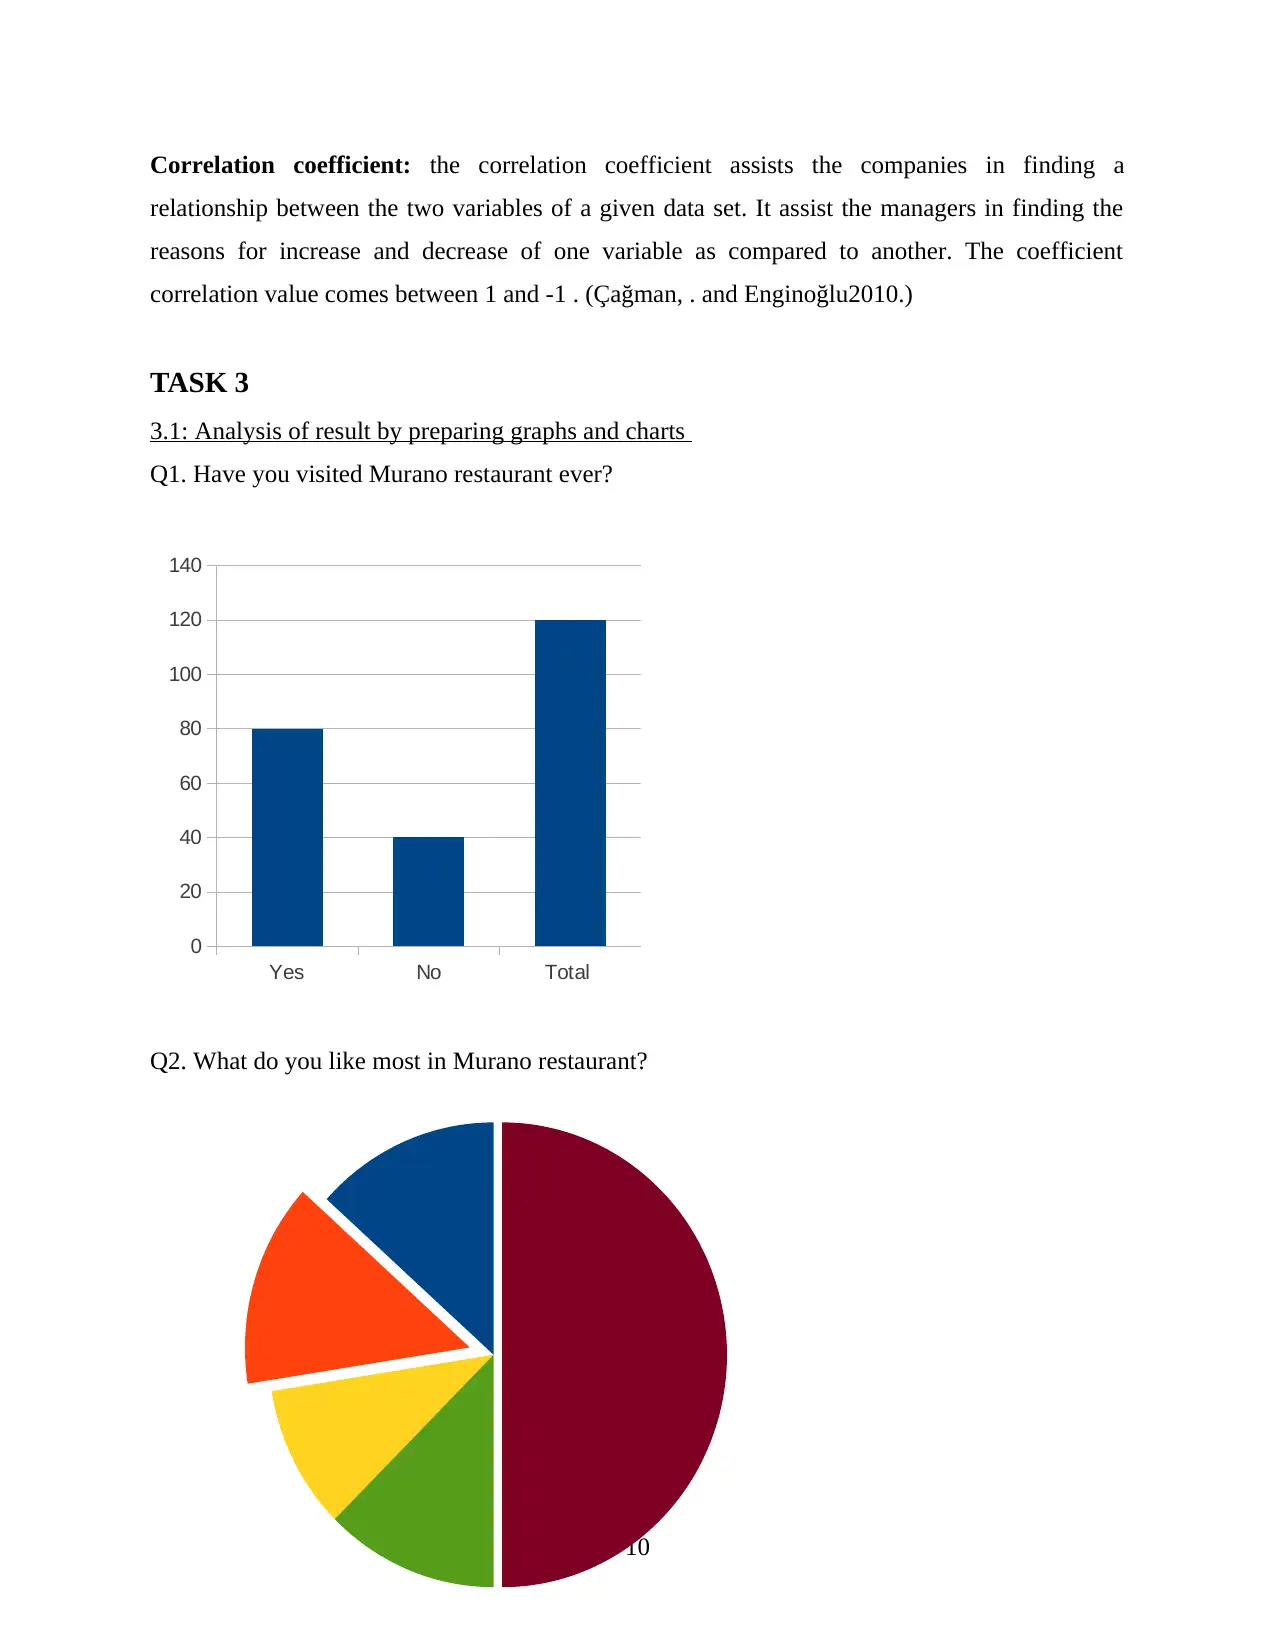
Correlation coefficient: the correlation coefficient assists the companies in finding a
relationship between the two variables of a given data set. It assist the managers in finding the
reasons for increase and decrease of one variable as compared to another. The coefficient
correlation value comes between 1 and -1 . (Çağman, . and Enginoğlu2010.)
TASK 3
3.1: Analysis of result by preparing graphs and charts
Q1. Have you visited Murano restaurant ever?
Q2. What do you like most in Murano restaurant?
10
Yes No Total
0
20
40
60
80
100
120
140
⊘ This is a preview!⊘
Do you want full access?
Subscribe today to unlock all pages.
Trusted by 1+ million students worldwide
1 out of 23
Related Documents


Your All-in-One AI-Powered Toolkit for Academic Success.
+13062052269
info@desklib.com
Available 24*7 on WhatsApp / Email
![[object Object]](/_next/static/media/star-bottom.7253800d.svg)
Unlock your academic potential
Copyright © 2020–2026 A2Z Services. All Rights Reserved. Developed and managed by ZUCOL.