Business Decision Making Report: Data Analysis for Tour Firm

Verified

Added on  2020/01/28

|27
|4742
|41
Report
AI Summary
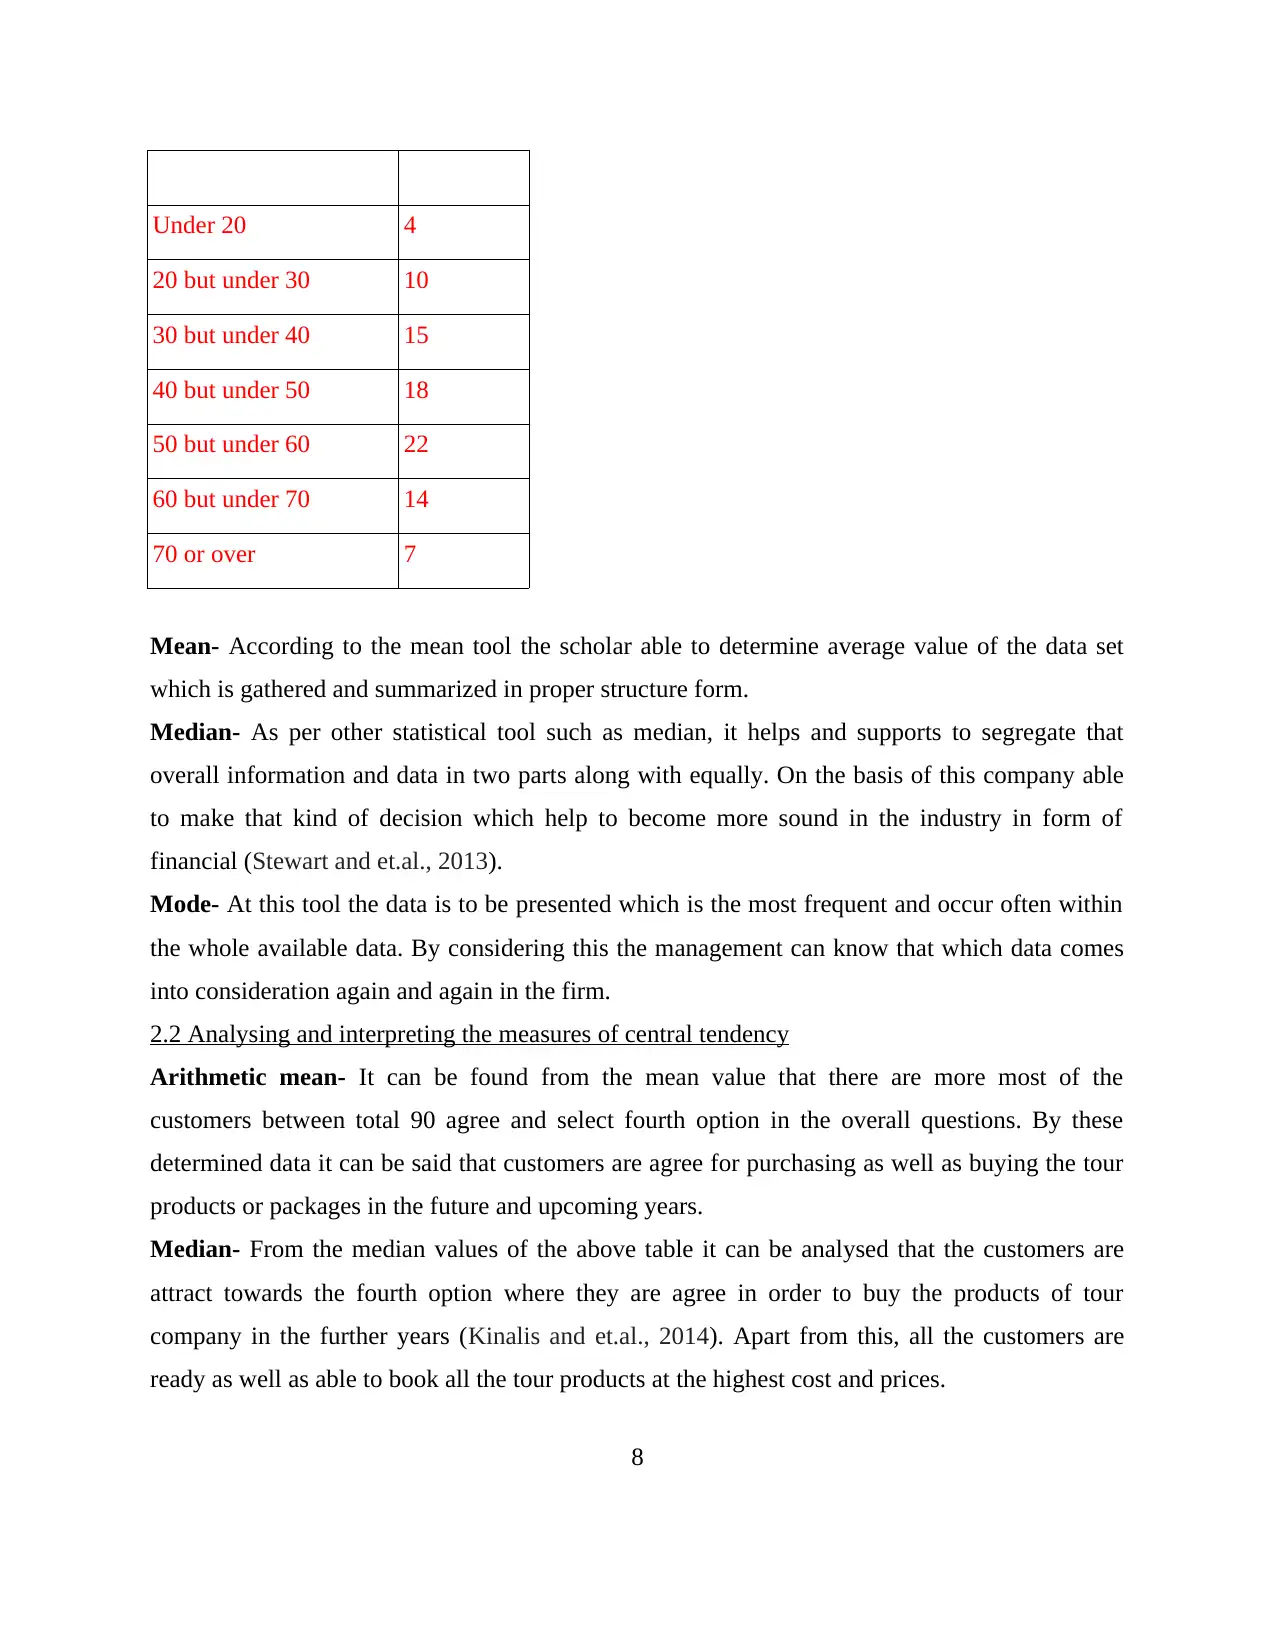
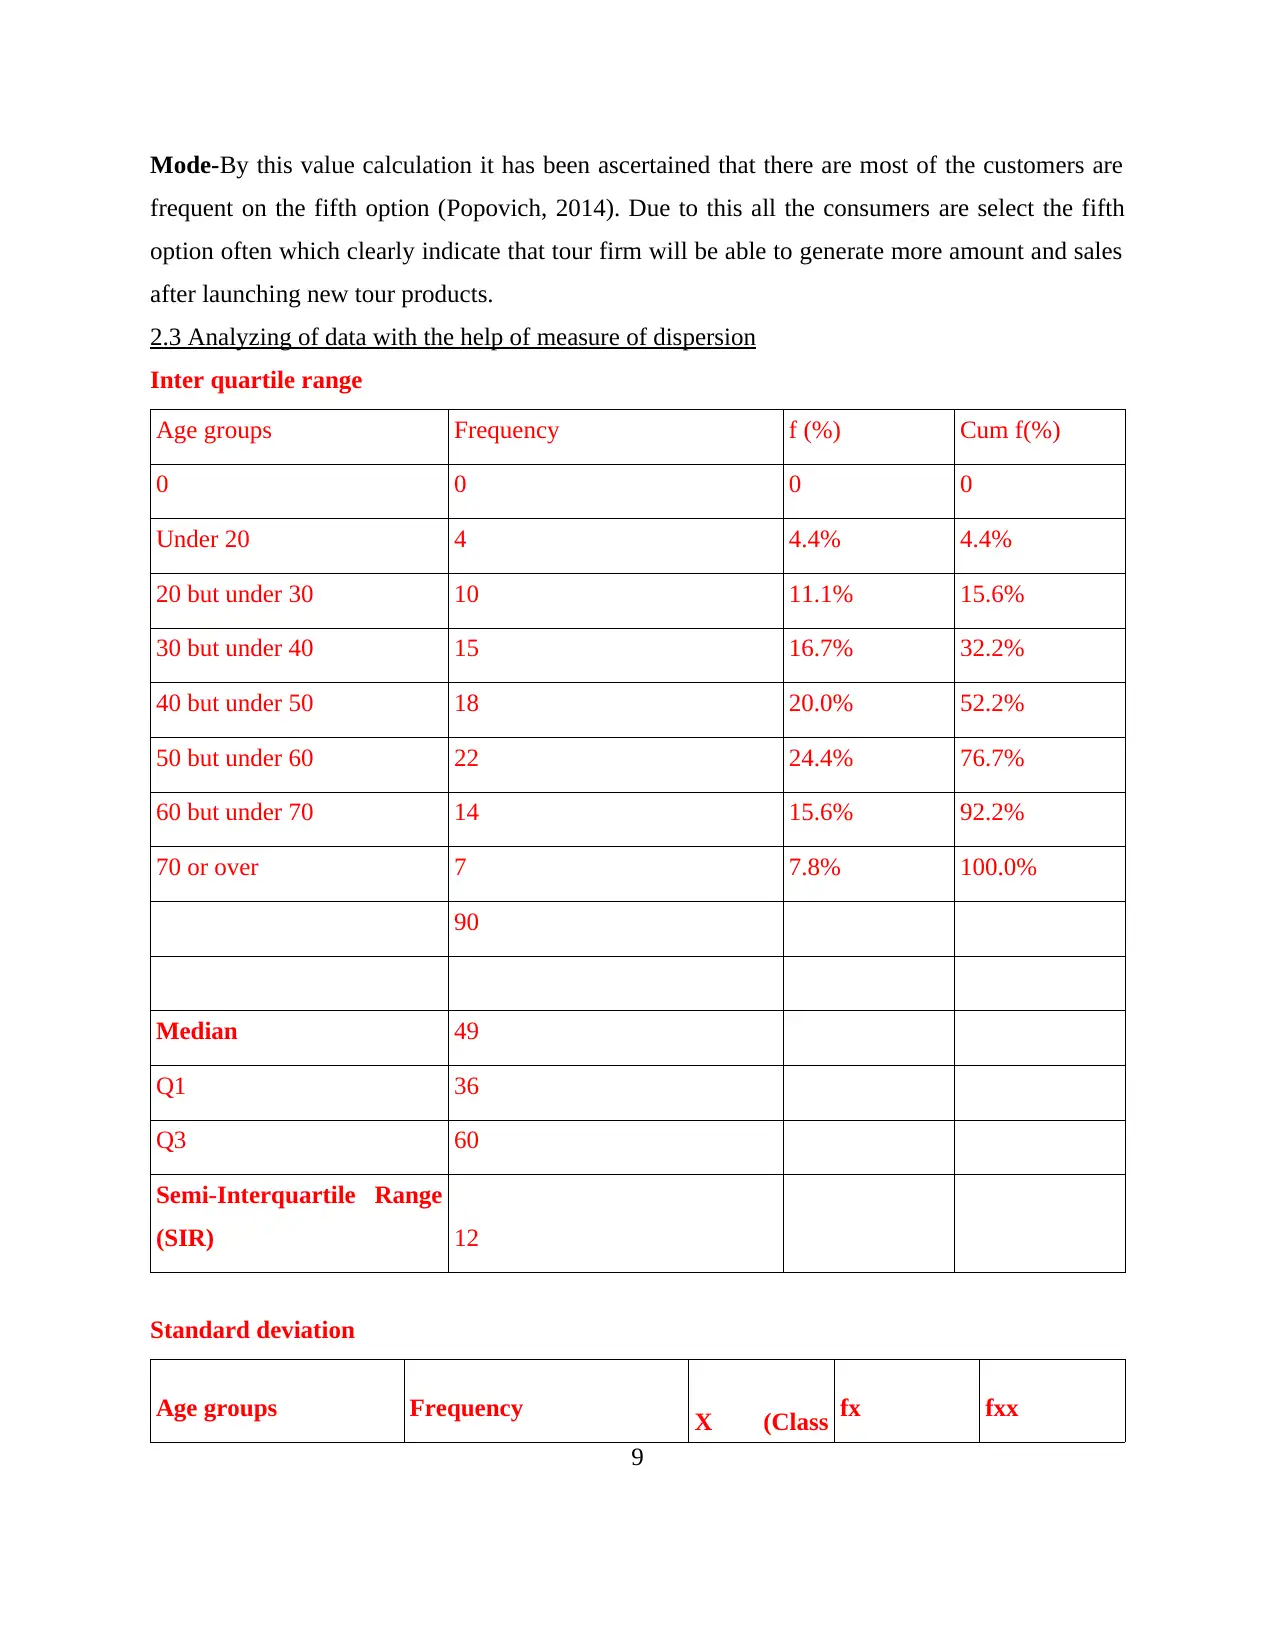
This report analyzes the application of business decision-making principles within a tour company context. It begins with an introduction to the complexities of business and the need for research to inform decisions, particularly in launching a new tour product. The report details data collection methods, primarily using questionnaires distributed to local communities, and outlines the survey methodology and sampling techniques employed. It presents the design of the research questionnaire and summarizes the collected data, applying measures of central tendency (mean, median, mode) and dispersion (interquartile range, standard deviation) to interpret customer preferences. The report further analyzes data using quartiles, percentiles, and correlation coefficients, followed by graphical representations using pie charts, bar charts, and line charts to visualize sales and customer demographics. Finally, the report touches upon project management and financial tools used to make informed business decisions for the tour firm. The report demonstrates how data analysis supports strategic choices in the tourism industry.
tabler-icon-diamond-filled.svg

Contribute Materials

Your contribution can guide someone’s learning journey. Share your documents today.
Document Page
BUSINESS DECISION
MAKING
1
tabler-icon-diamond-filled.svg

Secure Best Marks with AI Grader

Need help grading? Try our AI Grader for instant feedback on your assignments.
Document Page
2
Document Page
INTRODUCTION
In every kinds of business organizations there are various types of complexities and
problems come into consideration and hamper the firm. for this condition there are research
needed for identifying reasons and causes of occurring such problems and make appropriate
decisions. In the current project a tour company is going to launch a new tour product and for
which research is carry out to take views of the local community. The overall current report is
divided in four parts where first part is about the data collection as well as survey methodology.
Second part of the project shows different kinds of statistical tools which are used for taking
effectual business decisions. Furthermore, the third and fourth task of the project shows
graphical representation of data as well as project management and financial tools respectively
for taking the decisions in tour firm.
TASK 1
1.1 Identification of collecting research data from different sources
For carry out particular research in order to resolve business problems there are data and
information plays an integral role. Because without availability of the appropriate data the
company cannot analyse problem and make decisions. There are mainly two kinds of data which
are such as primary and secondary and derived using its respective tools (Taylor, Bogdan and
DeVault, 2015). In the current report primary sources are used because it is based on the primary
information and data where questionnaire and survey method is consisted. The questionnaire is
prepared and distributed between the local community and assessed that regarding tour product
what they thinks and requires. By this tour producer easily know that which kind of destinations
and products it needs to made and up to which costs and prices.
At the present situation the data are collected with the help of primary source which is
like questionnaire for gathering reliable information. In the primary data collection various
number of sources are available which are such as questionnaire, survey, interview, group
discussions etc. On the other side to collect data of secondary type there are available sources are
like publications, newspapers, articles, annual report of the company etc. To collect and derive of
sales value the scholar use annual report of the tour company. In the report sales and revenue of
different destinations is given and by taking help of that charts are made. In this, questionnaire
3
Document Page
which are prepared are to be given to 90 number of local community and then feedback as well
as suggestions are to be taken from such respondents.
1.2 Presenting the survey methodology and sampling technique
The method by which overall survey is to be conducted and data are derived is known as
survey methodology. In the current scenario for derive data questionnaire are distributed with the
help of internet under which mainly two sources are used like as social networks and email.
Further, feedbacks are also taken from the respondents using same methodology (Kerr and et.al.,
2014). Apart from this for take the sample data simple random sampling technique is used where
scholar derive sample randomly. In this case sample of 90 local community is taken and reason
for doing survey on local community is that the tour producer going to launch destinations for
the people.
1.3 Designing research questionnaire
Questionnaire
Name _______________
Gender _____________
Que. 1. Age group of your under which you belongs ?
20-35 years
35-50 years
50-65 years
65 years and more
Que. 2: Up to which extent you agree that, tour products as well as services which are provided
to you fulfill your satisfaction and requirements ?
Higher extent
high extent
Neutral
4
tabler-icon-diamond-filled.svg

Secure Best Marks with AI Grader

Need help grading? Try our AI Grader for instant feedback on your assignments.
Document Page
Low level
Lower extent
Que. 3: How frequent you used to purchase tour packages of various number of destinations
within every one year ?
Once in a month
Twice in a year
Once in a year
Thrice in a year
Very rarely
Que. 4: Do you agree that, in the future years you will definitely buy tour product for
destination A which is Morocco ?
Highly disagree
Disagree
Neutral
Agree
Highly agree
Que. 7: Up to which extent of the amount of tour product you will be ready to purchase for
destination A which is Morocco for every member ?
£500 but less than 525
£525 but less than 550
£550 but less than 575
£575 but less than 600
£600 but less than 625
Que. 6: Do you agree that, in the future years you will definitely buy tour product for
5
Document Page
destination B which is Turkey ?
Highly disagree
Disagree
Neutral
Agree
Highly agree
Que. 7: Up to which extent of the amount of tour product you will be ready to purchase for
destination B which is Turkey for every member ?
£500 but less than 525
£525 but less than 550
£550 but less than 575
£575 but less than 600
£600 but less than 625
Que. 8: Do you agree that, in the future years you will definitely buy tour product for
destination C which is Cuba ?
Strongly disagree
Disagree
Neutral
Agree
Strongly agree
Que. 9: Up to which extent of the amount of tour product you will be ready to purchase for
destination C which is Cuba for every member ?
£700 but less than 725
6
Document Page
£725 but less than 750
£750 but less than 775
£775 but less than 800
£800 but less than 825
Que. 10: Do you agree that, in the future years you will definitely buy tour product for
destination D which is Dubai ?
Highly disagree
Disagree
Neutral
Agree
Highly agree
Que. 11: Up to which extent of the amount of tour product you will be ready to purchase for
destination D which is Dubai for every member ?
£800 but less than 825
£825 but less than 850
£850 but less than 875
£875 but less than 900
TASK 2
2.1 Summarization of the collected data
In the current case for carry out research on the tour firm there are data is collected by the
respondents using questionnaire method (Palinkas and et.al., 2015). On the basis of every
question data gathered and on it different measures of central tendency are applied. Further, such
calculation is given as below:
Age groups Frequency
7
tabler-icon-diamond-filled.svg

Paraphrase This Document

Need a fresh take? Get an instant paraphrase of this document with our AI Paraphraser
Document Page
Under 20 4
20 but under 30 10
30 but under 40 15
40 but under 50 18
50 but under 60 22
60 but under 70 14
70 or over 7
Mean- According to the mean tool the scholar able to determine average value of the data set
which is gathered and summarized in proper structure form.
Median- As per other statistical tool such as median, it helps and supports to segregate that
overall information and data in two parts along with equally. On the basis of this company able
to make that kind of decision which help to become more sound in the industry in form of
financial (Stewart and et.al., 2013).
Mode- At this tool the data is to be presented which is the most frequent and occur often within
the whole available data. By considering this the management can know that which data comes
into consideration again and again in the firm.
2.2 Analysing and interpreting the measures of central tendency
Arithmetic mean- It can be found from the mean value that there are more most of the
customers between total 90 agree and select fourth option in the overall questions. By these
determined data it can be said that customers are agree for purchasing as well as buying the tour
products or packages in the future and upcoming years.
Median- From the median values of the above table it can be analysed that the customers are
attract towards the fourth option where they are agree in order to buy the products of tour
company in the further years (Kinalis and et.al., 2014). Apart from this, all the customers are
ready as well as able to book all the tour products at the highest cost and prices.
8
Document Page
Mode-By this value calculation it has been ascertained that there are most of the customers are
frequent on the fifth option (Popovich, 2014). Due to this all the consumers are select the fifth
option often which clearly indicate that tour firm will be able to generate more amount and sales
after launching new tour products.
2.3 Analyzing of data with the help of measure of dispersion
Inter quartile range
Age groups Frequency f (%) Cum f(%)
0 0 0 0
Under 20 4 4.4% 4.4%
20 but under 30 10 11.1% 15.6%
30 but under 40 15 16.7% 32.2%
40 but under 50 18 20.0% 52.2%
50 but under 60 22 24.4% 76.7%
60 but under 70 14 15.6% 92.2%
70 or over 7 7.8% 100.0%
90
Median 49
Q1 36
Q3 60
Semi-Interquartile Range
(SIR) 12
Standard deviation
Age groups Frequency X (Class fx fxx
9
Document Page
mid point)
Under 20 4 15 60 900
20 but under 30 10 25 250 6250
30 but under 40 15 35 525 18375
40 but under 50 18 45 810 36450
50 but under 60 22 55 1210 66550
60 but under 70 14 65 910 59150
70 or over 7 75 525 39375
Mean 47.7
Variance 250.7
Standard deviation 15.8
Interpretation
By visualizing the above tables of computation it can be found that at the middle quartile
or inter quartile range value in whole questions is such as zero (Zsambok and Klein, 2014). Apart
from this on the basis of standard deviation it can be interpreted that it is far from the mean and
average value which is better for it. By such value the tour operator will be benefited after
launching its new products and services. From the current calculation it can be interpreted that on
an average there is 47.7 or 48 years old customers use the services of tour company. In such age
group there is 18 number of tourists go for tour which deviate from the standard value up to the
higher value which is like 15.8.
2.4 Computation and analysis of quartile, percentile and correlation
Quartiles
10
tabler-icon-diamond-filled.svg

Secure Best Marks with AI Grader

Need help grading? Try our AI Grader for instant feedback on your assignments.
Document Page
Correlation of Coefficient
11
Document Page
Interpretation
Tool of measure of dispersion such as quartile as well as percentile support to the
investigator and researcher in order to break the overall data set in equal four divisions (Popovič
and et.al., 2012). It can be said that each level of quartile like as upper, lower and middle the
value comes one. In the present case correlation value comes at 0.35 which clearly provides
information that there is positive relationship but not that much strong. It shows that if in the one
variable 100% changes arises then in another variable 35% changes will be there.
TASK 3
3.1 Graphical representation of the data set using several graphs and charts
Pie chart
For the financial year 2014
12
Document Page
931
959
1104
713
For the financial year 2015
957
997
1163
769
For the financial year 2016
13
tabler-icon-diamond-filled.svg

Paraphrase This Document

Need a fresh take? Get an instant paraphrase of this document with our AI Paraphraser
Document Page
1008
1035
1189
811
Bar Chart
For the financial year 2014
Q1
Q2
Q3
Q4
0 200 400 600 800 1000 1200
931
959
1104
713
For the financial year 2015
14
Document Page
Q1
Q2
Q3
Q4
0 200 400 600 800 1000 1200 1400
957
997
1163
769
For the financial year 2016
Q1
Q2
Q3
Q4
0 200 400 600 800 1000 1200 1400
1008
1035
1189
811
Line chart
For the financial year 2014
15
Document Page
Q1 Q2 Q3 Q4
0
200
400
600
800
1000
1200
931 959
1104
713
For the financial year 2015
Q1 Q2 Q3 Q4
0
200
400
600
800
1000
1200
1400
957 997
1163
769
For the financial year 2016
16
tabler-icon-diamond-filled.svg

Secure Best Marks with AI Grader

Need help grading? Try our AI Grader for instant feedback on your assignments.
Document Page
Q1 Q2 Q3 Q4
0
200
400
600
800
1000
1200
1400
1008 1035
1189
811
Ages of customers of the tour company
U n d er 2 0 2 0 b u t
u n d er 3 0
3 0 b u t
u n d er 4 0
4 0 b u t
u n d er 5 0
5 0 b u t
u n d er 6 0
6 0 b u t
u n d er 7 0
7 0 or ov er
0
5
1 0
1 5
2 0
2 5
A g e s o f c u s to m e rs o f T o u r c o m p a n y
Ag es
N um be r of c us tom ers
Histogram of ages of customers of the tour company
17
Document Page
U n d er 2 0 2 0 b u t
u n d er 3 0
3 0 b u t
u n d er 4 0
4 0 b u t
u n d er 5 0
5 0 b u t
u n d er 6 0
6 0 b u t
u n d er 7 0
7 0 or ov er
0
5
1 0
1 5
2 0
2 5
H is to g ra m o f a g e s o f c u s to m e rs o f T o u r c o m p a n y
Ag es
N um be r of c us tom ers
Ogive chart of ages of customers of the tour company
3 0 /1 2 /1 8 9
9
U n d er 2 0 2 0 b u t
u n d er 3 0
3 0 b u t
u n d er 4 0
4 0 b u t
u n d er 5 0
5 0 b u t
u n d er 6 0
6 0 b u t
u n d er 7 0
7 0 or ov er
0 %
2 5 %
5 0 %
7 5 %
1 0 0 %
O g iv e o f a g e s o f c u s to m e rs
Ag es
Freque nc y (% )
Interpretation
All the above charts like as pie, line as well as bar graphs shows the level of sales and
revenue generated by the tour destinations at each four quarters. Further, amount of the sales is to
be analysed at year for the 3 years which is such as from FY 2014 to FY 2016. It can be
interpreted after considering the entire above presented graph that in every year the sales of all
tour products increases from the quarter one (Q1) to the quarter three (Q3) (Mullins, Walker and
Boyd Jr, 2012). Further, after Q3 sales reduces in each and every year because of seasonality as
well as weak strategies. It has been found that in the year 2014 its performance is very low as
18
Document Page
compare to the other years. Apart from this at the end of FY 2015 and 2016 performance in
terms of generates revenue is good because in such both periods there is very little and minor
difference. From the Histogram it can be analysed that when tourists are of the increasing age
then number of customers enhances on consistent basis. Apart from this, as ages of the customers
decline then less number of tourists take interest for go on the tour.
3.2 Creating the trend line
Trend line for South America
Q1 Q2 Q3 Q4 Q1 Q2 Q3 Q4 Q1 Q2 Q3 Q4 Q1 Q2 Q3 Q4 Q1 Q2 Q3
2 0 1 4 2 0 1 5 2 0 1 6 2 0 1 7 2 0 1 8
0
5
1 0
1 5
2 0
2 5
3 0
3 5
4 0
Interpretation
The line which shows that in the upcoming year the company such as tour business will
be in profitable or non profitable situation is identified as trend line. It can be interpreted from
trend lines that in the next fiscal year such as 2017 the South America destination will be
profitable. Apart from this at the end of year like 2018 the South America will generate more
sales because the trend line having increasing trend over the years. On the basis of present trend
line firm needs to focus on South America destination because it provides positive and increasing
kind of revenue from FY 2014 to 2016.
3.3 Preparation of business presentation
3.4 Preparation of formal business report
To,
The board of director,
Tour operator business organisation,
Date- 22nd April 2017
19
tabler-icon-diamond-filled.svg

Paraphrase This Document

Need a fresh take? Get an instant paraphrase of this document with our AI Paraphraser
Document Page
Subject- Launching the Tour products
Introduction
The current report is on the basis of analyzing business performance of the tour company
using the financial data such as sales or revenue. It shows revenue of the tour firm of four
quarters from the FY 2014 to FY 2016.
Data analysis and findings
In this report in order to analyse the business problems data are gathered using the
primary source such as questionnaire and online survey method. Hence, it is based on the
primary data which ate collected by the 90 customers. It has been found that in all the fiscal
years there is same condition at every quarter. The same situation is that from Q1 to Q3 sales
declines consistently and then increase for one quarter that is Q4. When talking about the overall
performance that 2014 giving lower sales to the entity and other both the years provide higher
revenue compare to first one.
Conclusion & Suggestions
It can be concluded that in the year 2015 and 2016 ability to generate revenue of the tour
destination is better compare to the FY 2014. Further, it can be suggested that it needs to make
attractive strategies and tactics for the quarter four in order to increase sales.
TASK 4
4.1 Explanation of suitable information processing tools
Transaction Process System (TPS)- It is a highly used and adopted by an individual business
for take and analyse day to day records of each and every financial transactions in better way. On
the basis of this respective information processing tool the company record all kinds of financial
transactions whether they are related to production, administration or any other. Hence, by
considering this system the company takes informations regarding to the financial aspects which
comes into consideration at the working environment (Schneeweiss, 2012).
Management Information System (MIS)- Another information processing technique is
management information system which is used by the organisation and tour operator in order to
derive management oriented reports as well as decisions. It is used by the managers for derive
performance of junior managers as well as employees by keeping record of various data.
20
Document Page
Decision Support system (DSS)- It is one kind of computer based processing tool under those
complex decisions are taken which comes into existence at the workplace. Further, it is used by
senior managers and high level management parties to assess and make highly complex as well
as typical kind of problems and obstacles (Ghattas, Soffer and Peleg, 2014).
Executive information System- Under such kind of information processing technique or
method the executives able to make decisions for the business for make it healthier in the
industry. Other name of respective system is executive support system (ESS) which requires for
the CEO, CFO etc. of the firm.
4.2 preparation of project plan and using project management tool for derive critical path
S. No. Name of activity Activity Preceding activity Duration (in days)
1
Search about the current trend of
market A - 18
2
Analyse and search about the
customers and people of the
country B A 12
3
Selecting delivery mode of the
tour items C B 11
4
Raising capital for tour project
from several financing sources. D B, C 10
5
Formulate the appropriate
schedule and plan E D 13
6
Implementation and execution of
the plan of tour product F E 9
7
Launch of the new tour products
and services G E, F 6
21
Document Page
Gantt Chart
Network Diagram
Interpretation
Project management is a technique which is used by each and every company in order to
determine each activity of the overall project in appropriate way. Further, by considering the
network diagram as well as Gantt chart the project manager able to allocate tasks and work
because all the activities are clearly shown at over here. These both the tools and methods of the
project management the overall company as well as tour operator can know that how to launch
the new product in the market (Baležentis, Baležentis and Brauers, 2012). With this it has been
22
tabler-icon-diamond-filled.svg

Secure Best Marks with AI Grader

Need help grading? Try our AI Grader for instant feedback on your assignments.
Document Page
analysed that after completion of one activity of project another is which one comes into
consideration. Hence, it can be clearly identified as well as said that it is tool which provide clear
and appropriate instructions to the project manager along with the whole team. Apart from this,
using network diagram the tour company assess critical path which is highly compulsory for the
company while adopting a new project at the workplace. In the current case, critical path for
launching new tour product is stated below:
Critical path = 2+3+4+5+6+7
On the basis of the above state critical path time will be taken to launch new tour product
in the market is shown as below:
Time duration = 18+12+11+10+13+9+6 = 79 days.
Hence, by assessing above calculation it has been derived that for launch the new tour
destination total 79 days will be taken by the firm.
4.3 Use financial tools to test feasibility
There are many varieties of the financial tools which are used for assessing feasibility and
viability of one project at the time of having two more simultaneous projects (Chai, Liu and
Ngai, 2013). In the current case the tour operator has total four products and destinations at
where different kinds of costs which are used to determine cash flow which is stated as below:
Calculation of determining Cash flow of the different tour destinations:
Name of the
Tour product
Investment at
the initial
Variable cost
(CC)
Fixed cost
(FC)
Profit and
income
Cash
flow(VC+FC)
Tour A
(Morocco)
520000 500 225000 90200 315700
Tour B
( Turkey)
475000 475 250000 100190 350665
Tour C
(Cuba)
459000 775 275000 110310 386085
Tour D
(Dubai)
550000 850 300000 120340 421190
23
Document Page
In order to calculate the cash flow of every tour product there is three kinds of values are
considered and added which are such as fixed cost, variable costs as well as profit and income.
For every tour product there is only one year is given rather than more than one years. Because
of such accountable factor in the present era NPV and IRR are to be calculated for one year and
on the basis of that conclusion is to be made.
NPV (Net Present Value)-
Name of the
Tour product
Investment at
the initial
Cash flow PV@9% Present value
(PV)
NPV
Tour A
(Morocco)
520000 315700 0.526 166157.89 -353842.10
Tour B
( Turkey)
475000 350665 0.526 184560.52 -290439.47
Tour C
(Cuba)
459000 386085 0.526 203202.63 -255797.37
Tour D
(Dubai)
550000 421190 0.526 221678.95 -328321.05
IRR (Internal Rate of return)-
Name of the Tour
product
Investment at the
initial
Cash flow IRR
Tour A (Morocco) -520000 315700 -39.29%
Tour B ( Turkey) -475000 350665 -26.18%
Tour C (Cuba) -459000 386085 -15.89%
Tour D (Dubai) -550000 421190 -23.42%
Net present value is a financial tool under which different of present value of the project
as well as initial investment is to be analysed. Apart from this internal rate of return indicates that
after completion of the whole project average return will be up to which level. By comparing all
products using such value appropriate decision to put money is to be taken (Masini and
Menichetti, 2012). In the current case study all the tour destinations and products has negative
24
Document Page
NPV as well as negative IRR which is unfavorable for it. On the basis of such negative values
the tour firm not needs to make investment in anyone. But even firm wants to launch a product
then it can be suggested that it needs to launch tour C (Cuba) which has lower negative NPV and
IRR such as -255797.37 GBP and -15.89% respectively.
CONCLUSION
It can be articulated from the business decision making report that most of the
respondents as well as customers agree for buying the tour destination in the future and
upcoming years. Moreover, the data are gathered for analyzing the research problem with the
help of primary source such as questionnaire. From the third part it can be concluded that the
company able to generate sales in increasing trend from Q1 to Q3 and after that level of revenue
reduces in all the years like as 2014, 2015 and 2016. Apart from this, by considering the last part
it can be suggested to the tour company that it needs to pick tour product C (Cuba) which has
lowers risk.
25
tabler-icon-diamond-filled.svg

Paraphrase This Document

Need a fresh take? Get an instant paraphrase of this document with our AI Paraphraser
Document Page
REEFERENCES
Journals and Books
Baležentis, A., Baležentis, T. and Brauers, W. K., 2012. MULTIMOORA-FG: a multi-objective
decision making method for linguistic reasoning with an application to personnel
selection. Informatica. 23(2). pp. 173-190.
Chai, J., Liu, J. N. and Ngai, E. W., 2013. Application of decision-making techniques in supplier
selection: A systematic review of literature. Expert Systems with Applications. 40(10). pp.
3872-3885.
Ghattas, J., Soffer, P. and Peleg, M., 2014. Improving business process decision making based
on past experience. Decision Support Systems. 59. pp. 93-107.
Kerr, Z. Y. and et.al., 2014. National Collegiate Athletic Association Injury Surveillance System:
review of methods for 2004–2005 through 2013–2014 data collection. Journal of athletic
training. 49(4). pp. 552-560.
Kinalis, A. and et.al., 2014. Biased sink mobility with adaptive stop times for low latency data
collection in sensor networks. Information fusion. 15. pp. 56-63.
Masini, A. and Menichetti, E., 2012. The impact of behavioural factors in the renewable energy
investment decision making process: Conceptual framework and empirical
findings. Energy Policy. 40. pp. 28-38.
Mullins, J., Walker, O. C. and Boyd Jr, H. W., 2012. Marketing management: A strategic
decision-making approach. McGraw-Hill Higher Education.
Palinkas, L. and et.al., 2015. Purposeful sampling for qualitative data collection and analysis in
mixed method implementation research. Administration and Policy in Mental Health and
Mental Health Services Research. 42(5). pp. 533-544.
Popovič, A and et.al., 2012. Towards business intelligence systems success: Effects of maturity
and culture on analytical decision making. Decision Support Systems. 54(1). pp. 729-739.
Schneeweiss, C., 2012. Distributed decision making. Springer Science & Business Media.
Stewart, M. C. and et.al., 2013. A comparison of histomorphometric data collection
methods. Journal of forensic sciences. 58(1). pp. 109-113.
Taylor, S. J., Bogdan, R. and DeVault, M., 2015. Introduction to qualitative research methods: A
guidebook and resource. John Wiley & Sons.
26
Document Page
Zsambok, C. E. and Klein, G., 2014. Naturalistic decision making. Psychology Press.
Online
Popovich, S., 2014. 6 Secrets to Making Business Decisions That Get Results. [Online].
Available through: < https://www.entrepreneur.com/article/237562> [Accessed on 23rd
April 2017].
27
chevron_up_icon
1 out of 27
circle_padding
hide_on_mobile
zoom_out_icon
logo.png

Your All-in-One AI-Powered Toolkit for Academic Success.

Available 24*7 on WhatsApp / Email

[object Object]