Analysis and Business Decision Making Report: Thomas Cook
VerifiedAdded on 2019/12/18
|28
|4556
|272
Report
AI Summary
This report analyzes business decision-making within Thomas Cook, a prominent international tour operator. It begins with a comprehensive plan for data collection, detailing both primary and secondary sources, and emphasizes the importance of understanding consumer behavior through surveys and questionnaires. The report then outlines the survey methodology, including the sampling framework and a sample questionnaire designed to gather insights into customer preferences and travel habits. Data analysis employs measures of central tendency (mean, median, mode) and dispersion to interpret collected data, focusing on sales trends across various destinations and consumer preferences. Further analysis includes quartile, percentile, and correlation coefficient calculations, alongside trend line analysis to predict future sales. The report culminates in a business presentation and a detailed report for new product development, followed by an information processing tool, a project plan with a critical path, and a project evaluation method for launching a new tour product. The conclusion summarizes the findings, and references are provided for further study.

Business Decision Making
Paraphrase This Document
Need a fresh take? Get an instant paraphrase of this document with our AI Paraphraser
TABLE OF CONTENTS
Introduction.................................................................................................................................................3
Task 1...........................................................................................................................................................3
1.1 Plan for data collection......................................................................................................................3
1.2 Survey methodology and sampling framework.................................................................................4
1.3 Questionnaire ...................................................................................................................................5
Task 2...........................................................................................................................................................7
2.1 Measures of central tendency...........................................................................................................7
2.2 Analysis of results..............................................................................................................................7
2.3 Measures of dispersion......................................................................................................................8
2.4 Quartile, percentile and correlation coefficient.................................................................................9
TASK3...........................................................................................................................................................9
3.2 trend line.........................................................................................................................................13
3.3 Business presentation......................................................................................................................14
3.4 Business report for new product development...............................................................................14
Task 4.........................................................................................................................................................15
4.1 Information processing tool for the launch of a new tour product..................................................15
4.2 Project plan and critical path...........................................................................................................15
...............................................................................................................................................................18
4.3 Project evaluation method..............................................................................................................19
Conclusion.................................................................................................................................................20
References.................................................................................................................................................21
References.................................................................................................................................................21
⊘ This is a preview!⊘
Do you want full access?
Subscribe today to unlock all pages.
Trusted by 1+ million students worldwide
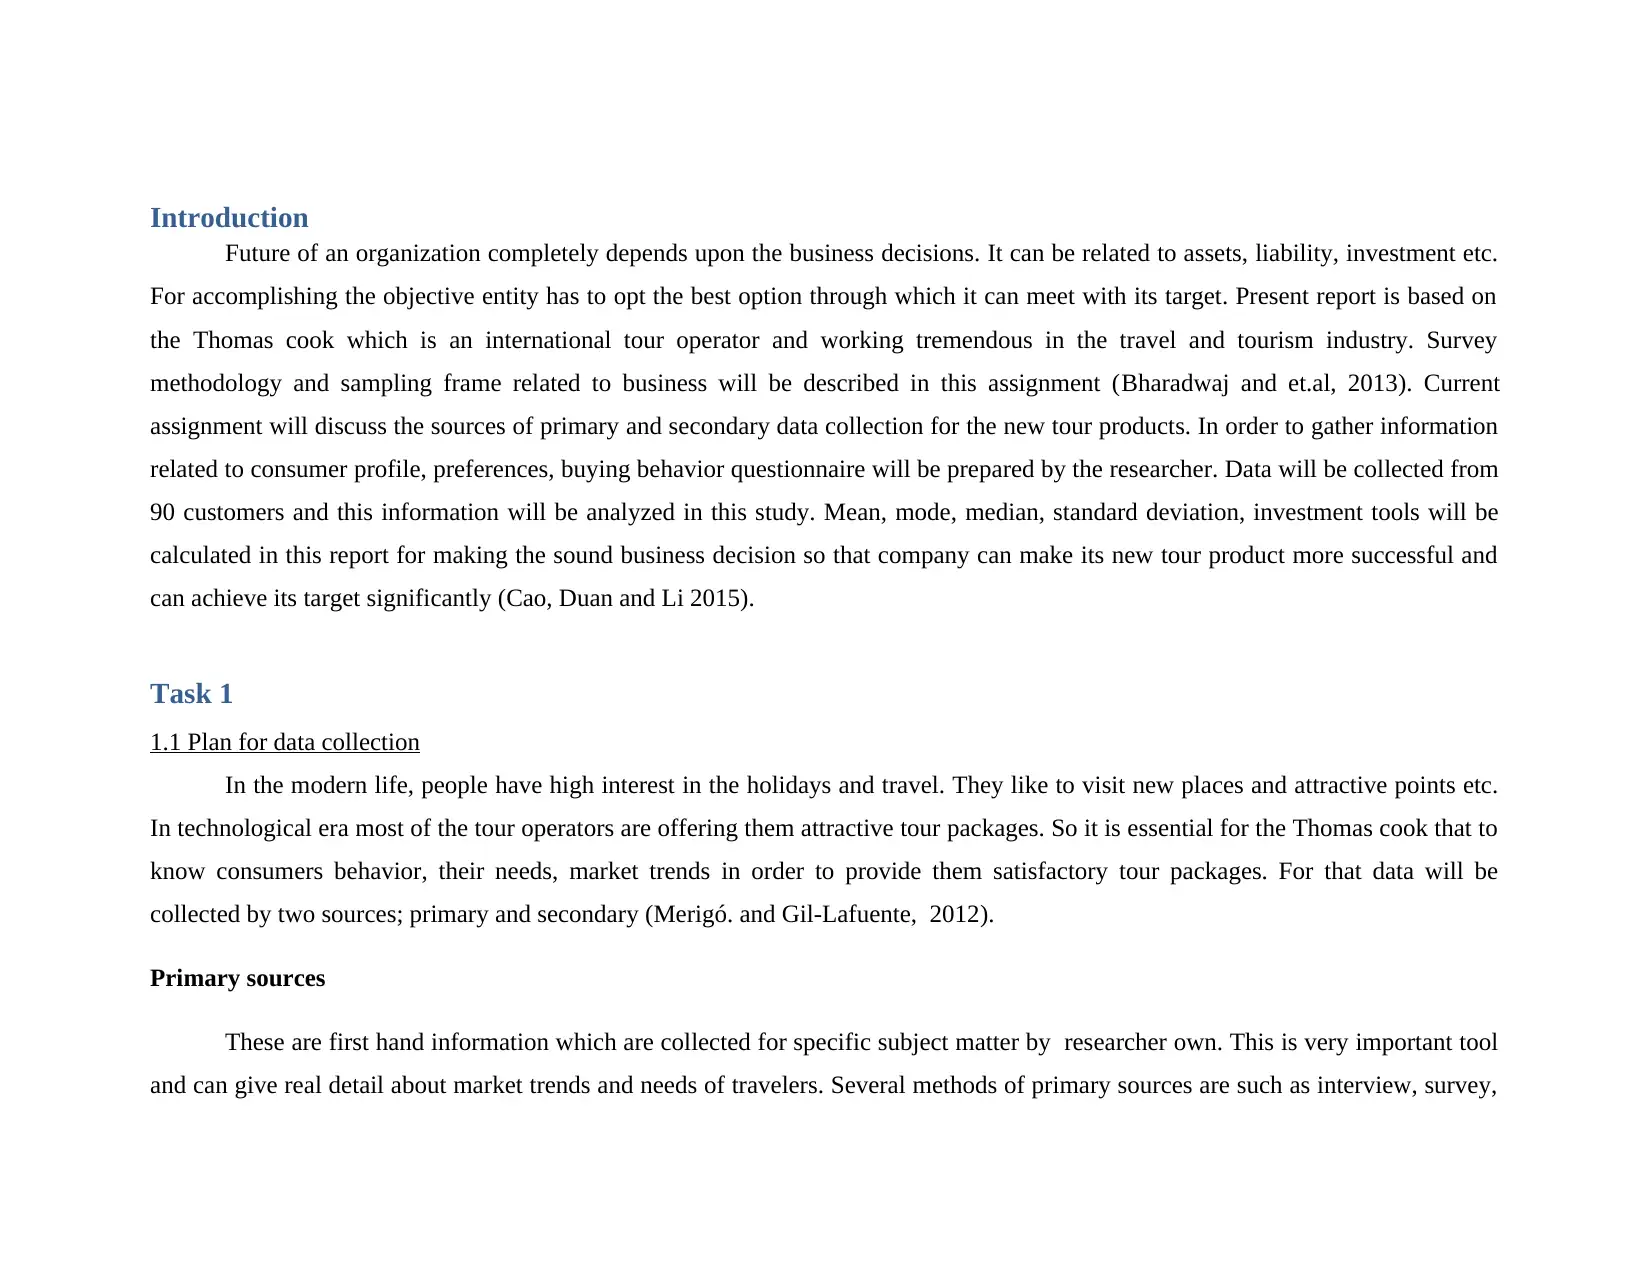
Introduction
Future of an organization completely depends upon the business decisions. It can be related to assets, liability, investment etc.
For accomplishing the objective entity has to opt the best option through which it can meet with its target. Present report is based on
the Thomas cook which is an international tour operator and working tremendous in the travel and tourism industry. Survey
methodology and sampling frame related to business will be described in this assignment (Bharadwaj and et.al, 2013). Current
assignment will discuss the sources of primary and secondary data collection for the new tour products. In order to gather information
related to consumer profile, preferences, buying behavior questionnaire will be prepared by the researcher. Data will be collected from
90 customers and this information will be analyzed in this study. Mean, mode, median, standard deviation, investment tools will be
calculated in this report for making the sound business decision so that company can make its new tour product more successful and
can achieve its target significantly (Cao, Duan and Li 2015).
Task 1
1.1 Plan for data collection
In the modern life, people have high interest in the holidays and travel. They like to visit new places and attractive points etc.
In technological era most of the tour operators are offering them attractive tour packages. So it is essential for the Thomas cook that to
know consumers behavior, their needs, market trends in order to provide them satisfactory tour packages. For that data will be
collected by two sources; primary and secondary (Merigó. and Gil-Lafuente, 2012).
Primary sources
These are first hand information which are collected for specific subject matter by researcher own. This is very important tool
and can give real detail about market trends and needs of travelers. Several methods of primary sources are such as interview, survey,
Paraphrase This Document
Need a fresh take? Get an instant paraphrase of this document with our AI Paraphraser
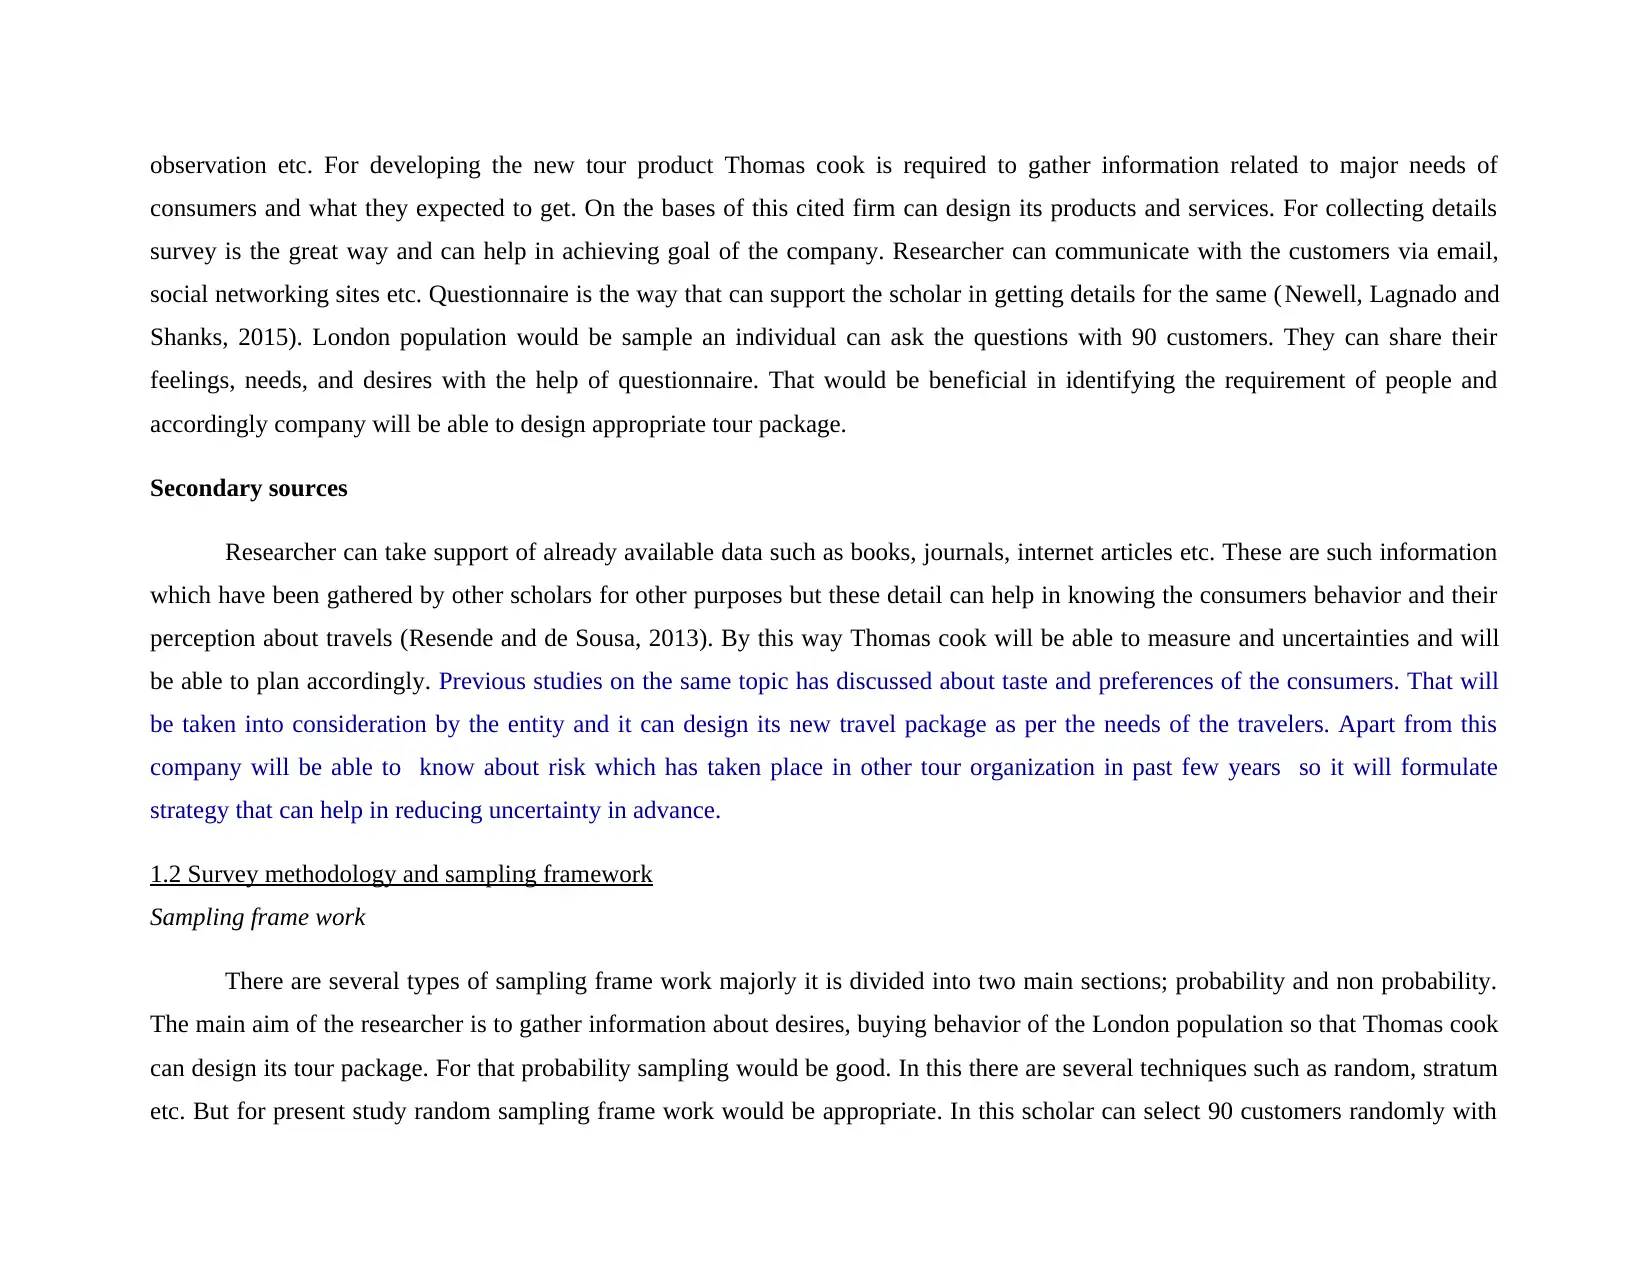
observation etc. For developing the new tour product Thomas cook is required to gather information related to major needs of
consumers and what they expected to get. On the bases of this cited firm can design its products and services. For collecting details
survey is the great way and can help in achieving goal of the company. Researcher can communicate with the customers via email,
social networking sites etc. Questionnaire is the way that can support the scholar in getting details for the same ( Newell, Lagnado and
Shanks, 2015). London population would be sample an individual can ask the questions with 90 customers. They can share their
feelings, needs, and desires with the help of questionnaire. That would be beneficial in identifying the requirement of people and
accordingly company will be able to design appropriate tour package.
Secondary sources
Researcher can take support of already available data such as books, journals, internet articles etc. These are such information
which have been gathered by other scholars for other purposes but these detail can help in knowing the consumers behavior and their
perception about travels (Resende and de Sousa, 2013). By this way Thomas cook will be able to measure and uncertainties and will
be able to plan accordingly. Previous studies on the same topic has discussed about taste and preferences of the consumers. That will
be taken into consideration by the entity and it can design its new travel package as per the needs of the travelers. Apart from this
company will be able to know about risk which has taken place in other tour organization in past few years so it will formulate
strategy that can help in reducing uncertainty in advance.
1.2 Survey methodology and sampling framework
Sampling frame work
There are several types of sampling frame work majorly it is divided into two main sections; probability and non probability.
The main aim of the researcher is to gather information about desires, buying behavior of the London population so that Thomas cook
can design its tour package. For that probability sampling would be good. In this there are several techniques such as random, stratum
etc. But for present study random sampling frame work would be appropriate. In this scholar can select 90 customers randomly with
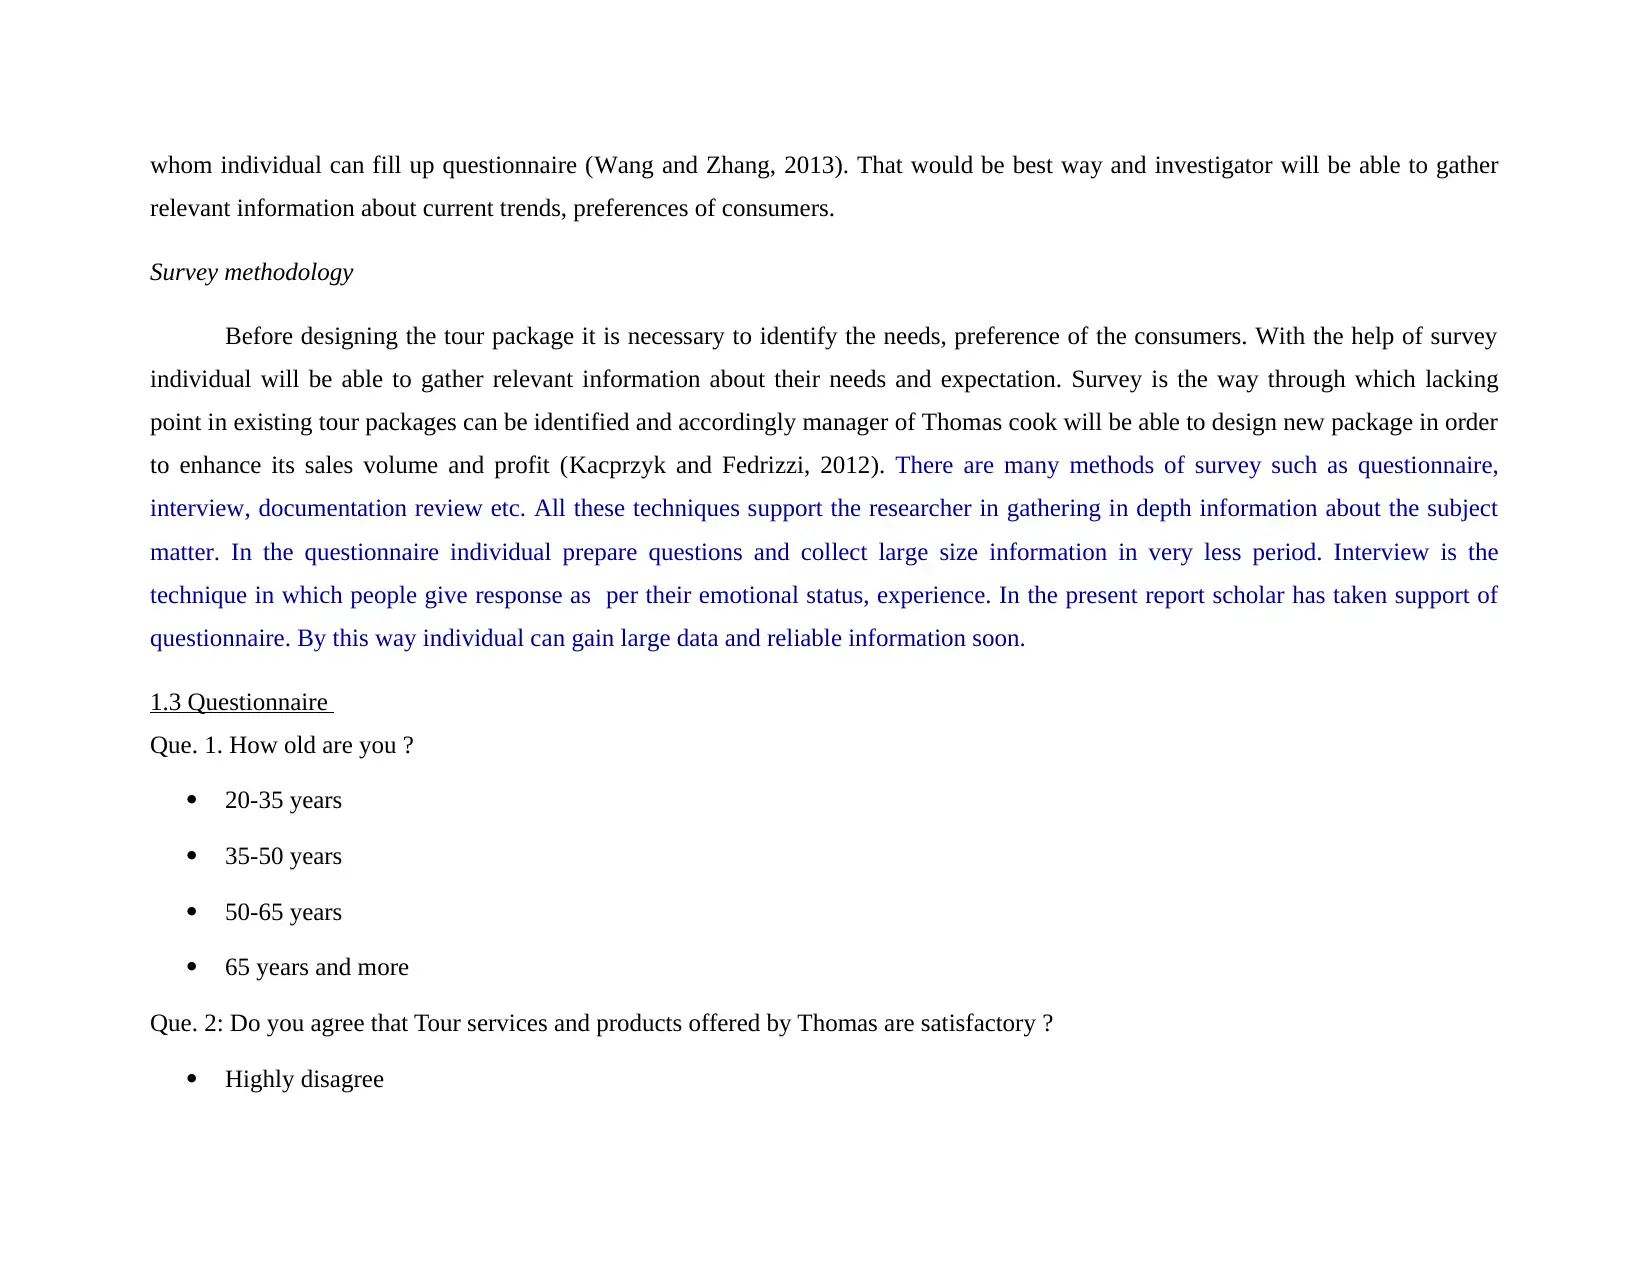
whom individual can fill up questionnaire (Wang and Zhang, 2013). That would be best way and investigator will be able to gather
relevant information about current trends, preferences of consumers.
Survey methodology
Before designing the tour package it is necessary to identify the needs, preference of the consumers. With the help of survey
individual will be able to gather relevant information about their needs and expectation. Survey is the way through which lacking
point in existing tour packages can be identified and accordingly manager of Thomas cook will be able to design new package in order
to enhance its sales volume and profit (Kacprzyk and Fedrizzi, 2012). There are many methods of survey such as questionnaire,
interview, documentation review etc. All these techniques support the researcher in gathering in depth information about the subject
matter. In the questionnaire individual prepare questions and collect large size information in very less period. Interview is the
technique in which people give response as per their emotional status, experience. In the present report scholar has taken support of
questionnaire. By this way individual can gain large data and reliable information soon.
1.3 Questionnaire
Que. 1. How old are you ?
20-35 years
35-50 years
50-65 years
65 years and more
Que. 2: Do you agree that Tour services and products offered by Thomas are satisfactory ?
Highly disagree
⊘ This is a preview!⊘
Do you want full access?
Subscribe today to unlock all pages.
Trusted by 1+ million students worldwide
Disagree
Neutral
Agree
Highly agree
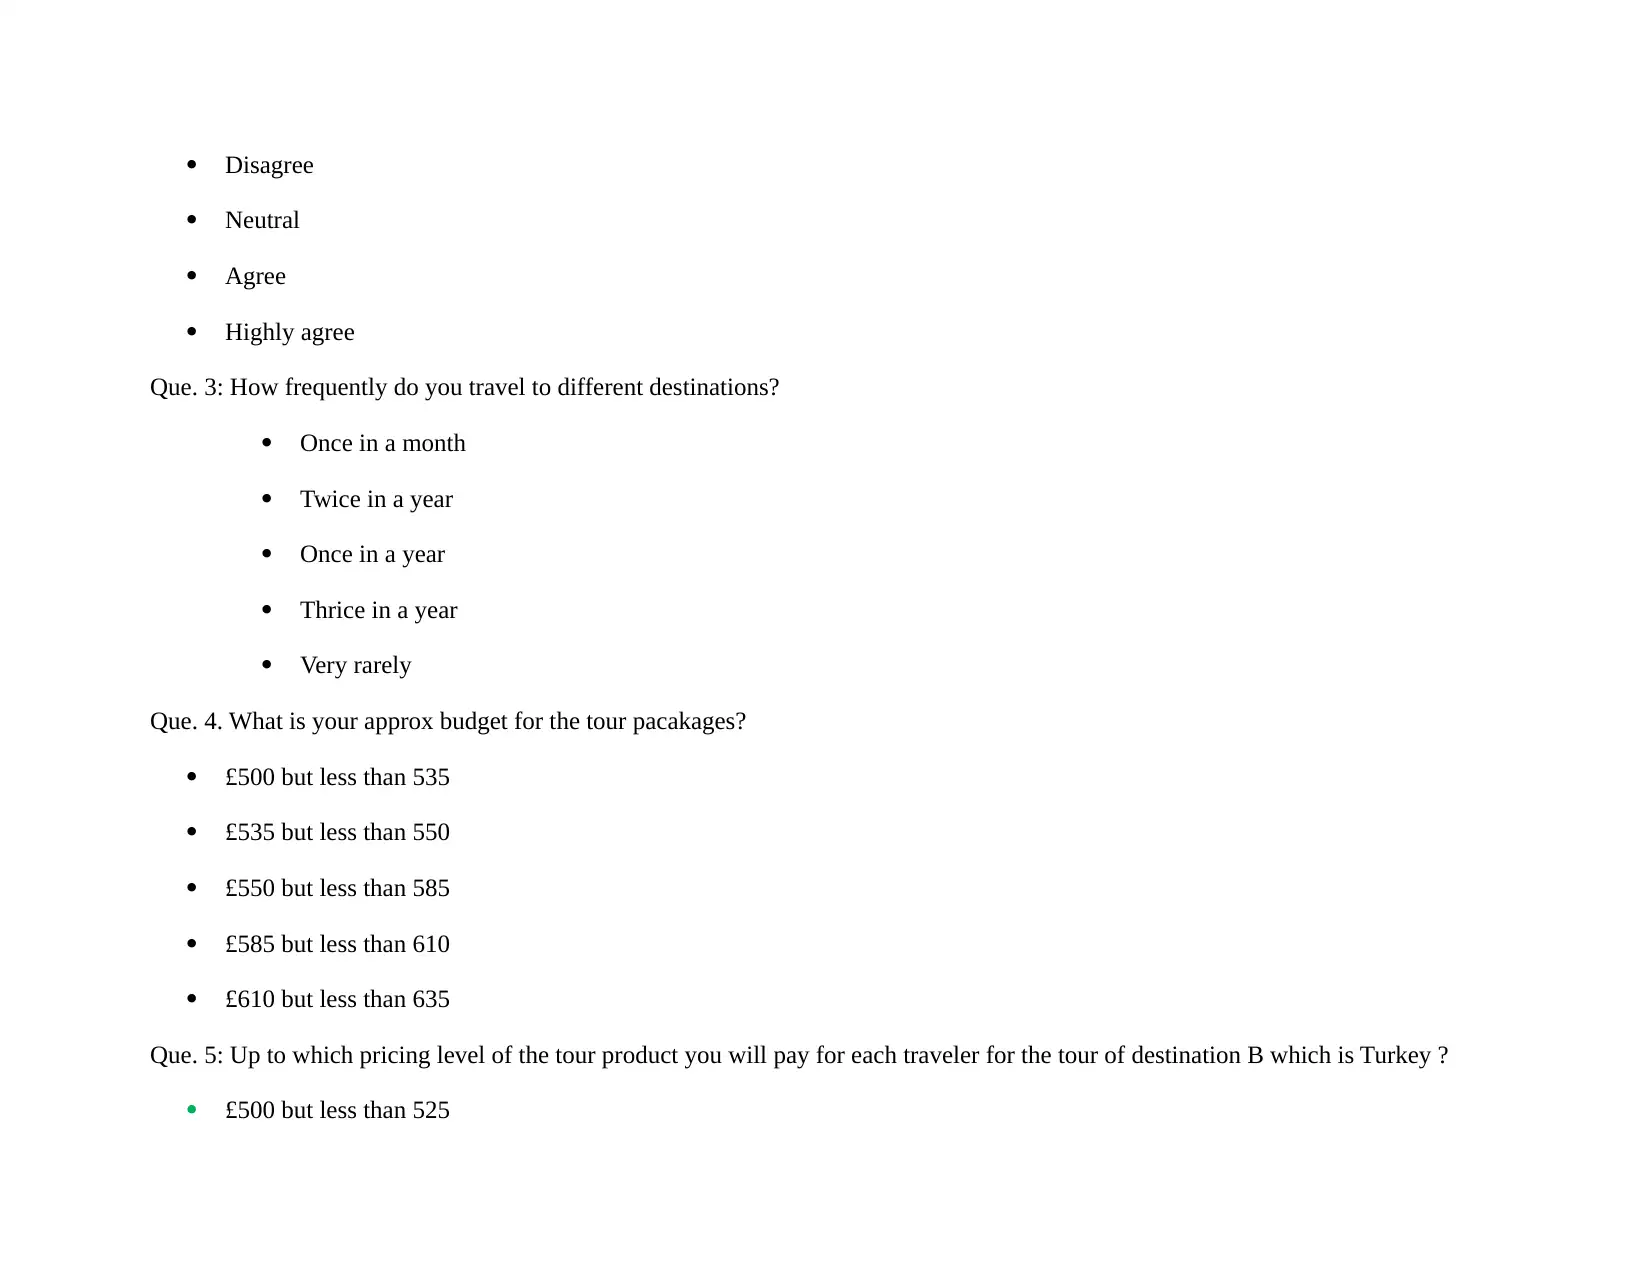
Que. 3: How frequently do you travel to different destinations?
Once in a month
Twice in a year
Once in a year
Thrice in a year
Very rarely
Que. 4. What is your approx budget for the tour pacakages?
£500 but less than 535
£535 but less than 550
£550 but less than 585
£585 but less than 610
£610 but less than 635
Que. 5: Up to which pricing level of the tour product you will pay for each traveler for the tour of destination B which is Turkey ?
£500 but less than 525
Neutral
Agree
Highly agree
Que. 3: How frequently do you travel to different destinations?
Once in a month
Twice in a year
Once in a year
Thrice in a year
Very rarely
Que. 4. What is your approx budget for the tour pacakages?
£500 but less than 535
£535 but less than 550
£550 but less than 585
£585 but less than 610
£610 but less than 635
Que. 5: Up to which pricing level of the tour product you will pay for each traveler for the tour of destination B which is Turkey ?
£500 but less than 525
Paraphrase This Document
Need a fresh take? Get an instant paraphrase of this document with our AI Paraphraser
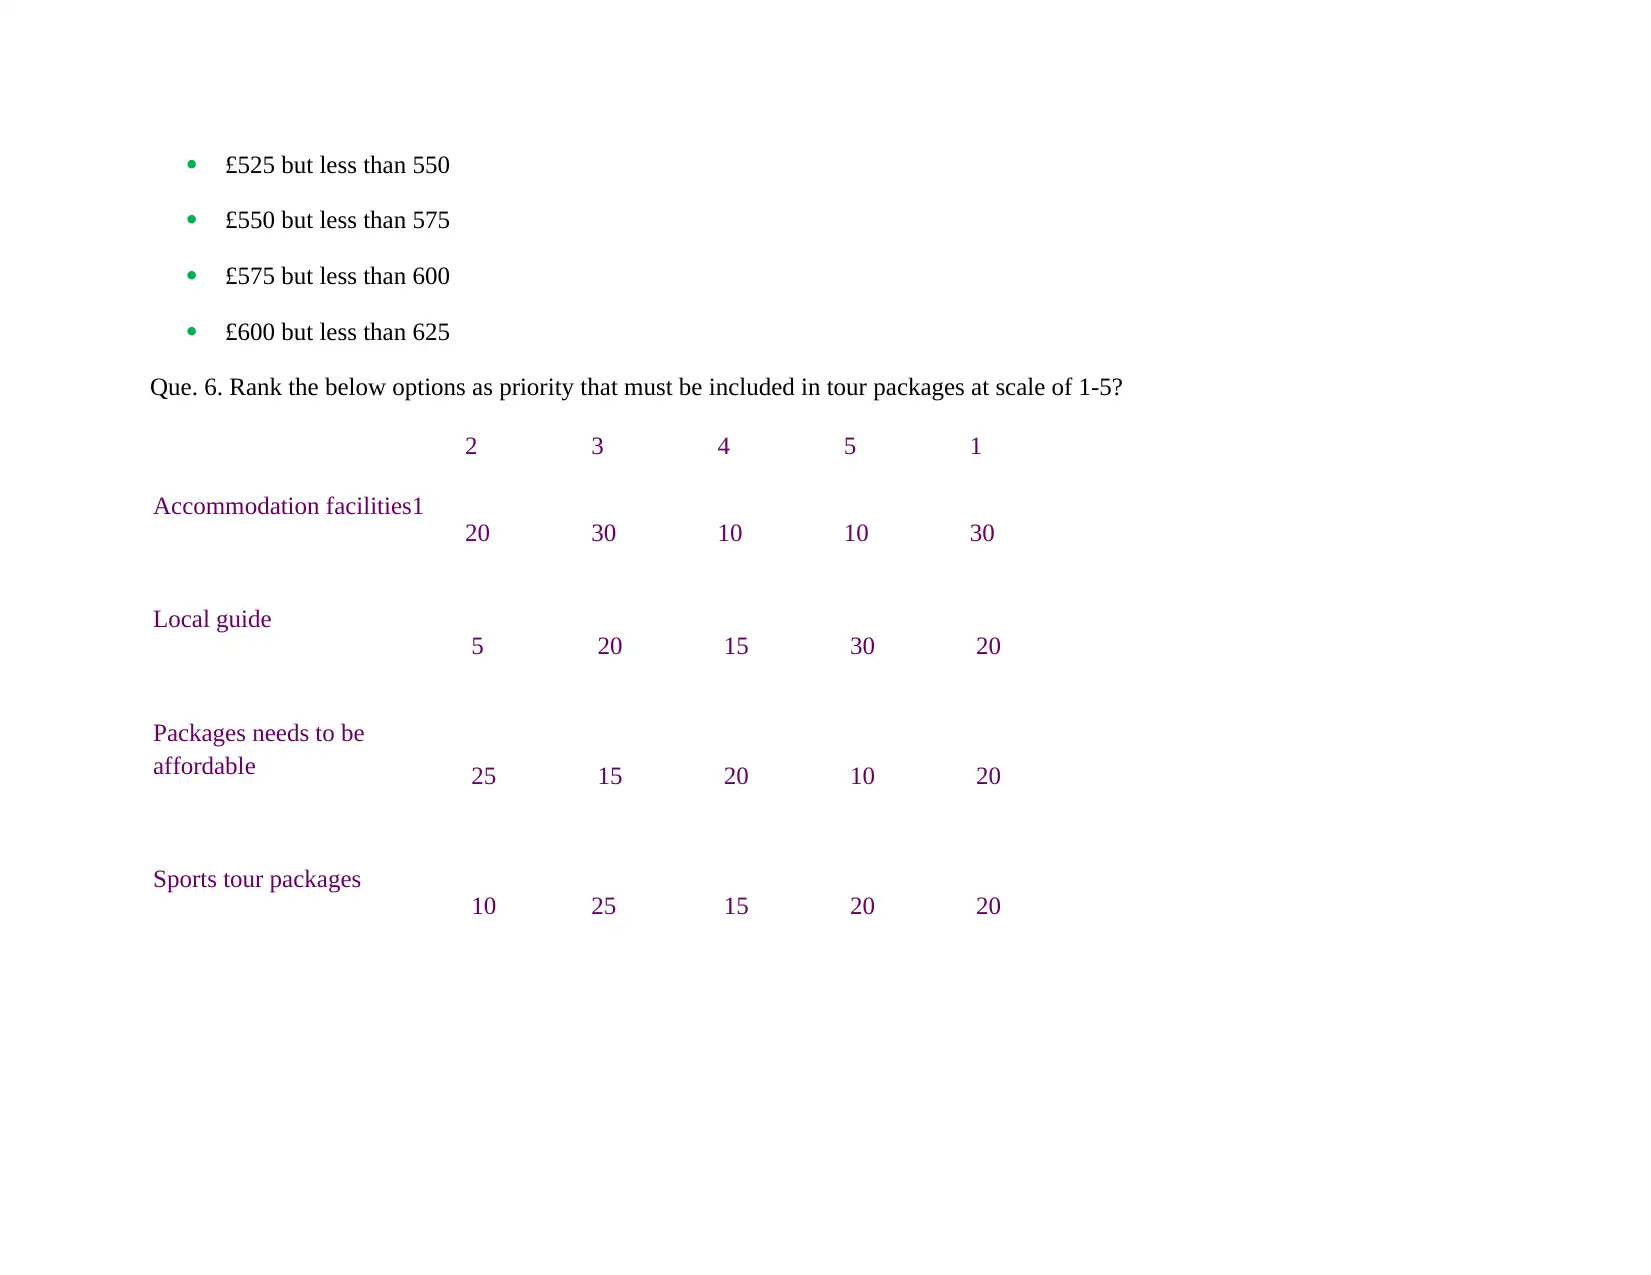
£525 but less than 550
£550 but less than 575
£575 but less than 600
£600 but less than 625
Que. 6. Rank the below options as priority that must be included in tour packages at scale of 1-5?
2 3 4 5 1
Accommodation facilities1
20 30 10 10 30
Local guide
5 20 15 30 20
Packages needs to be
affordable 25 15 20 10 20
Sports tour packages
10 25 15 20 20
Task 2
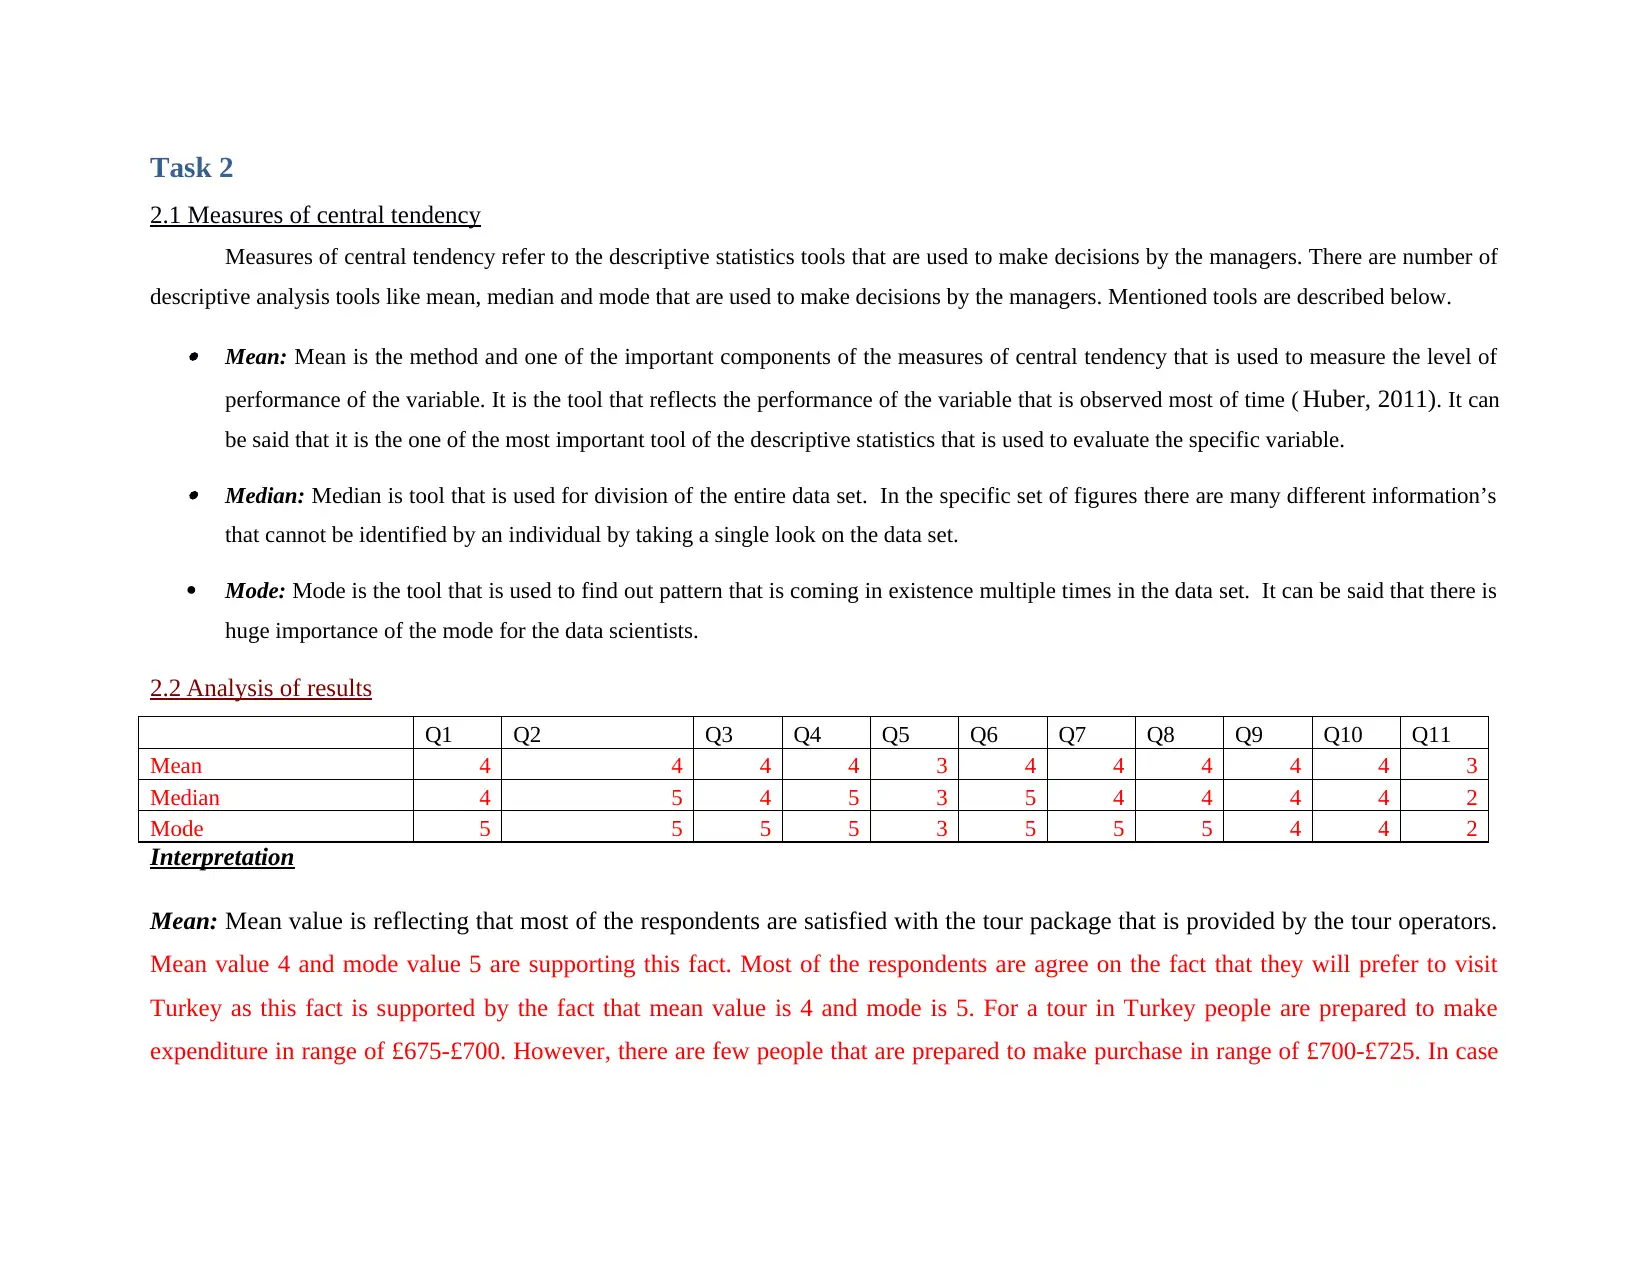
2.1 Measures of central tendency
Measures of central tendency refer to the descriptive statistics tools that are used to make decisions by the managers. There are number of
descriptive analysis tools like mean, median and mode that are used to make decisions by the managers. Mentioned tools are described below. Mean: Mean is the method and one of the important components of the measures of central tendency that is used to measure the level of
performance of the variable. It is the tool that reflects the performance of the variable that is observed most of time ( Huber, 2011). It can
be said that it is the one of the most important tool of the descriptive statistics that is used to evaluate the specific variable. Median: Median is tool that is used for division of the entire data set. In the specific set of figures there are many different information’s
that cannot be identified by an individual by taking a single look on the data set.
Mode: Mode is the tool that is used to find out pattern that is coming in existence multiple times in the data set. It can be said that there is
huge importance of the mode for the data scientists.
2.2 Analysis of results
Q1 Q2 Q3 Q4 Q5 Q6 Q7 Q8 Q9 Q10 Q11
Mean 4 4 4 4 3 4 4 4 4 4 3
Median 4 5 4 5 3 5 4 4 4 4 2
Mode 5 5 5 5 3 5 5 5 4 4 2
Interpretation
Mean: Mean value is reflecting that most of the respondents are satisfied with the tour package that is provided by the tour operators.
Mean value 4 and mode value 5 are supporting this fact. Most of the respondents are agree on the fact that they will prefer to visit
Turkey as this fact is supported by the fact that mean value is 4 and mode is 5. For a tour in Turkey people are prepared to make
expenditure in range of £675-£700. However, there are few people that are prepared to make purchase in range of £700-£725. In case
⊘ This is a preview!⊘
Do you want full access?
Subscribe today to unlock all pages.
Trusted by 1+ million students worldwide
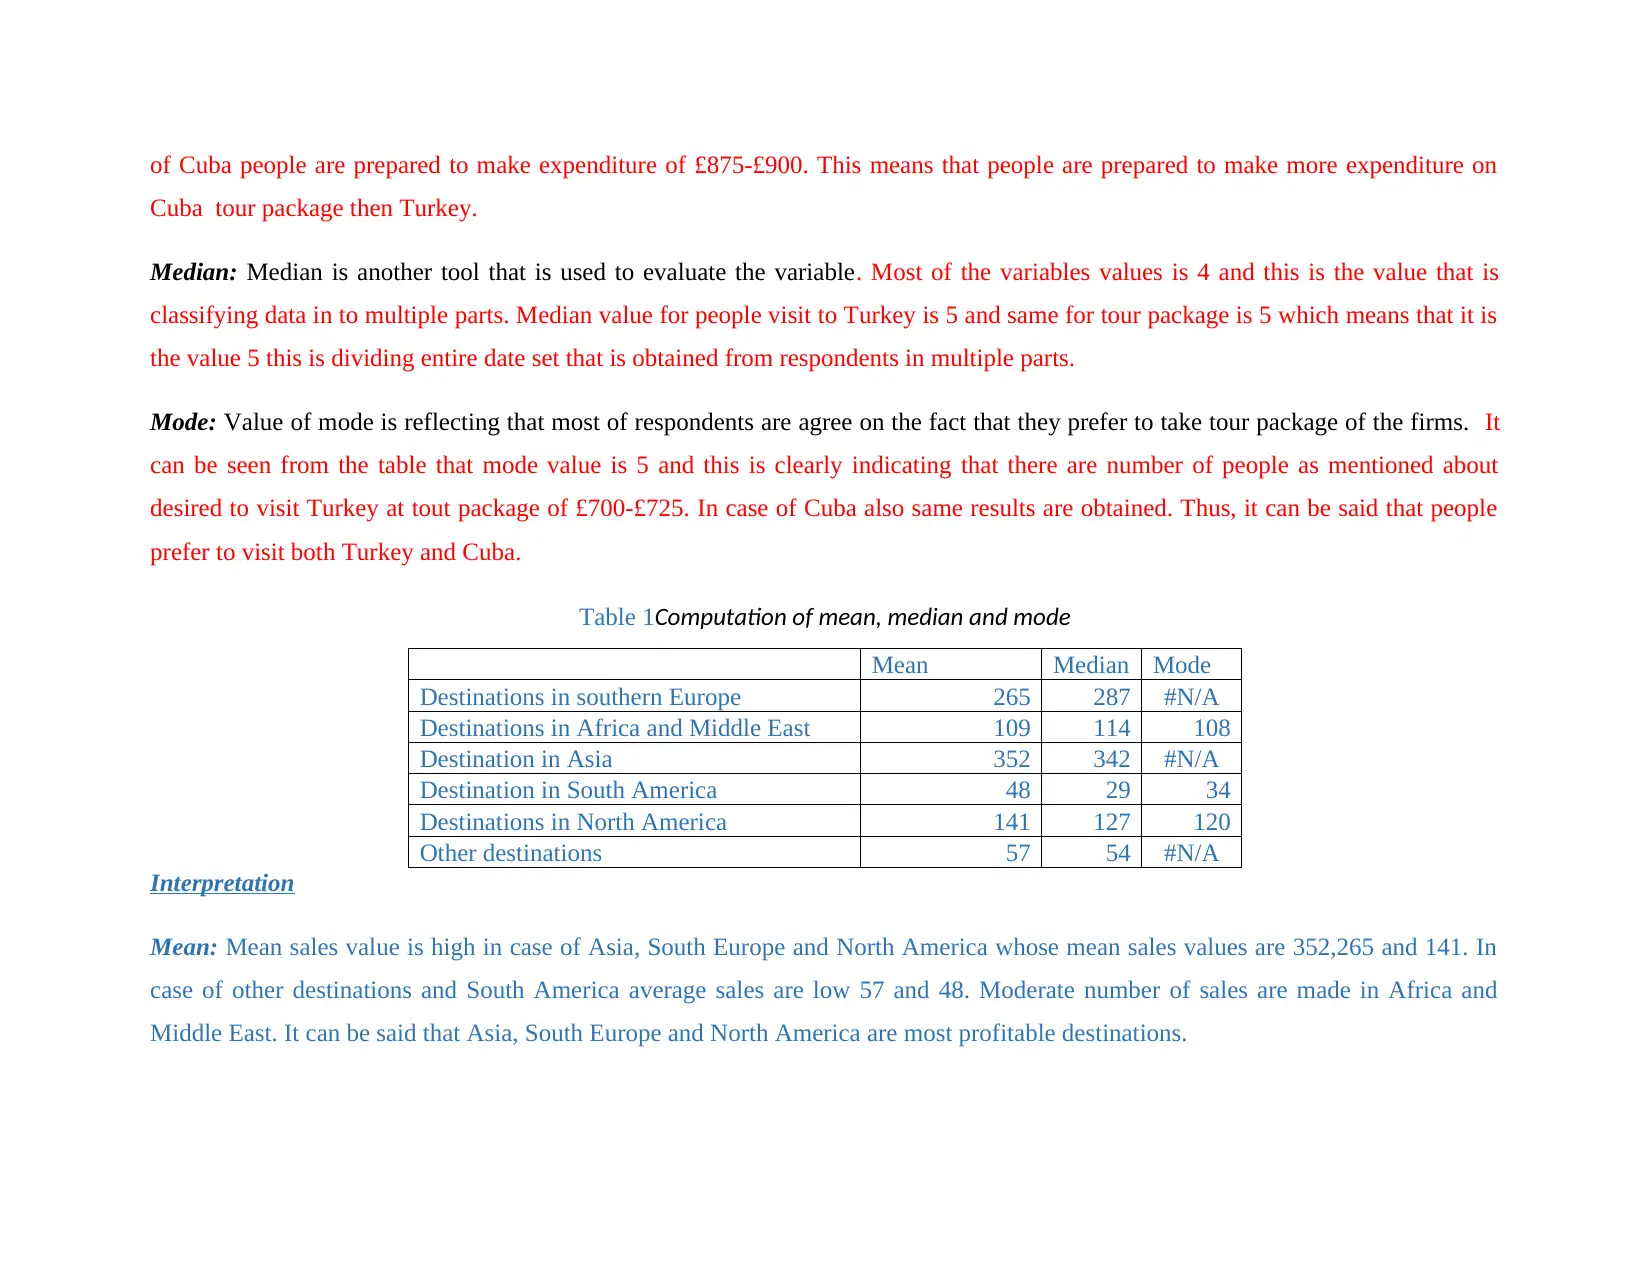
of Cuba people are prepared to make expenditure of £875-£900. This means that people are prepared to make more expenditure on
Cuba tour package then Turkey.
Median: Median is another tool that is used to evaluate the variable. Most of the variables values is 4 and this is the value that is
classifying data in to multiple parts. Median value for people visit to Turkey is 5 and same for tour package is 5 which means that it is
the value 5 this is dividing entire date set that is obtained from respondents in multiple parts.
Mode: Value of mode is reflecting that most of respondents are agree on the fact that they prefer to take tour package of the firms. It
can be seen from the table that mode value is 5 and this is clearly indicating that there are number of people as mentioned about
desired to visit Turkey at tout package of £700-£725. In case of Cuba also same results are obtained. Thus, it can be said that people
prefer to visit both Turkey and Cuba.
Table 1Computation of mean, median and mode
Mean Median Mode
Destinations in southern Europe 265 287 #N/A
Destinations in Africa and Middle East 109 114 108
Destination in Asia 352 342 #N/A
Destination in South America 48 29 34
Destinations in North America 141 127 120
Other destinations 57 54 #N/A
Interpretation
Mean: Mean sales value is high in case of Asia, South Europe and North America whose mean sales values are 352,265 and 141. In
case of other destinations and South America average sales are low 57 and 48. Moderate number of sales are made in Africa and
Middle East. It can be said that Asia, South Europe and North America are most profitable destinations.
Paraphrase This Document
Need a fresh take? Get an instant paraphrase of this document with our AI Paraphraser
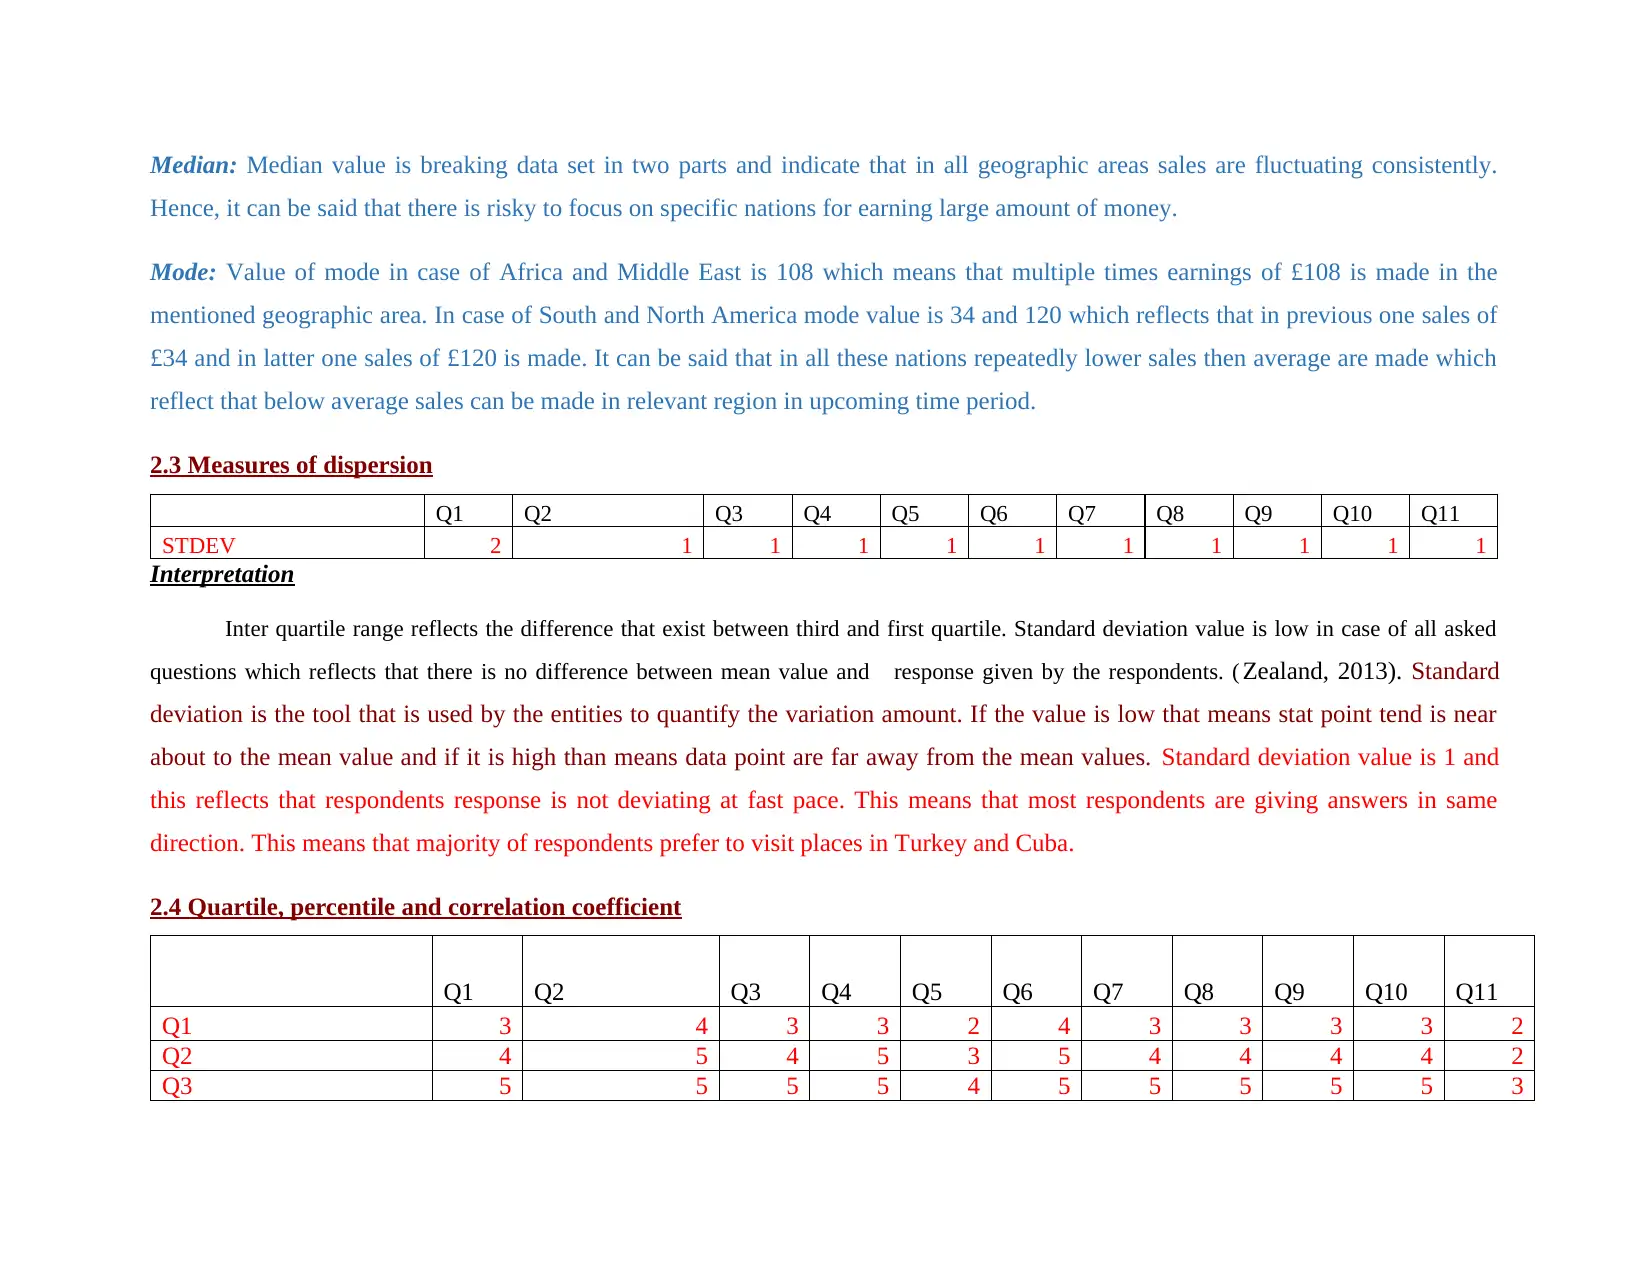
Median: Median value is breaking data set in two parts and indicate that in all geographic areas sales are fluctuating consistently.
Hence, it can be said that there is risky to focus on specific nations for earning large amount of money.
Mode: Value of mode in case of Africa and Middle East is 108 which means that multiple times earnings of £108 is made in the
mentioned geographic area. In case of South and North America mode value is 34 and 120 which reflects that in previous one sales of
£34 and in latter one sales of £120 is made. It can be said that in all these nations repeatedly lower sales then average are made which
reflect that below average sales can be made in relevant region in upcoming time period.
2.3 Measures of dispersion
Q1 Q2 Q3 Q4 Q5 Q6 Q7 Q8 Q9 Q10 Q11
STDEV 2 1 1 1 1 1 1 1 1 1 1
Interpretation
Inter quartile range reflects the difference that exist between third and first quartile. Standard deviation value is low in case of all asked
questions which reflects that there is no difference between mean value and response given by the respondents. ( Zealand, 2013). Standard
deviation is the tool that is used by the entities to quantify the variation amount. If the value is low that means stat point tend is near
about to the mean value and if it is high than means data point are far away from the mean values. Standard deviation value is 1 and
this reflects that respondents response is not deviating at fast pace. This means that most respondents are giving answers in same
direction. This means that majority of respondents prefer to visit places in Turkey and Cuba.
2.4 Quartile, percentile and correlation coefficient
Q1 Q2 Q3 Q4 Q5 Q6 Q7 Q8 Q9 Q10 Q11
Q1 3 4 3 3 2 4 3 3 3 3 2
Q2 4 5 4 5 3 5 4 4 4 4 2
Q3 5 5 5 5 4 5 5 5 5 5 3
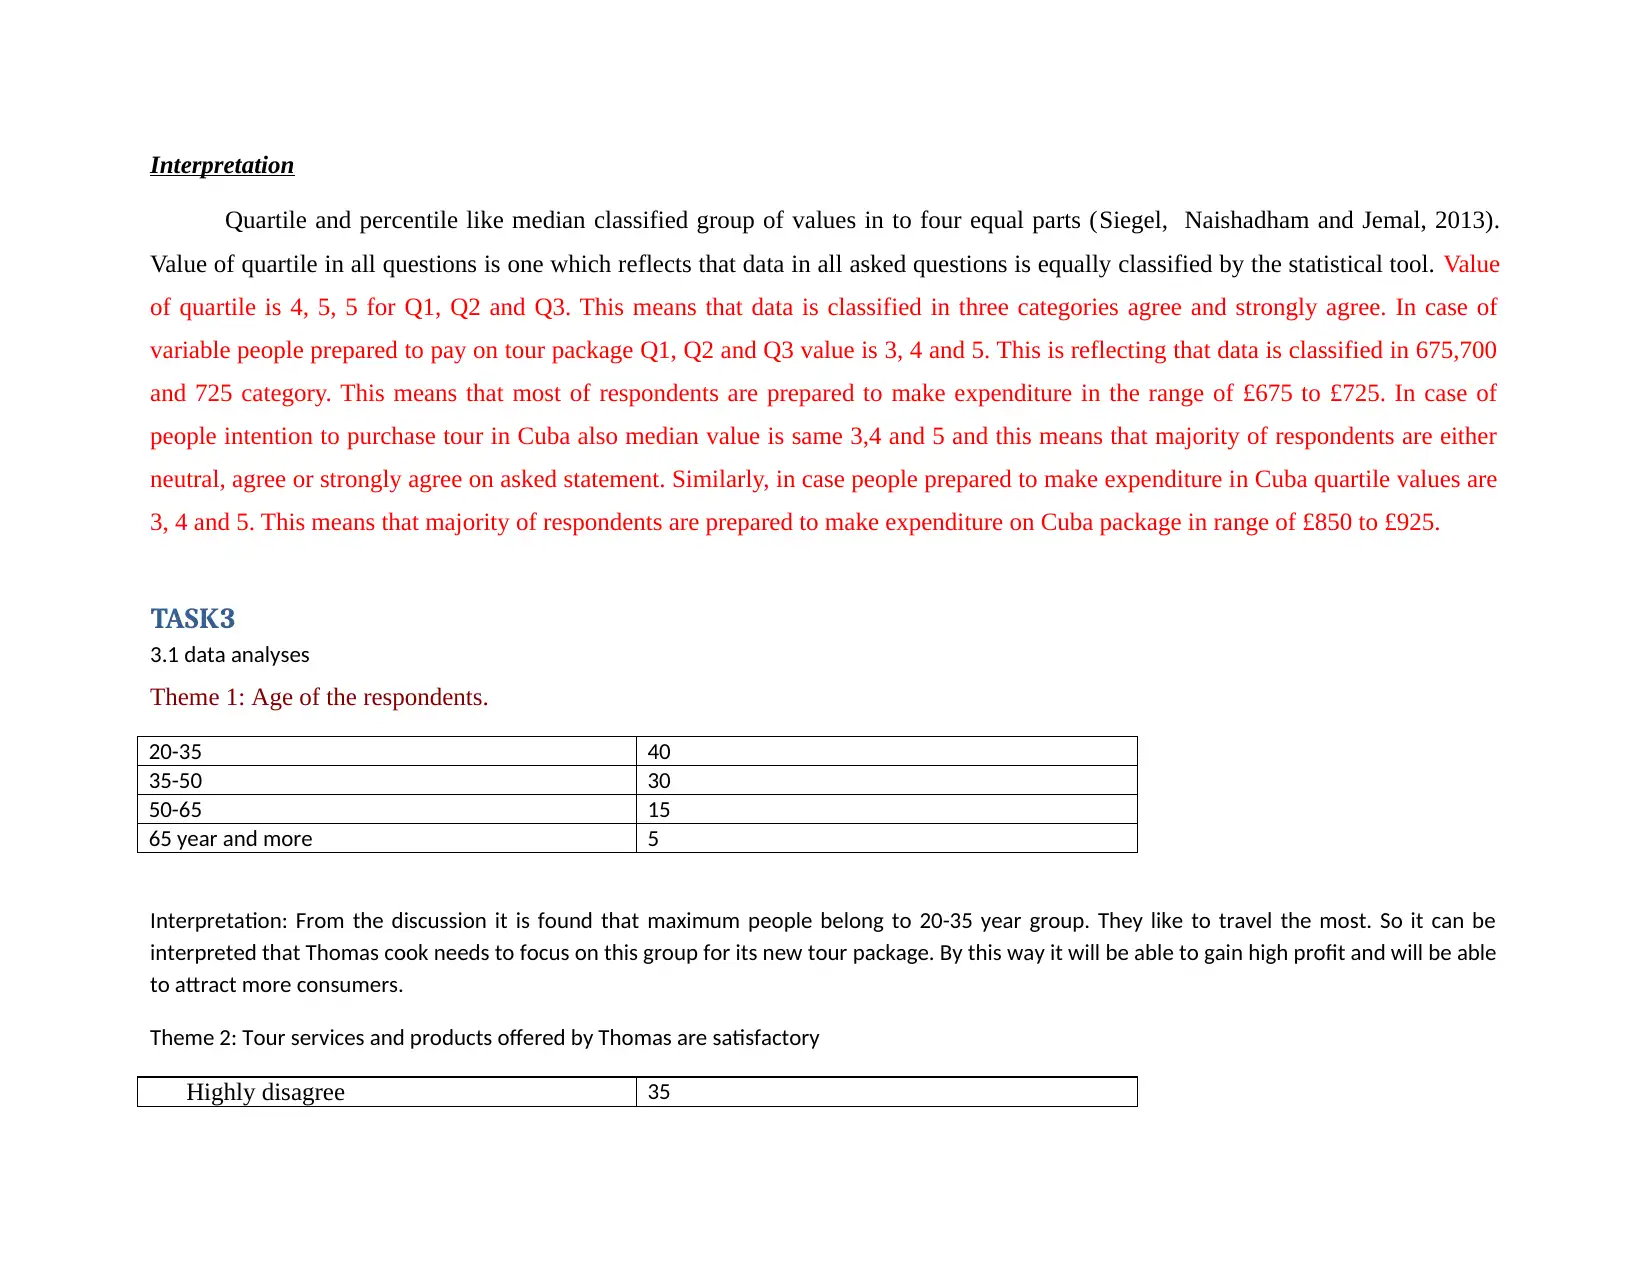
Interpretation
Quartile and percentile like median classified group of values in to four equal parts (Siegel, Naishadham and Jemal, 2013).
Value of quartile in all questions is one which reflects that data in all asked questions is equally classified by the statistical tool. Value
of quartile is 4, 5, 5 for Q1, Q2 and Q3. This means that data is classified in three categories agree and strongly agree. In case of
variable people prepared to pay on tour package Q1, Q2 and Q3 value is 3, 4 and 5. This is reflecting that data is classified in 675,700
and 725 category. This means that most of respondents are prepared to make expenditure in the range of £675 to £725. In case of
people intention to purchase tour in Cuba also median value is same 3,4 and 5 and this means that majority of respondents are either
neutral, agree or strongly agree on asked statement. Similarly, in case people prepared to make expenditure in Cuba quartile values are
3, 4 and 5. This means that majority of respondents are prepared to make expenditure on Cuba package in range of £850 to £925.
TASK3
3.1 data analyses
Theme 1: Age of the respondents.
20-35 40
35-50 30
50-65 15
65 year and more 5
Interpretation: From the discussion it is found that maximum people belong to 20-35 year group. They like to travel the most. So it can be
interpreted that Thomas cook needs to focus on this group for its new tour package. By this way it will be able to gain high profit and will be able
to attract more consumers.
Theme 2: Tour services and products offered by Thomas are satisfactory
Highly disagree 35
⊘ This is a preview!⊘
Do you want full access?
Subscribe today to unlock all pages.
Trusted by 1+ million students worldwide
1 out of 28
Related Documents


Your All-in-One AI-Powered Toolkit for Academic Success.
+13062052269
info@desklib.com
Available 24*7 on WhatsApp / Email
![[object Object]](/_next/static/media/star-bottom.7253800d.svg)
Unlock your academic potential
Copyright © 2020–2026 A2Z Services. All Rights Reserved. Developed and managed by ZUCOL.