ECO100 Introductory Economics: Trade, Quotas & Market Analysis
VerifiedAdded on 2023/06/07
|14
|2887
|106
Homework Assignment
AI Summary
This assignment delves into introductory economics, focusing on the effects of trade agreements and import quotas, particularly within the context of Australia and Canada. It examines the impact of trade on consumers, producers, and the overall economy, using graphs to illustrate these effects. Furthermore, it analyzes how import quotas influence beef prices, consumer and producer surplus, and the efficiency of the beef market. The assignment also explores the dynamics of the espresso coffee market in Australia, classifying it as monopolistic competition and explaining the surge in coffee chains. Finally, it addresses market equilibrium by calculating equilibrium price and quantity and analyzing the impact of government subsidies on the tea market, including the new equilibrium quantity, price paid by buyers, amount received by sellers (including subsidies), and the total cost to the government. Desklib provides a platform for students to access similar solved assignments and resources.
Introductory Economics 1
INTRODUCTORY ECONOMICS
By Name:
Students I.D:
Course
Instructor
Institution
Date
INTRODUCTORY ECONOMICS
By Name:
Students I.D:
Course
Instructor
Institution
Date
Paraphrase This Document
Need a fresh take? Get an instant paraphrase of this document with our AI Paraphraser
Introductory Economics 2
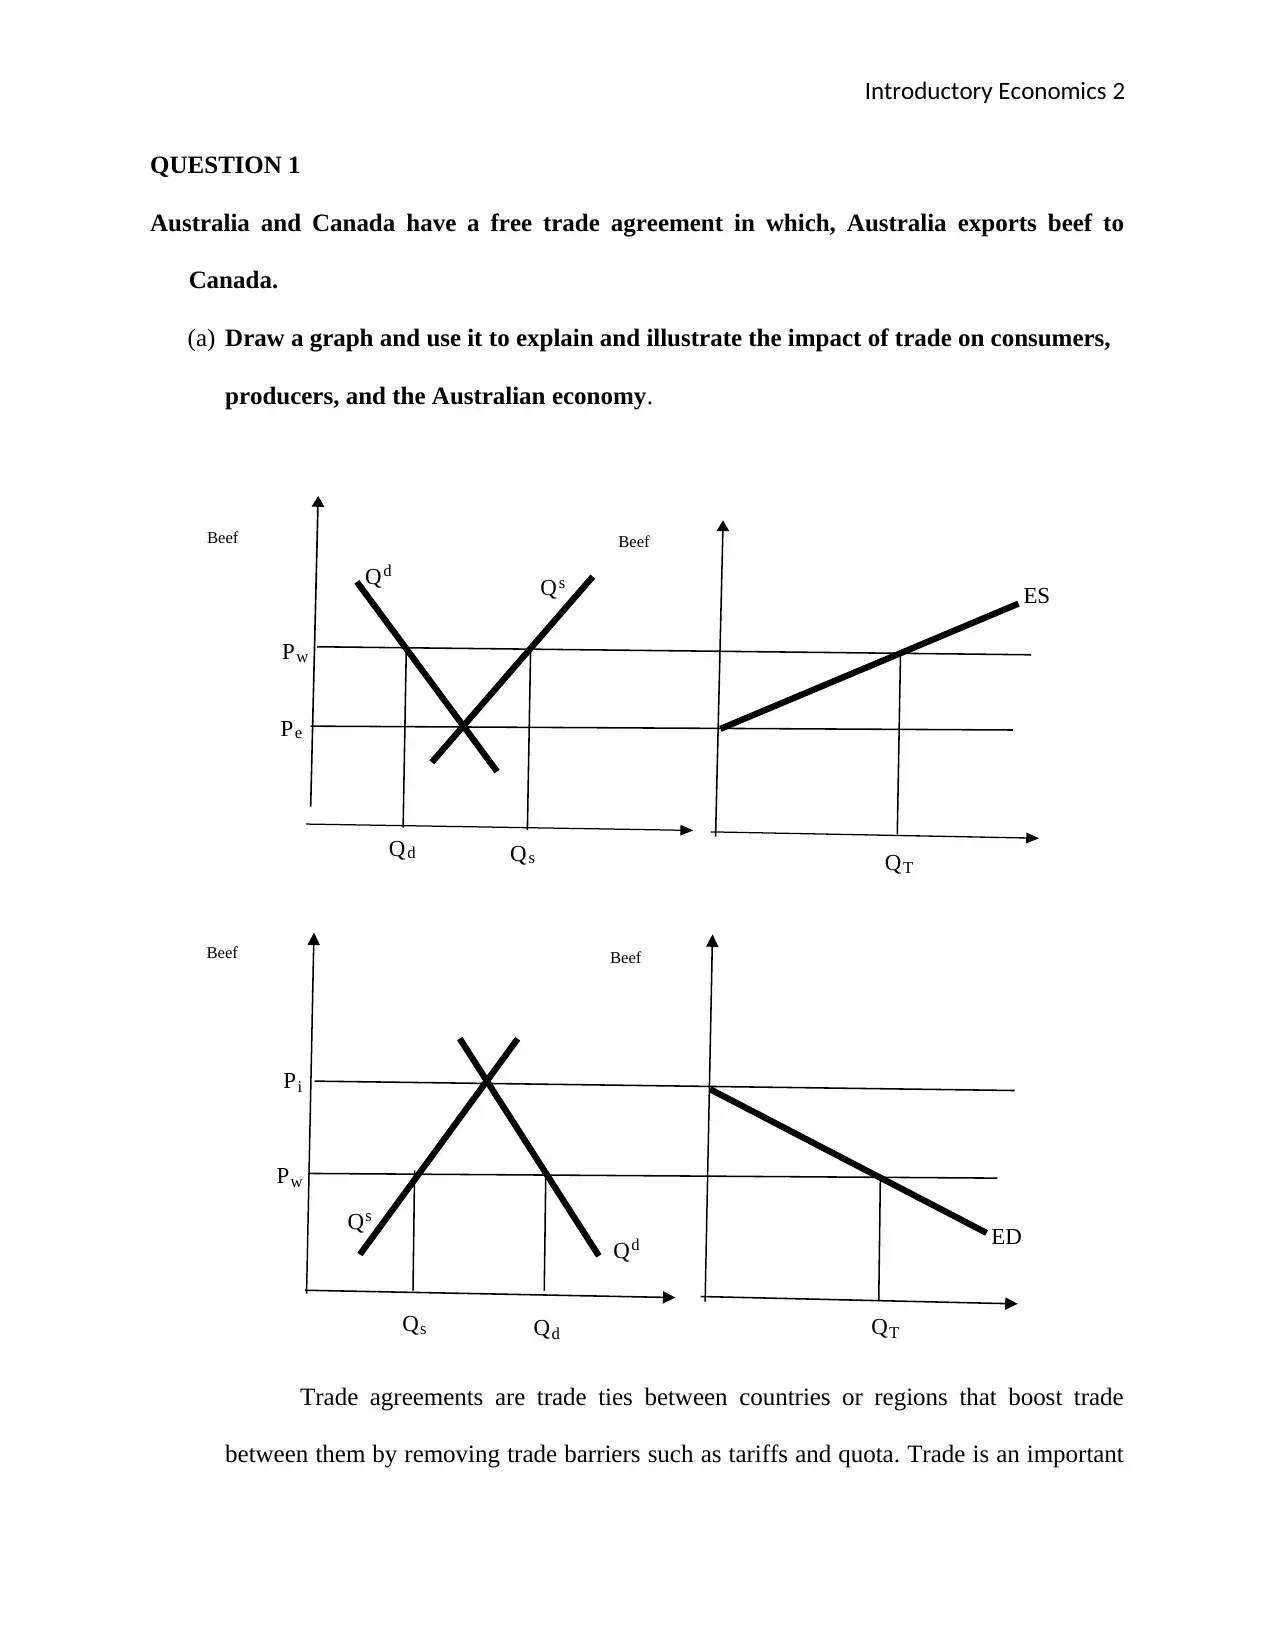
QUESTION 1
Australia and Canada have a free trade agreement in which, Australia exports beef to
Canada.
(a) Draw a graph and use it to explain and illustrate the impact of trade on consumers,
producers, and the Australian economy.
Trade agreements are trade ties between countries or regions that boost trade
between them by removing trade barriers such as tariffs and quota. Trade is an important
ES
Pe
Qd
Beef
Pw
QsQd
Beef
Qs QT
QT
ED
Pi
Beef
Pw
Qs
Qd
Beef
QdQs
Introductory Economics 3
economic activity that contributes immensely to economic growth of countries (Bos,
2014). The free trade agreement between Australia and Canada has huge impact on
consumers, producers, and their economies. The diagram above illustrates trade between
Australia and Canada. At point Pe, the domestic production of beef in Australia is
equivalent to domestic production. Excess supply is obtained as Qs-Qd and is sold at
prices over price Pe. Trade enables producers to dispose surplus products to domestic and
international markets. Through the free trade agreement between Australia and Canada,
Australia benefits from acquiring more market for its beef products. Australia can
increase production of beef beyond its demand so as to meet international markets. Trade
also creates an opportunity where countries acquire goods from other countries in form of
imports (Dabla-Norris & Duval, 2016).
In Canada, the prevailing beef market price is lower than the market equilibrium
price of the domestic market. The amount of beef products demanded by customers is
greater than amount supplied when retailing prices are lower than Pi. Through importing
beef, Canada benefits by acquiring high quality meet from Australia. Canadians are also
able to obtain a variety of beef products to choose from. The expansion of the economy
occurs in Australia when the beef industry flourishes as a result of the free trade
agreement (Egan & Gumaraes, 2017).Beef farmers and beef processing industries would
grow their businesses and thus lead to economic growth in Australia.
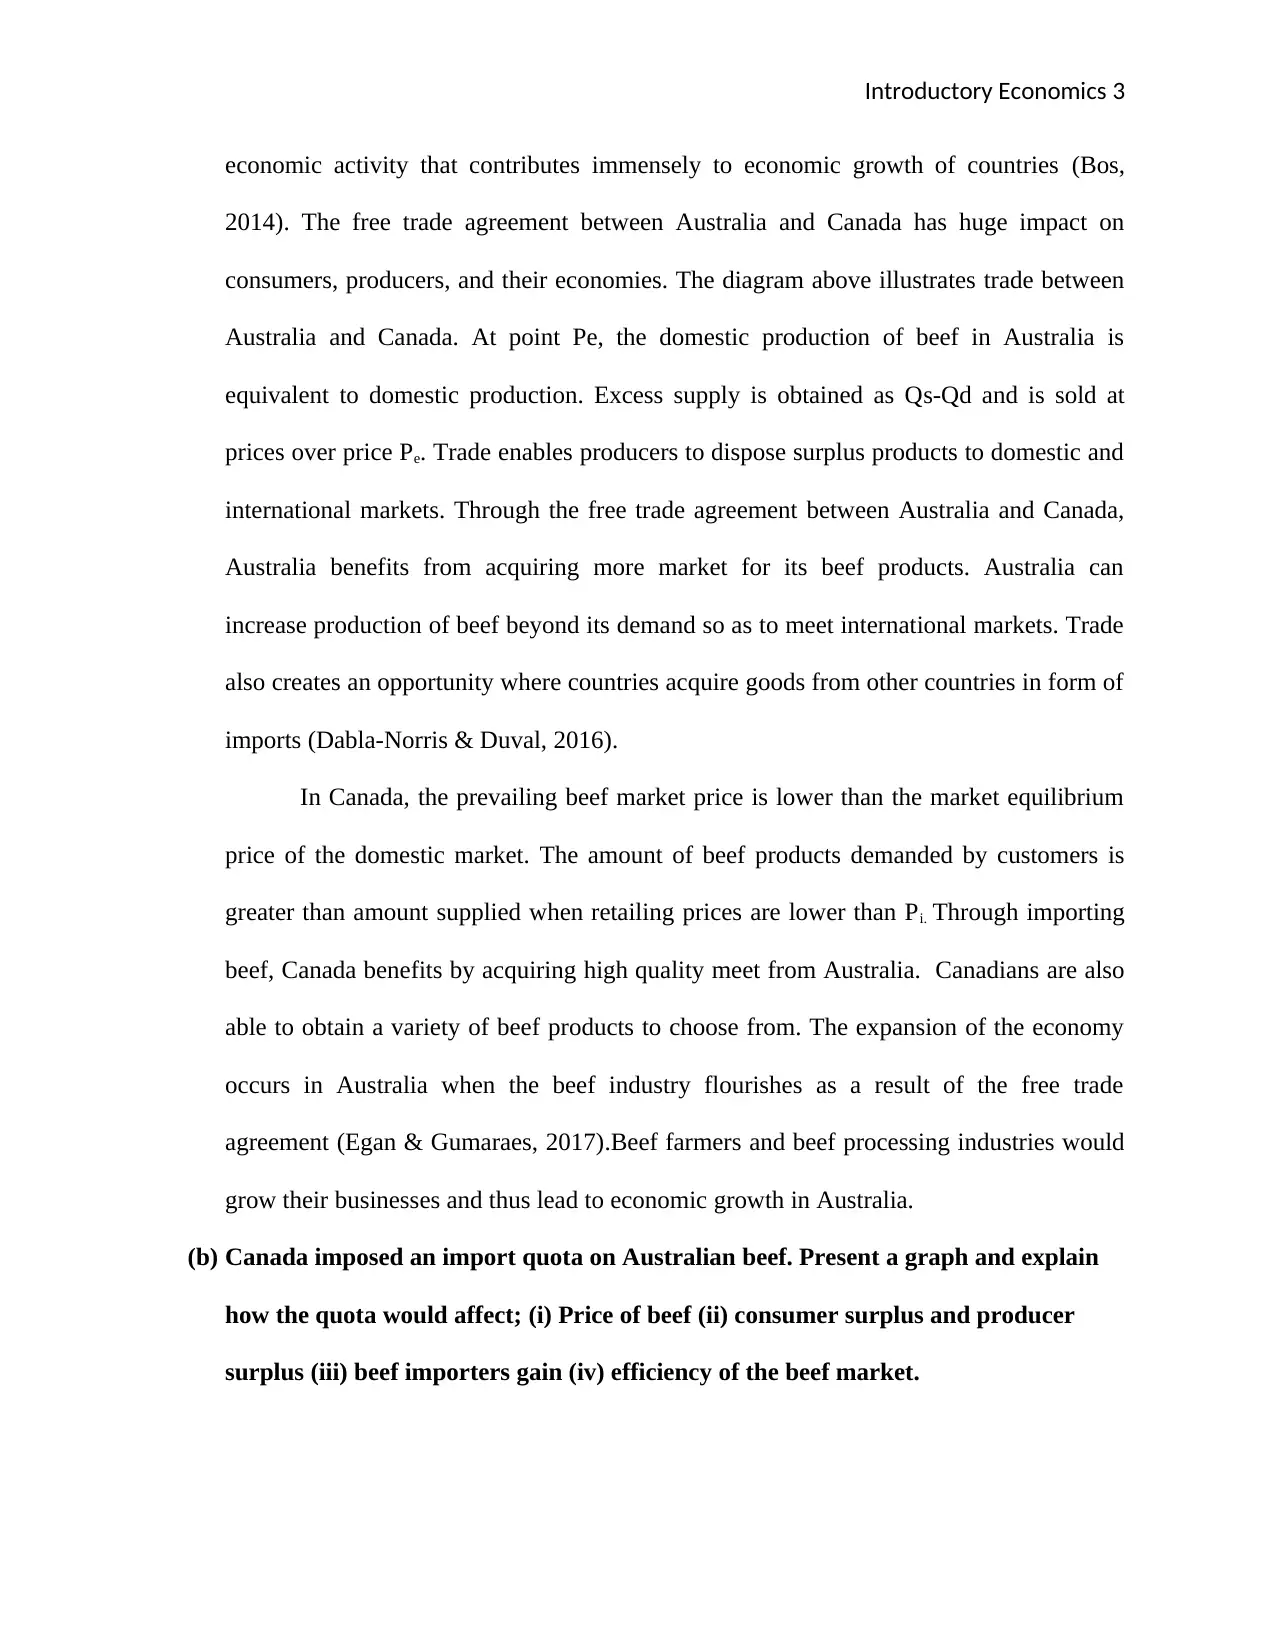
(b) Canada imposed an import quota on Australian beef. Present a graph and explain
how the quota would affect; (i) Price of beef (ii) consumer surplus and producer
surplus (iii) beef importers gain (iv) efficiency of the beef market.
economic activity that contributes immensely to economic growth of countries (Bos,
2014). The free trade agreement between Australia and Canada has huge impact on
consumers, producers, and their economies. The diagram above illustrates trade between
Australia and Canada. At point Pe, the domestic production of beef in Australia is
equivalent to domestic production. Excess supply is obtained as Qs-Qd and is sold at
prices over price Pe. Trade enables producers to dispose surplus products to domestic and
international markets. Through the free trade agreement between Australia and Canada,
Australia benefits from acquiring more market for its beef products. Australia can
increase production of beef beyond its demand so as to meet international markets. Trade
also creates an opportunity where countries acquire goods from other countries in form of
imports (Dabla-Norris & Duval, 2016).
In Canada, the prevailing beef market price is lower than the market equilibrium
price of the domestic market. The amount of beef products demanded by customers is
greater than amount supplied when retailing prices are lower than Pi. Through importing
beef, Canada benefits by acquiring high quality meet from Australia. Canadians are also
able to obtain a variety of beef products to choose from. The expansion of the economy
occurs in Australia when the beef industry flourishes as a result of the free trade
agreement (Egan & Gumaraes, 2017).Beef farmers and beef processing industries would
grow their businesses and thus lead to economic growth in Australia.
(b) Canada imposed an import quota on Australian beef. Present a graph and explain
how the quota would affect; (i) Price of beef (ii) consumer surplus and producer
surplus (iii) beef importers gain (iv) efficiency of the beef market.
⊘ This is a preview!⊘
Do you want full access?
Subscribe today to unlock all pages.
Trusted by 1+ million students worldwide
Introductory Economics 4
When Canada impose quotas on Australian beef, it restrict the amount of beef
imported from Australia. The imposition is conducted by limiting the amount of beef
import licenses or fixing a limit on imports. The price of beef in Canada would increase
due to a decline in quantity supplied. A decline in quantity supplied implies that
consumers have access to little amounts of product and thus might have to pay more for
the beef. Local producers of beef would sell more of the product at higher prices.
Consumer surplus is that difference in the amount that customers are willing to pay and
the price that they actually pay (Ehrenberg & Smith, 2016). The import quota imposed by
Canada causes a rise in consumer surplus through area A to D in the graph.
(c) The volume of import quotas on Australian beef is less than Australia’s total export
volume of beef to Canada. Explain how this import quotas would influence the
following factors in Australia. (i) Quantity of beef exported to Canada; (ii) price of
beef (iii) consumer surplus and producer surplus.
When the volume of import quotas of Australian beef exported to Canada is less
Australia’s total beef export to Canada, the quantity of beef exported to Canada would
Paraphrase This Document
Need a fresh take? Get an instant paraphrase of this document with our AI Paraphraser
Introductory Economics 5
decline. The import quota would only affect size of imports when the import quotas are
lower than the current exports (Gopinath, et al., 2014).
The price of beef would be significantly affected when import quotas are lower
than Australia’s beef exports to Canada. The quantity of beef supplied by Australia to
Canada would be affected since significant changes in supply occurred, the price would
of beef products in Canada would also increase.
Consumer surplus is the difference between the sum of Australian beef that
consumers are ready and able to purchase and sum of all that they purchase (Bernanke, et
al., 2015). Quotas lower than quantity imported, reducing consumer surplus since
consumers shall pay more for Australian beef products (Hamilton, 2017).
Producer surplus defines the difference between the sum of money that a producer
is ready and able to pay and the actual money he receives from selling a product (Hong &
Li, 2017). When Quotas are set below quantity imported from Australia, producer surplus
increases.
Introductory Economics 6
QUESTION 2
“More than one billion of cups of coffee are consumed in Australia’s cafes, restaurants and
other outlets each year, an increase of 65 per cent over 10 years. People are drinking less
‘instant coffee’ as espresso becomes more popular and new specialty coffee shops have been
popping up all over Australia to satisfy demand for daily caffeine fix. Not only are people
drinking more coffee, they are becoming more coffee-savvy and want premium brew even
if it costs more.”
(a) How would you classify the espresso coffee market; are firms price takers or price
makers?
The espresso coffee market in Australia is a monopolistic competition market structure
since small firms compete against each other. The products are similar although slight
differentiation might occur from the difference in customer service. The market can also be
classified as imperfect because customers might not have full information concerning prices in
the market. Firms are price makers since they can charge competitive prices up to a reasonable
range while customers are willing to consume premium brew even at a higher charge.
(b)With the aid of an appropriate economic model, explain why there has been such
an explosion in the number of coffee chains in Australia over the past ten years.
There has been a significant rise in demand of coffee in Australia over the last 10 years.
The news clip highlights that consumption has increased by around 65% in 10 years prompting
the explosion of coffee chains started to meet the increasing demand. The supply and demand
theory states that, an increase in demand prompts a rise in supply aimed at satisfying the market
⊘ This is a preview!⊘
Do you want full access?
Subscribe today to unlock all pages.
Trusted by 1+ million students worldwide
Introductory Economics 7
gap (Phaneuf & Requite, 2016). Entrepreneurs’ are always at the look of unexploited demand
which when they discover as profitable, venture in to business to meet the demand.
The barriers to entry on the market are slightly low. New firms can enter the market
without much challenge from already existing firms. However, it is worth noting that, coffee
customers in Australia tend to prefer visiting chain coffee outlets making it slightly difficult for
independent outlets to survive the turbulence of competition. New firms have to offer
exceptional customer service and invest in advertising.
Income is directly proportional to consumption. Higher income among individuals is
associated with increased purchasing power (Ready, et al., 2017).The rise in average income
among Australians as a result of increasing economic growth, has led to increased coffee
consumption. People’s drinking habits have also changed leading to a reduction in the traditional
pubs and an increase in coffee uptake.
(c) Would firms in the market making positive economic profit in the long run? Explain.
The coffee market in Australia operates under a monopolistic competition market
structure. In this market, producers and consumers are many although producers tend to
differentiate their products. The barriers to entry are also minimal such that in the short run,
firms can make surplus profits. As more coffee chains enter the market, earlier firms start
making normal profits. When companies differentiate their coffee and customer service, they
benefit by increasing prices without losing sales since loyal customers would be ready to
purchase their product even at higher prices up to a reasonable range. In the long run, conditions
of entry will determine whether firms will make profits. In presence of surplus profits, more
companies shall enter the market leading to a decline in market share enjoyed by existing firms
(Lee & Wang, 2018). New entrants might raise cost of resources leading to a decline in profits.
Paraphrase This Document
Need a fresh take? Get an instant paraphrase of this document with our AI Paraphraser
Introductory Economics 8
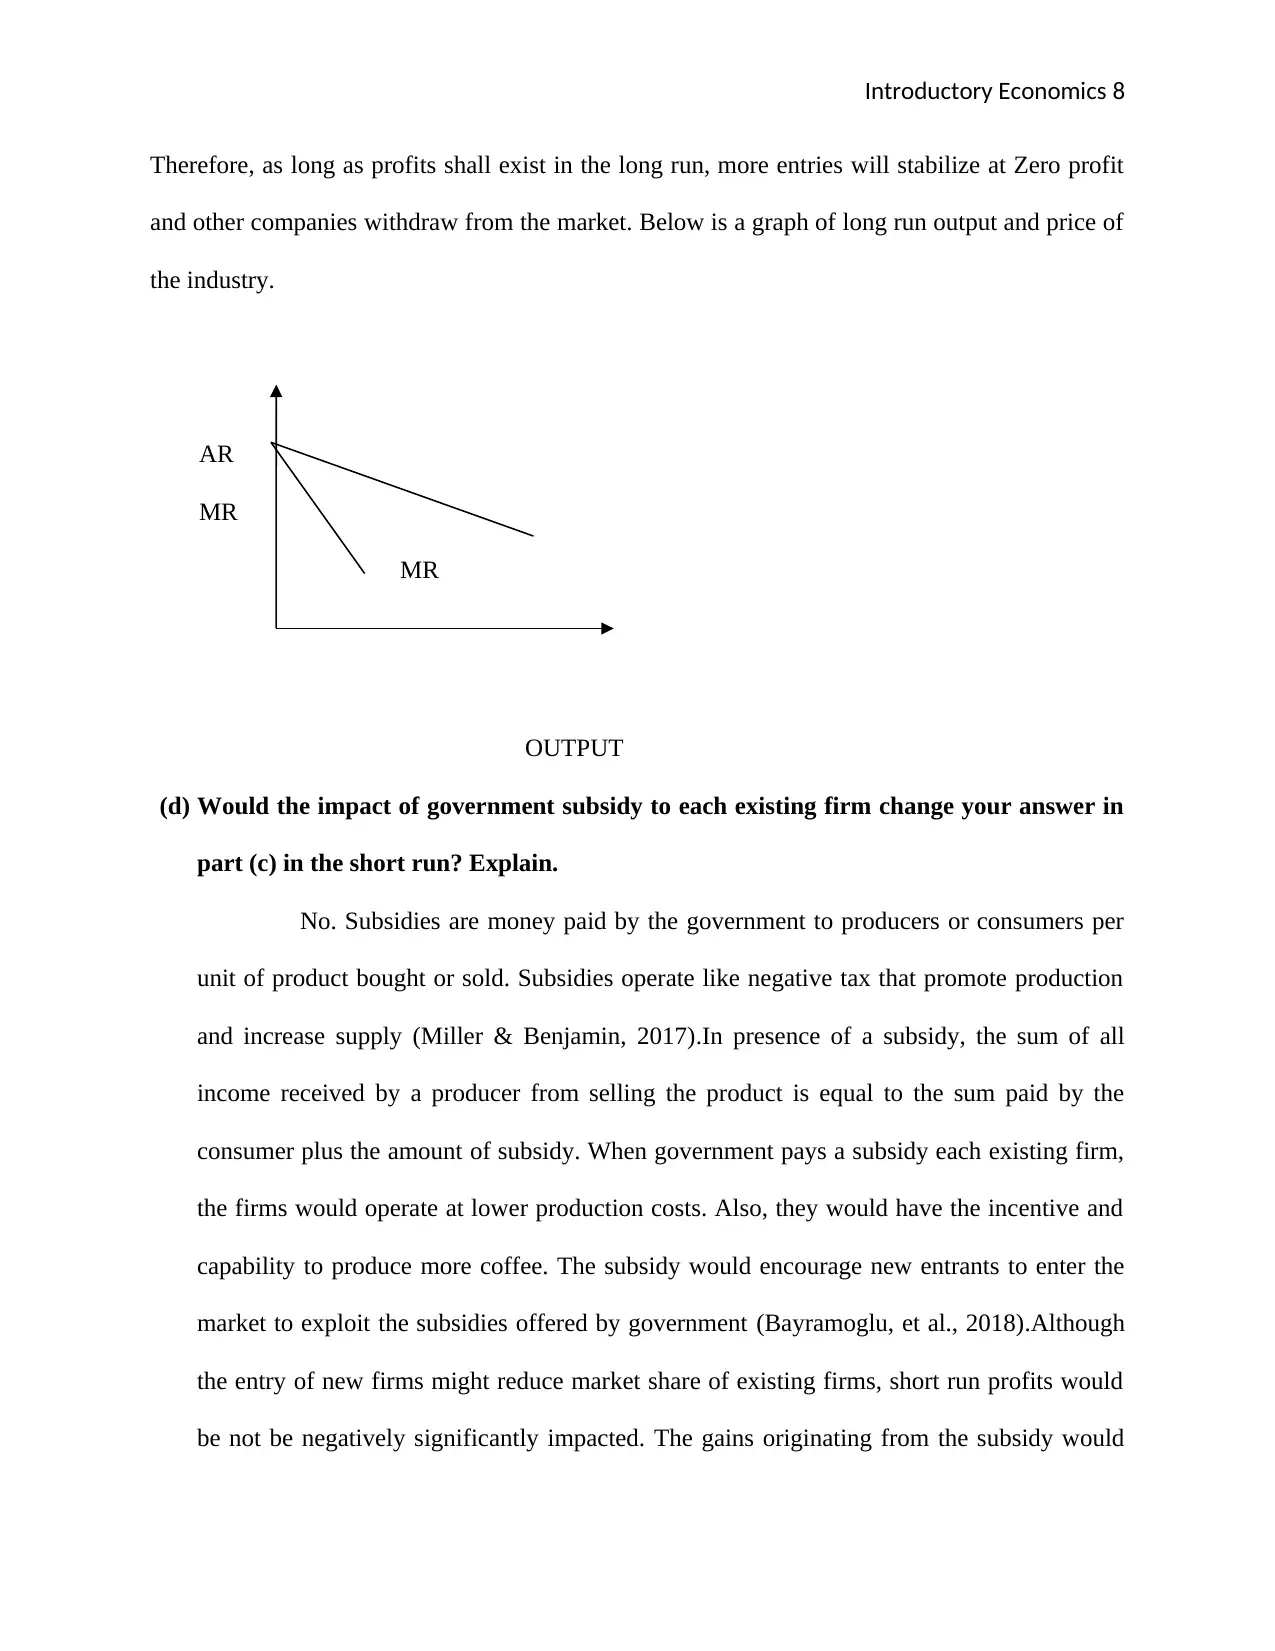
Therefore, as long as profits shall exist in the long run, more entries will stabilize at Zero profit
and other companies withdraw from the market. Below is a graph of long run output and price of
the industry.
AR
MR
MR
OUTPUT
(d) Would the impact of government subsidy to each existing firm change your answer in
part (c) in the short run? Explain.
No. Subsidies are money paid by the government to producers or consumers per
unit of product bought or sold. Subsidies operate like negative tax that promote production
and increase supply (Miller & Benjamin, 2017).In presence of a subsidy, the sum of all
income received by a producer from selling the product is equal to the sum paid by the
consumer plus the amount of subsidy. When government pays a subsidy each existing firm,
the firms would operate at lower production costs. Also, they would have the incentive and
capability to produce more coffee. The subsidy would encourage new entrants to enter the
market to exploit the subsidies offered by government (Bayramoglu, et al., 2018).Although
the entry of new firms might reduce market share of existing firms, short run profits would
be not be negatively significantly impacted. The gains originating from the subsidy would
Introductory Economics 9
surpass the losses resulting from increased entrants. The short run profits would therefore be
high. The answer in part (c) above would not change.
QUESTION 3
Suppose the tea market can be described by the following equations.
Demand: P=10-Q ………….. (I)
Supply: P=Q-4 ……………………. (ii)
Where p is the price in dollars and Q is the quantity in kilograms.
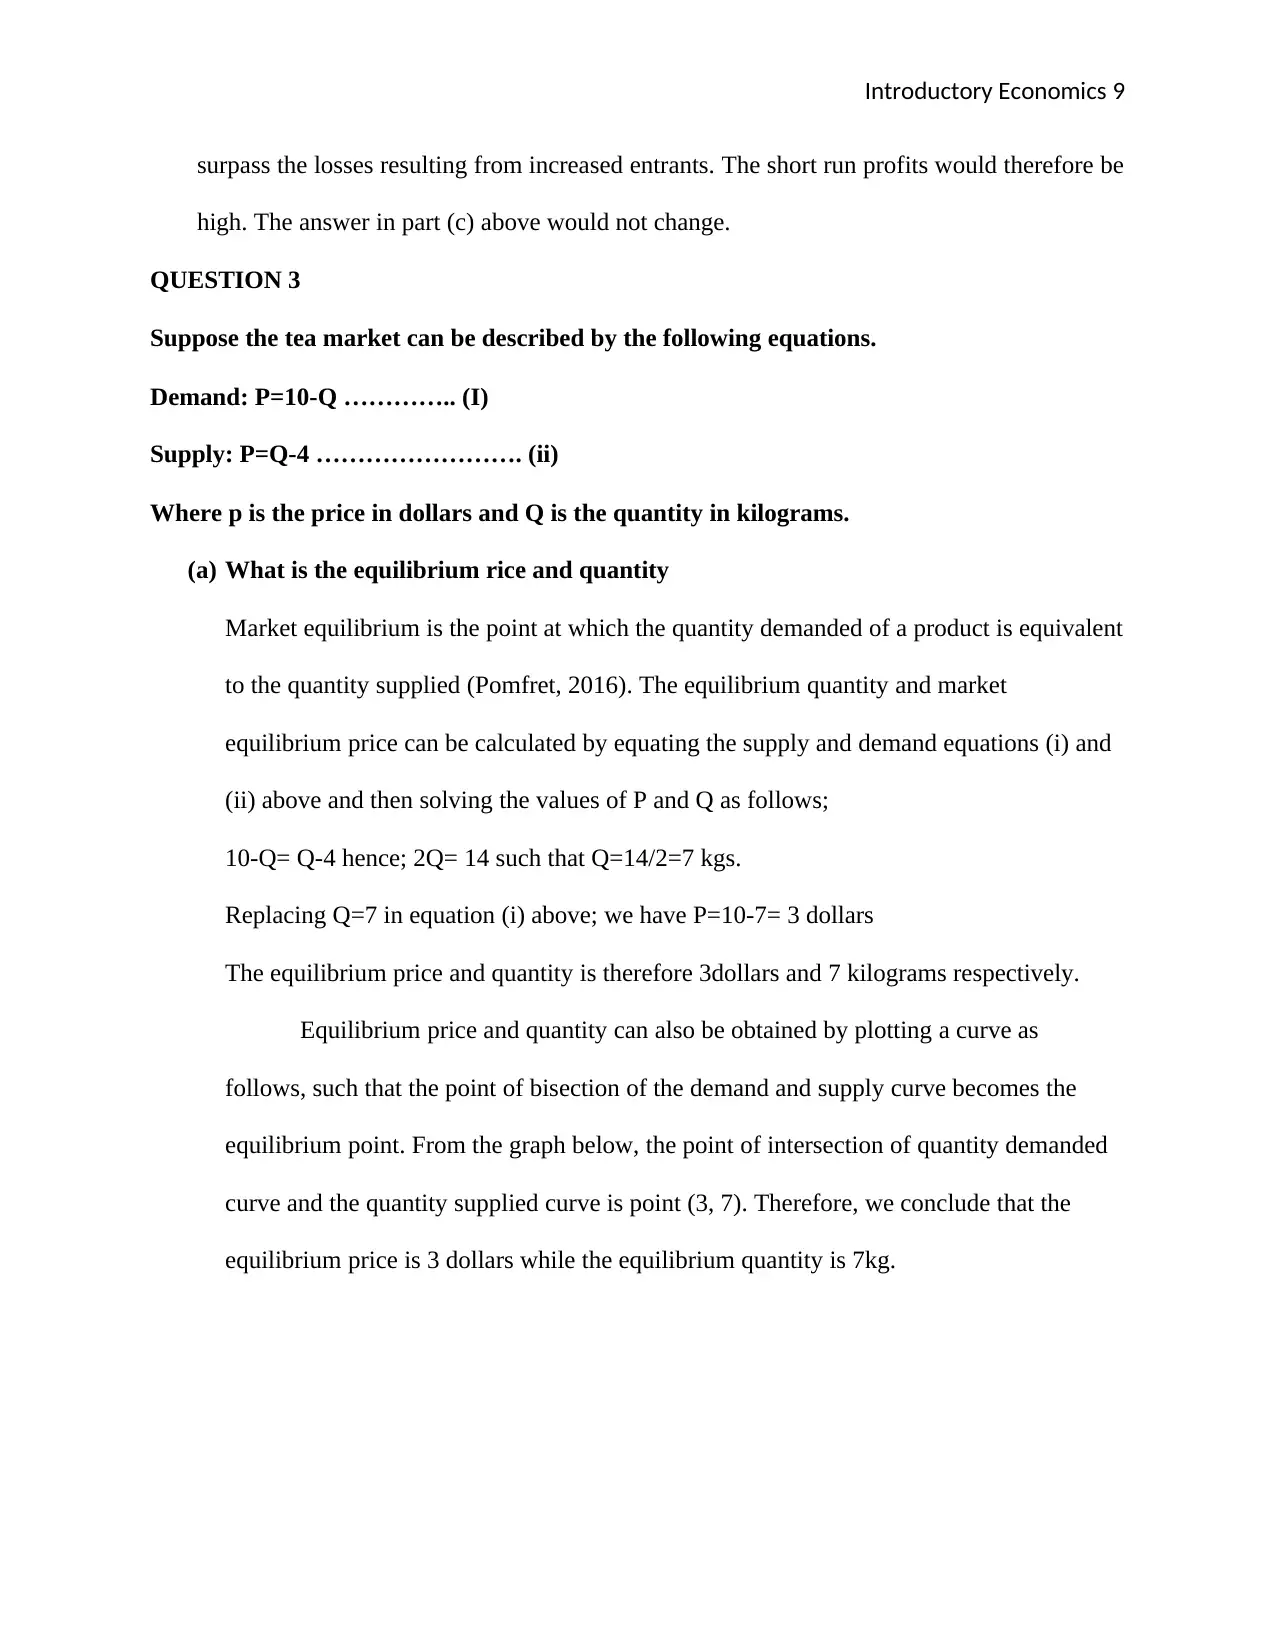
(a) What is the equilibrium rice and quantity
Market equilibrium is the point at which the quantity demanded of a product is equivalent
to the quantity supplied (Pomfret, 2016). The equilibrium quantity and market
equilibrium price can be calculated by equating the supply and demand equations (i) and
(ii) above and then solving the values of P and Q as follows;
10-Q= Q-4 hence; 2Q= 14 such that Q=14/2=7 kgs.
Replacing Q=7 in equation (i) above; we have P=10-7= 3 dollars
The equilibrium price and quantity is therefore 3dollars and 7 kilograms respectively.
Equilibrium price and quantity can also be obtained by plotting a curve as
follows, such that the point of bisection of the demand and supply curve becomes the
equilibrium point. From the graph below, the point of intersection of quantity demanded
curve and the quantity supplied curve is point (3, 7). Therefore, we conclude that the
equilibrium price is 3 dollars while the equilibrium quantity is 7kg.
surpass the losses resulting from increased entrants. The short run profits would therefore be
high. The answer in part (c) above would not change.
QUESTION 3
Suppose the tea market can be described by the following equations.
Demand: P=10-Q ………….. (I)
Supply: P=Q-4 ……………………. (ii)
Where p is the price in dollars and Q is the quantity in kilograms.
(a) What is the equilibrium rice and quantity
Market equilibrium is the point at which the quantity demanded of a product is equivalent
to the quantity supplied (Pomfret, 2016). The equilibrium quantity and market
equilibrium price can be calculated by equating the supply and demand equations (i) and
(ii) above and then solving the values of P and Q as follows;
10-Q= Q-4 hence; 2Q= 14 such that Q=14/2=7 kgs.
Replacing Q=7 in equation (i) above; we have P=10-7= 3 dollars
The equilibrium price and quantity is therefore 3dollars and 7 kilograms respectively.
Equilibrium price and quantity can also be obtained by plotting a curve as
follows, such that the point of bisection of the demand and supply curve becomes the
equilibrium point. From the graph below, the point of intersection of quantity demanded
curve and the quantity supplied curve is point (3, 7). Therefore, we conclude that the
equilibrium price is 3 dollars while the equilibrium quantity is 7kg.
⊘ This is a preview!⊘
Do you want full access?
Subscribe today to unlock all pages.
Trusted by 1+ million students worldwide
Introductory Economics 10
0 2 4 6 8 10 12
0
2
4
6
8
10
12
14
16
MARKET EQUILIBRIUM CURVE
Quantity Demanded Quantity Supplied
price new 0 1 2 3 4 5 6 7 8 9
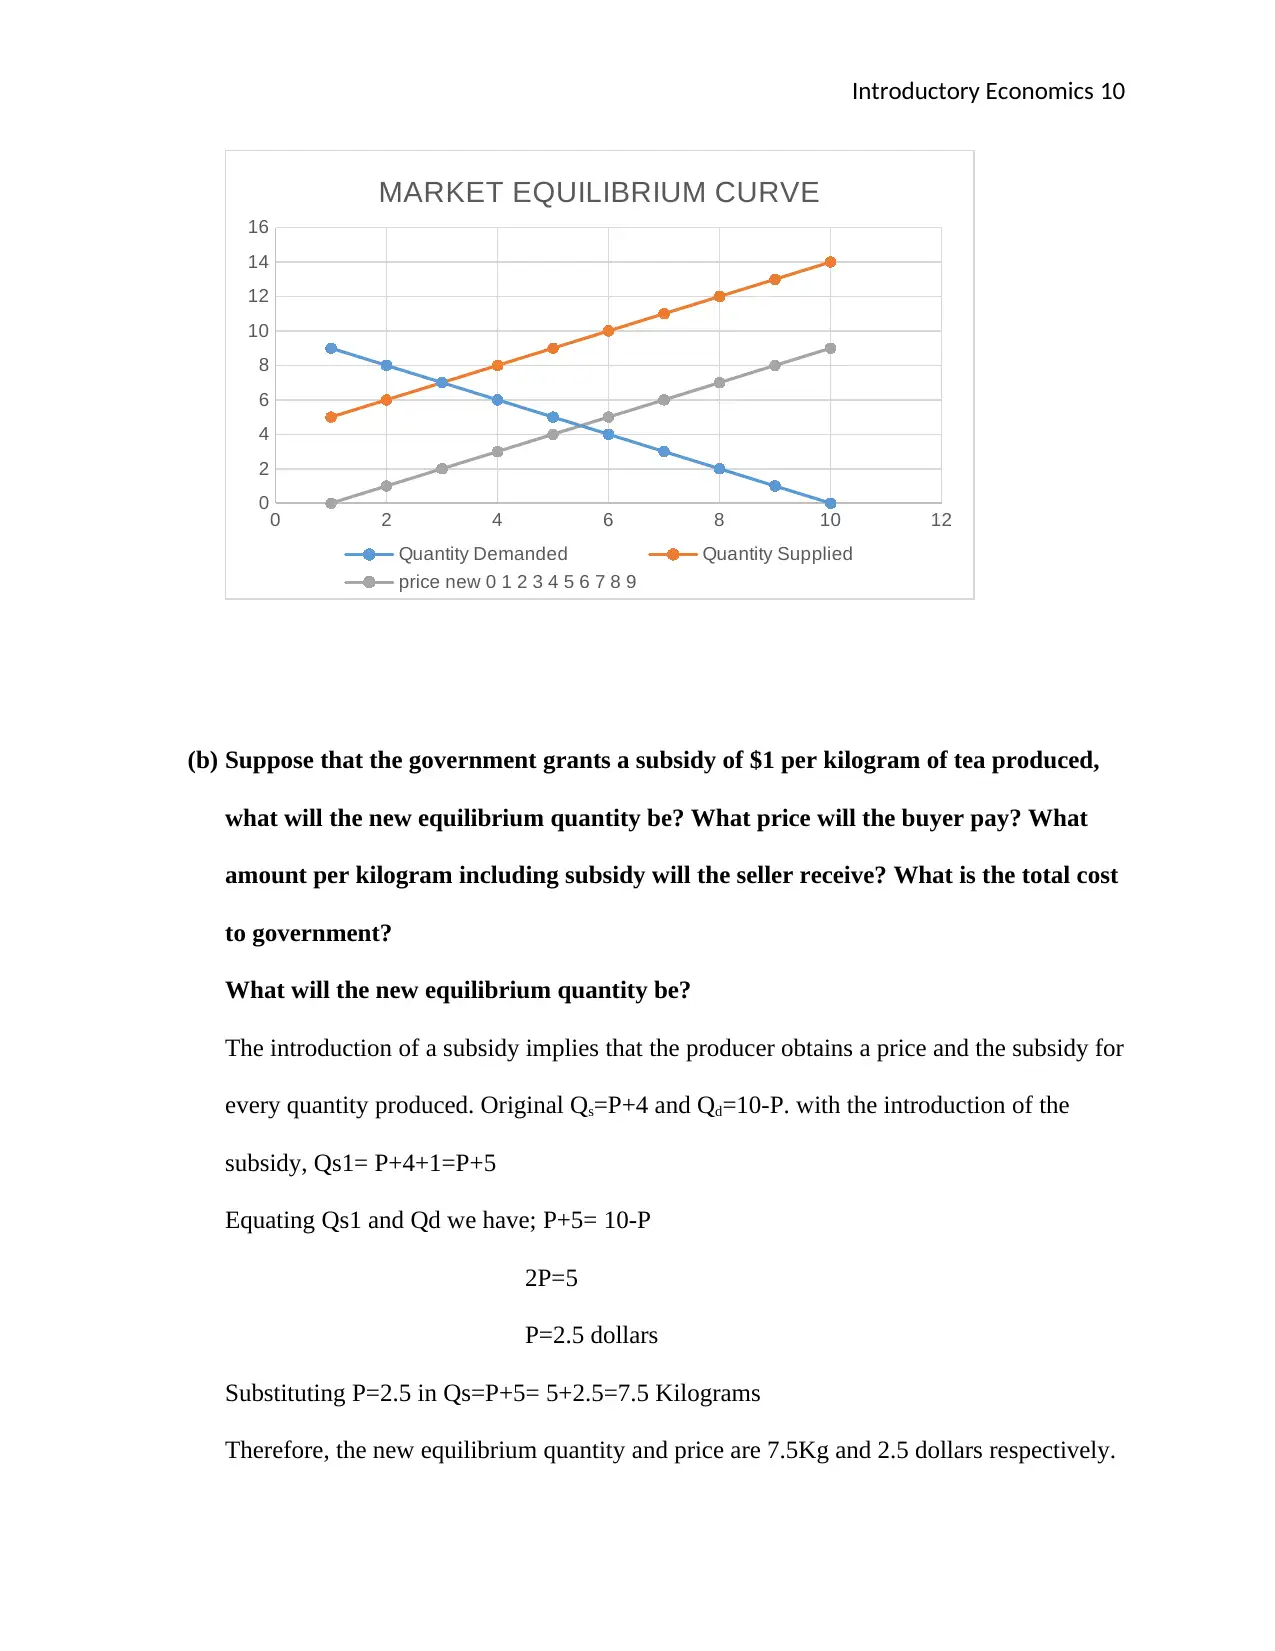
(b) Suppose that the government grants a subsidy of $1 per kilogram of tea produced,
what will the new equilibrium quantity be? What price will the buyer pay? What
amount per kilogram including subsidy will the seller receive? What is the total cost
to government?
What will the new equilibrium quantity be?
The introduction of a subsidy implies that the producer obtains a price and the subsidy for
every quantity produced. Original Qs=P+4 and Qd=10-P. with the introduction of the
subsidy, Qs1= P+4+1=P+5
Equating Qs1 and Qd we have; P+5= 10-P
2P=5
P=2.5 dollars
Substituting P=2.5 in Qs=P+5= 5+2.5=7.5 Kilograms
Therefore, the new equilibrium quantity and price are 7.5Kg and 2.5 dollars respectively.
0 2 4 6 8 10 12
0
2
4
6
8
10
12
14
16
MARKET EQUILIBRIUM CURVE
Quantity Demanded Quantity Supplied
price new 0 1 2 3 4 5 6 7 8 9
(b) Suppose that the government grants a subsidy of $1 per kilogram of tea produced,
what will the new equilibrium quantity be? What price will the buyer pay? What
amount per kilogram including subsidy will the seller receive? What is the total cost
to government?
What will the new equilibrium quantity be?
The introduction of a subsidy implies that the producer obtains a price and the subsidy for
every quantity produced. Original Qs=P+4 and Qd=10-P. with the introduction of the
subsidy, Qs1= P+4+1=P+5
Equating Qs1 and Qd we have; P+5= 10-P
2P=5
P=2.5 dollars
Substituting P=2.5 in Qs=P+5= 5+2.5=7.5 Kilograms
Therefore, the new equilibrium quantity and price are 7.5Kg and 2.5 dollars respectively.
Paraphrase This Document
Need a fresh take? Get an instant paraphrase of this document with our AI Paraphraser
Introductory Economics 11
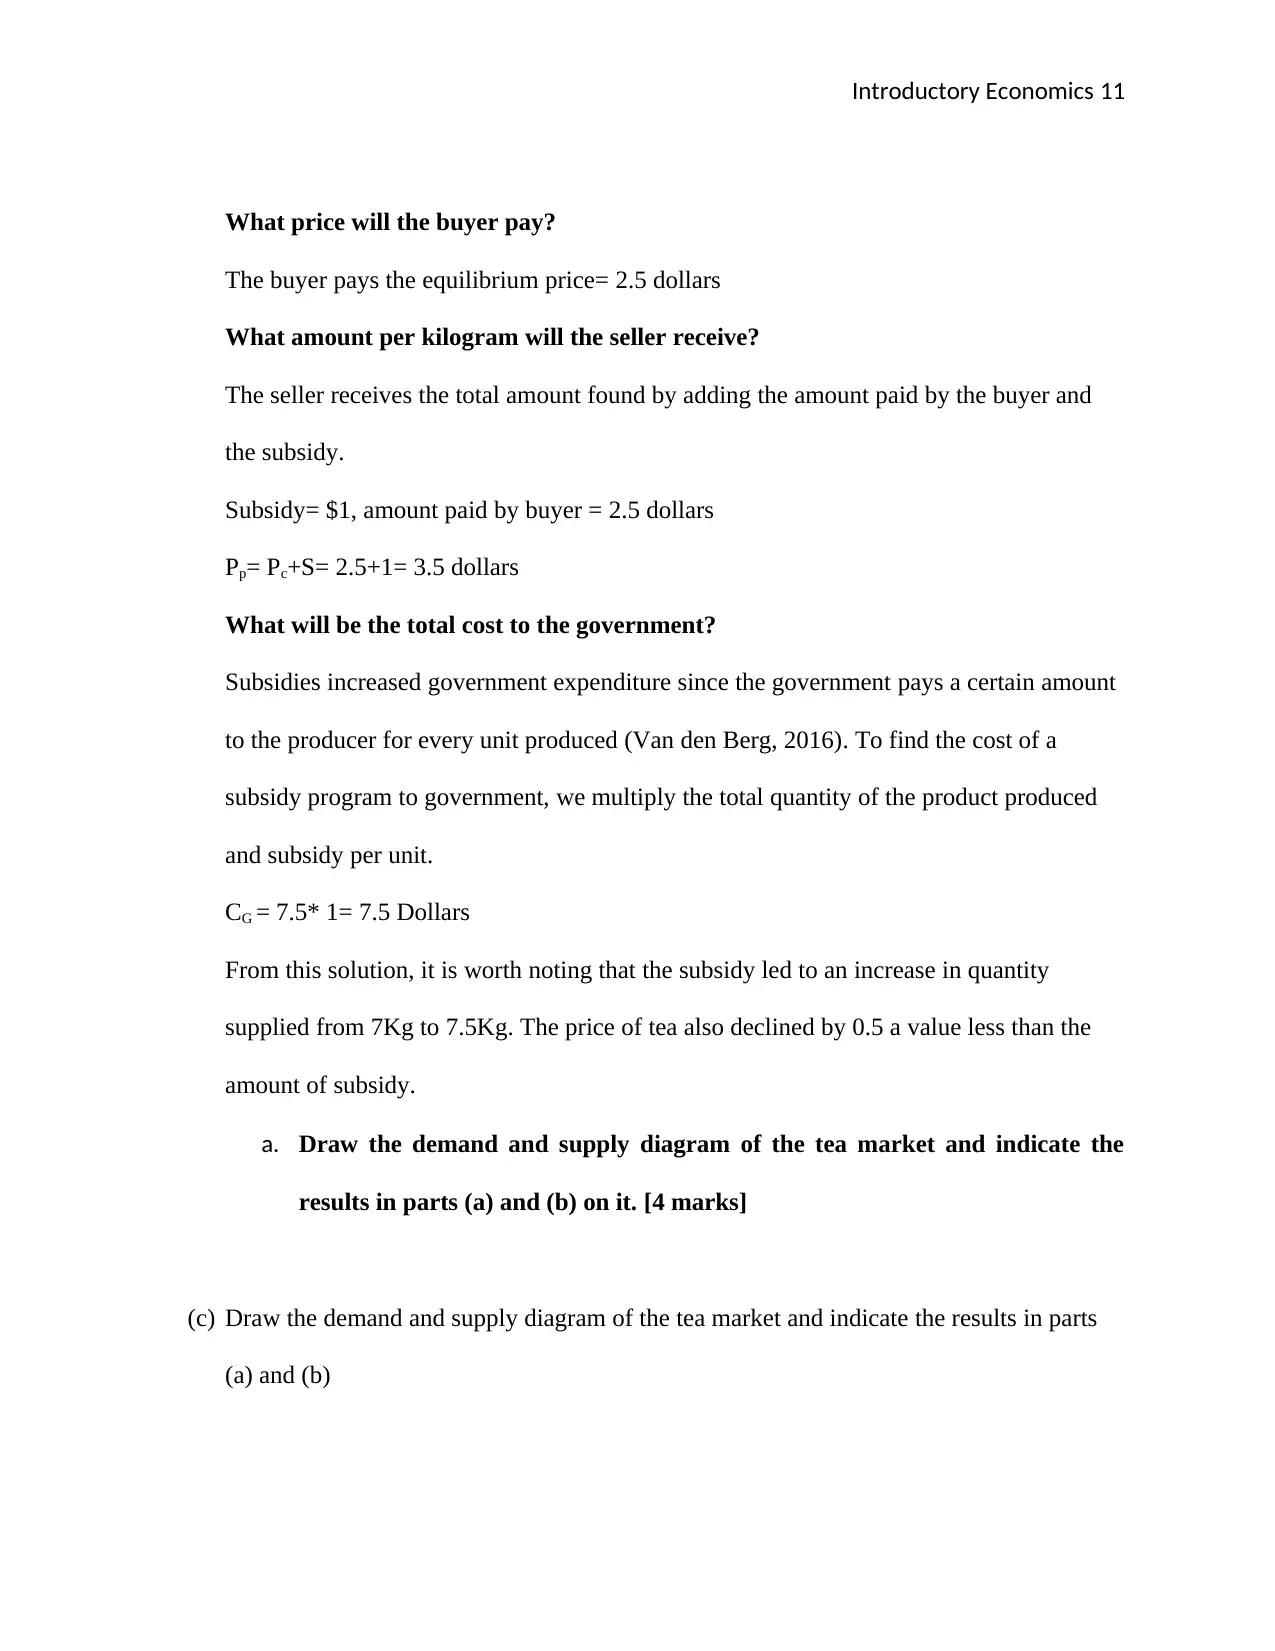
What price will the buyer pay?
The buyer pays the equilibrium price= 2.5 dollars
What amount per kilogram will the seller receive?
The seller receives the total amount found by adding the amount paid by the buyer and
the subsidy.
Subsidy= $1, amount paid by buyer = 2.5 dollars
Pp= Pc+S= 2.5+1= 3.5 dollars
What will be the total cost to the government?
Subsidies increased government expenditure since the government pays a certain amount
to the producer for every unit produced (Van den Berg, 2016). To find the cost of a
subsidy program to government, we multiply the total quantity of the product produced
and subsidy per unit.
CG = 7.5* 1= 7.5 Dollars
From this solution, it is worth noting that the subsidy led to an increase in quantity
supplied from 7Kg to 7.5Kg. The price of tea also declined by 0.5 a value less than the
amount of subsidy.
a. Draw the demand and supply diagram of the tea market and indicate the
results in parts (a) and (b) on it. [4 marks]
(c) Draw the demand and supply diagram of the tea market and indicate the results in parts
(a) and (b)
Introductory Economics 12
0 1 2 3 4 5 6 7 8
0
2
4
6
8
10
12
SUPPLY AND DEMAND CURVE OF TEA
MARKET
Quantity Demanded Quantity Suplied
0 1 2 3 4 5 6 7 8
0
1
2
3
4
5
6
7
8
9
10
SUPPLY AND DEMAND CURVE OF TEA
MARKET WITH SUBSIDY
Quantity Demanded subsidized prices
0 1 2 3 4 5 6 7 8
0
2
4
6
8
10
12
SUPPLY AND DEMAND CURVE OF TEA
MARKET
Quantity Demanded Quantity Suplied
0 1 2 3 4 5 6 7 8
0
1
2
3
4
5
6
7
8
9
10
SUPPLY AND DEMAND CURVE OF TEA
MARKET WITH SUBSIDY
Quantity Demanded subsidized prices
⊘ This is a preview!⊘
Do you want full access?
Subscribe today to unlock all pages.
Trusted by 1+ million students worldwide
1 out of 14
Related Documents


Your All-in-One AI-Powered Toolkit for Academic Success.
+13062052269
info@desklib.com
Available 24*7 on WhatsApp / Email
![[object Object]](/_next/static/media/star-bottom.7253800d.svg)
Unlock your academic potential
Copyright © 2020–2026 A2Z Services. All Rights Reserved. Developed and managed by ZUCOL.