WM Morrison Financial Performance Analysis and Investment Advice
VerifiedAdded on 2020/02/05
|16
|5019
|262
Report
AI Summary
This report analyzes the financial performance of WM Morrison for the years 2014 and 2015. It begins with a comparative ratio analysis, examining profitability, liquidity, solvency, and efficiency. The report then comments on Morrison's business and financial structure, comparing key financial figures between the two years. It provides investment advice to potential investors and explores alternative financial sources to meet requirements. Furthermore, the report covers cash flow budgeting for Green Limited, offering recommendations for cash flow management. Finally, it delves into investment appraisal techniques using discounted and non-discounted methods, providing recommendations based on the results. The analysis includes detailed calculations, table of contents, index of tables, and illustrations to support the findings.
Financial decision making for managers
1
1
Paraphrase This Document
Need a fresh take? Get an instant paraphrase of this document with our AI Paraphraser
Table of Contents
INTRODUCTION ...............................................................................................................................3
A. Comparative ratio analysis of Morrison for the time period for the year 2014 and 2015..........3
B. Comment on business structure and financial structure of Morrison.........................................4
C. Compare the financial figures for the year 2014 and 2015.........................................................5
D. Advice a potential investor of Morrison to invest money in the business..................................5
E. Meeting financial requirement through possible alternatives and assessing its implications.....6
F. Advice how working capital can be managed by Morrison.........................................................7
TASK 2 ................................................................................................................................................7
A. Preparation of cash flow budget.................................................................................................7
B. Make recommendations to administrate cash flow.....................................................................8
TASK 3 ..............................................................................................................................................10
A. Using discounted and non-discounted investment appraisal techniques..................................10
B. Recommendation on the basis of results identified...................................................................11
CONCLUSION..................................................................................................................................12
REFERENCES...................................................................................................................................13
APPENDIX........................................................................................................................................15
Index of Tables
Table 1: Comparison of financial figures of Morrison ........................................................................5
Table 2: Cash budget of Green Limited for the period of six months ending on 31st December........8
Table 3: Calculation of cash inflow of project A................................................................................10
Table 4: Calculation of cash inflow of project B...............................................................................10
Table 5: Calculation of pay back period.............................................................................................10
Table 6: Calculation of accounting rate of return...............................................................................11
Table 7: Calculation of Net present value and internal rate of return ................................................11
Illustration Index
Illustration 1: Business structure of WM Morrison..............................................................................4
2
INTRODUCTION
Managers play an important role in business as they are responsible for framing policies and
taking decisions in achieving success in the market. Finance manager in an organization have the
duty to evaluate company's financial strengths and weaknesses so that effective financial decisions
can be carried out to perform better in the future. WM Morrison is the fourth largest supermarket
chain of UK which operates in the retail industry. This assignment will conduct comparative study
of financial performance of Morrison for two financial years i.e. 2014 and 2015. It will be done by
using ratio analysis techniques like profitability, solvency, liquidity and efficiency so that each and
every aspect can be examined. Moreover, cash budget will be constructed for Green Limited and
analysed to assure surplus funds every time. In the last, investment decision will be taken for
Hanley Manufacturing Ltd by using capital budgeting techniques.
TASK 1
A. Comparative ratio analysis of Morrison for the time period for the year 2014 and 2015
Profitability:
In 2015, Morrison's GM and NM have been declined from 6.07% to 4.53% and 1.35% to
adverse 4.53%. It reflects that WM Morrison do not performed well in the year 2015 because of
fewer earnings through operations. Less turnover and ineffective control over cost are the two
reasons behind decreasing profitability in 2015 (Alnaa, Adongo and Juabin, 2016).
Liquidity:
In 2015, CR remained unchanged to 0.5 while QR shows a little bit increase by 0.02 as it has
been reached to 0.18. High proportionate decrease in current assets (CA) due to having less
inventory, trade receivables and cash position as compare to proportionate reduction in current
liabilities (CL) such as payables is the reason behind such occurrence. Idle CR and QR for retail
sector is 2:1 and 1:1. It implies that Morrison is not able to meet their short term liabilities timely
(Petruzzo and et.al., 2015).
Solvency:
Debt/equity ratio has been improved from 0.53 to 0.7 while standard ratio is 0.5:1. It shows
that there is high financial risk to invest money in Morrison. It has been increased because of using
additional debt and less equity in the capital structure. Although company achieved industrial
standard but still, it must be keep in mind that very high use of equity capital also create negative
impact (Matthew, Fada and Ukonu, 2016). It is because in this situation, investors will demand
more return on their capital. Thus, the profit of less cost of debt capital is offset by increase in the
cost of equity which is not good.
3
⊘ This is a preview!⊘
Do you want full access?
Subscribe today to unlock all pages.
Trusted by 1+ million students worldwide
Efficiency:
ATR has been increased to 1.69 times while ITR has been reduced from 20.34 to 21.26 in
2015. It is because of having declined total asset, COGS and inventory as well. It demonstrates that
Morrison is using assets efficiently to generate more revenue while inventory is not utilized in an
effective manner (Alnaa, Adongo and Juabin, 2016).
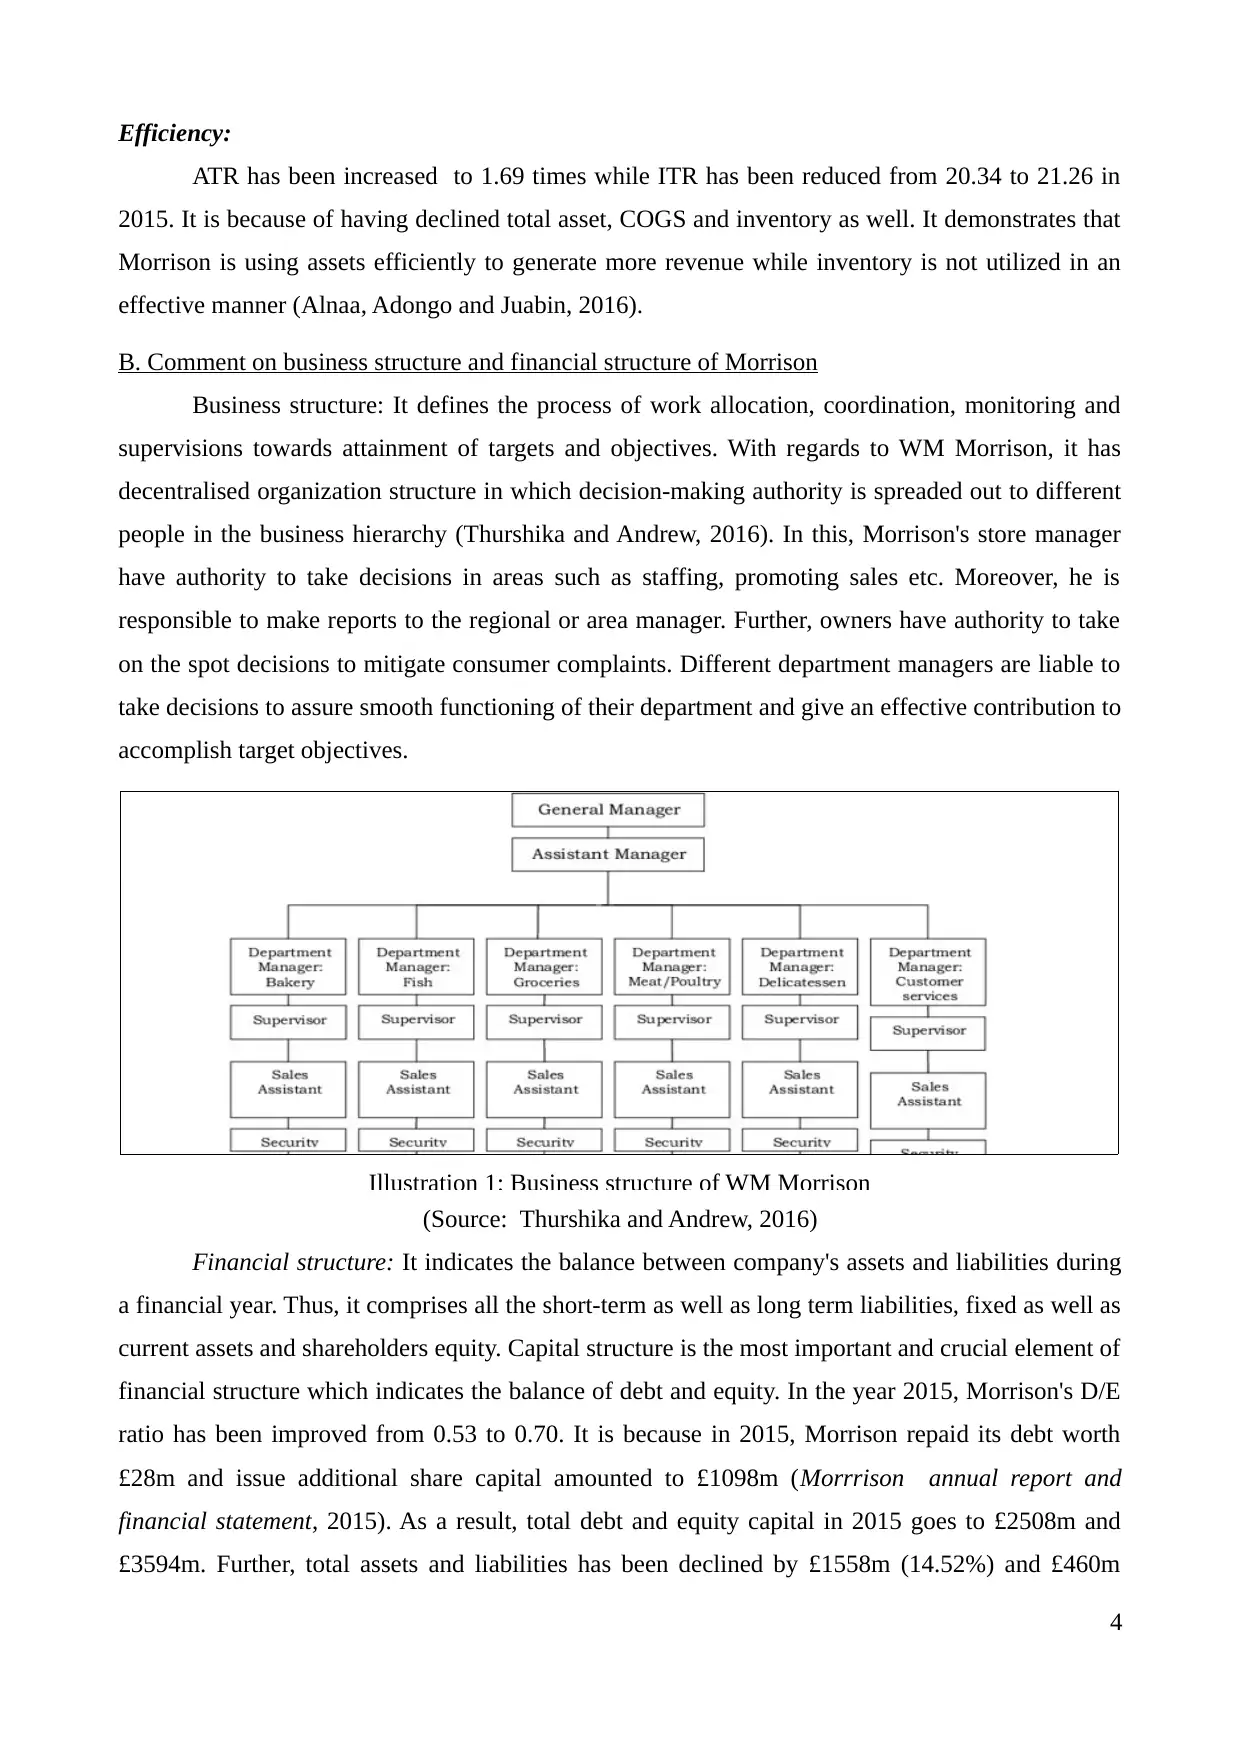
B. Comment on business structure and financial structure of Morrison
Business structure: It defines the process of work allocation, coordination, monitoring and
supervisions towards attainment of targets and objectives. With regards to WM Morrison, it has
decentralised organization structure in which decision-making authority is spreaded out to different
people in the business hierarchy (Thurshika and Andrew, 2016). In this, Morrison's store manager
have authority to take decisions in areas such as staffing, promoting sales etc. Moreover, he is
responsible to make reports to the regional or area manager. Further, owners have authority to take
on the spot decisions to mitigate consumer complaints. Different department managers are liable to
take decisions to assure smooth functioning of their department and give an effective contribution to
accomplish target objectives.
Illustration 1: Business structure of WM Morrison
(Source: Thurshika and Andrew, 2016)
Financial structure: It indicates the balance between company's assets and liabilities during
a financial year. Thus, it comprises all the short-term as well as long term liabilities, fixed as well as
current assets and shareholders equity. Capital structure is the most important and crucial element of
financial structure which indicates the balance of debt and equity. In the year 2015, Morrison's D/E
ratio has been improved from 0.53 to 0.70. It is because in 2015, Morrison repaid its debt worth
£28m and issue additional share capital amounted to £1098m (Morrrison annual report and
financial statement, 2015). As a result, total debt and equity capital in 2015 goes to £2508m and
£3594m. Further, total assets and liabilities has been declined by £1558m (14.52%) and £460m
4
ATR has been increased to 1.69 times while ITR has been reduced from 20.34 to 21.26 in
2015. It is because of having declined total asset, COGS and inventory as well. It demonstrates that
Morrison is using assets efficiently to generate more revenue while inventory is not utilized in an
effective manner (Alnaa, Adongo and Juabin, 2016).
B. Comment on business structure and financial structure of Morrison
Business structure: It defines the process of work allocation, coordination, monitoring and
supervisions towards attainment of targets and objectives. With regards to WM Morrison, it has
decentralised organization structure in which decision-making authority is spreaded out to different
people in the business hierarchy (Thurshika and Andrew, 2016). In this, Morrison's store manager
have authority to take decisions in areas such as staffing, promoting sales etc. Moreover, he is
responsible to make reports to the regional or area manager. Further, owners have authority to take
on the spot decisions to mitigate consumer complaints. Different department managers are liable to
take decisions to assure smooth functioning of their department and give an effective contribution to
accomplish target objectives.
Illustration 1: Business structure of WM Morrison
(Source: Thurshika and Andrew, 2016)
Financial structure: It indicates the balance between company's assets and liabilities during
a financial year. Thus, it comprises all the short-term as well as long term liabilities, fixed as well as
current assets and shareholders equity. Capital structure is the most important and crucial element of
financial structure which indicates the balance of debt and equity. In the year 2015, Morrison's D/E
ratio has been improved from 0.53 to 0.70. It is because in 2015, Morrison repaid its debt worth
£28m and issue additional share capital amounted to £1098m (Morrrison annual report and
financial statement, 2015). As a result, total debt and equity capital in 2015 goes to £2508m and
£3594m. Further, total assets and liabilities has been declined by £1558m (14.52%) and £460m
4
Paraphrase This Document
Need a fresh take? Get an instant paraphrase of this document with our AI Paraphraser
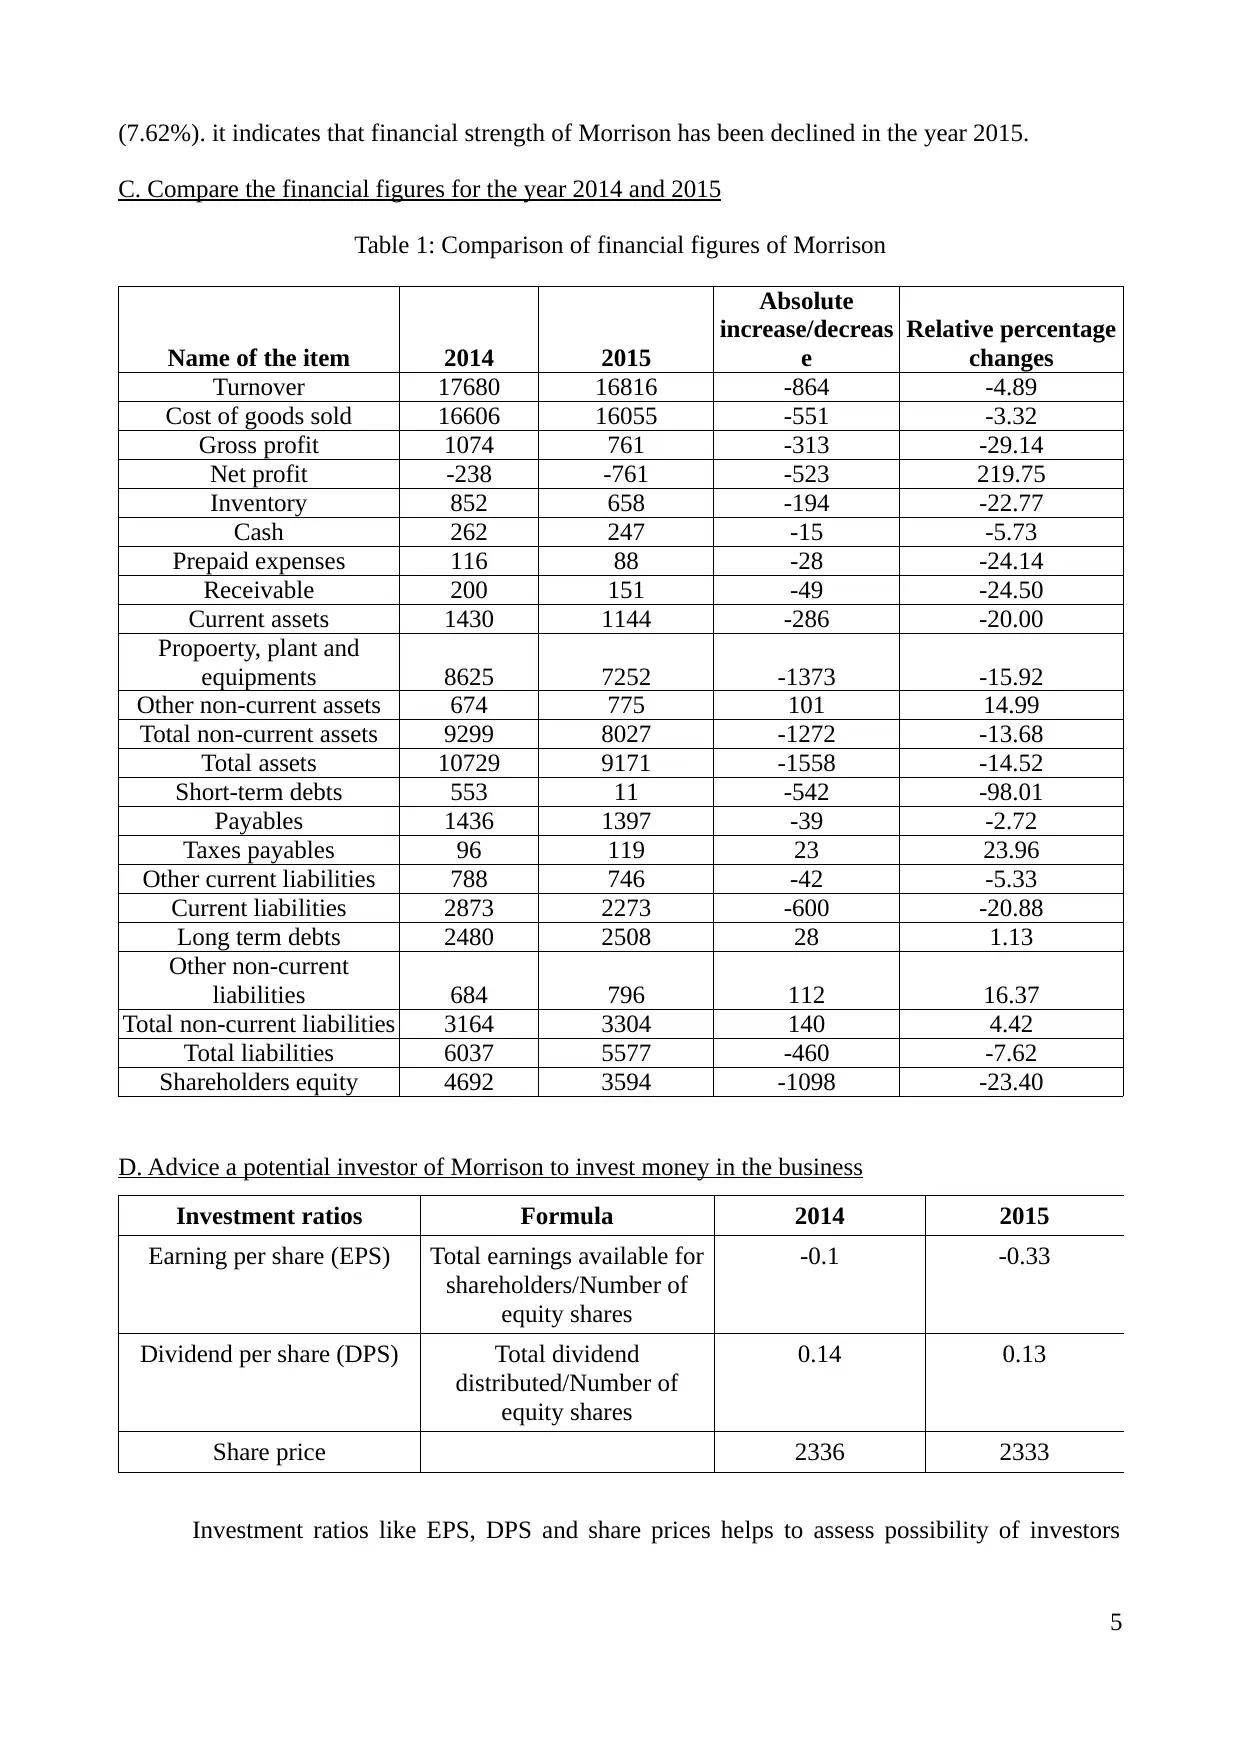
(7.62%). it indicates that financial strength of Morrison has been declined in the year 2015.
C. Compare the financial figures for the year 2014 and 2015
Table 1: Comparison of financial figures of Morrison
Name of the item 2014 2015
Absolute
increase/decreas
e
Relative percentage
changes
Turnover 17680 16816 -864 -4.89
Cost of goods sold 16606 16055 -551 -3.32
Gross profit 1074 761 -313 -29.14
Net profit -238 -761 -523 219.75
Inventory 852 658 -194 -22.77
Cash 262 247 -15 -5.73
Prepaid expenses 116 88 -28 -24.14
Receivable 200 151 -49 -24.50
Current assets 1430 1144 -286 -20.00
Propoerty, plant and
equipments 8625 7252 -1373 -15.92
Other non-current assets 674 775 101 14.99
Total non-current assets 9299 8027 -1272 -13.68
Total assets 10729 9171 -1558 -14.52
Short-term debts 553 11 -542 -98.01
Payables 1436 1397 -39 -2.72
Taxes payables 96 119 23 23.96
Other current liabilities 788 746 -42 -5.33
Current liabilities 2873 2273 -600 -20.88
Long term debts 2480 2508 28 1.13
Other non-current
liabilities 684 796 112 16.37
Total non-current liabilities 3164 3304 140 4.42
Total liabilities 6037 5577 -460 -7.62
Shareholders equity 4692 3594 -1098 -23.40
D. Advice a potential investor of Morrison to invest money in the business
Investment ratios Formula 2014 2015
Earning per share (EPS) Total earnings available for
shareholders/Number of
equity shares
-0.1 -0.33
Dividend per share (DPS) Total dividend
distributed/Number of
equity shares
0.14 0.13
Share price 2336 2333
Investment ratios like EPS, DPS and share prices helps to assess possibility of investors
5
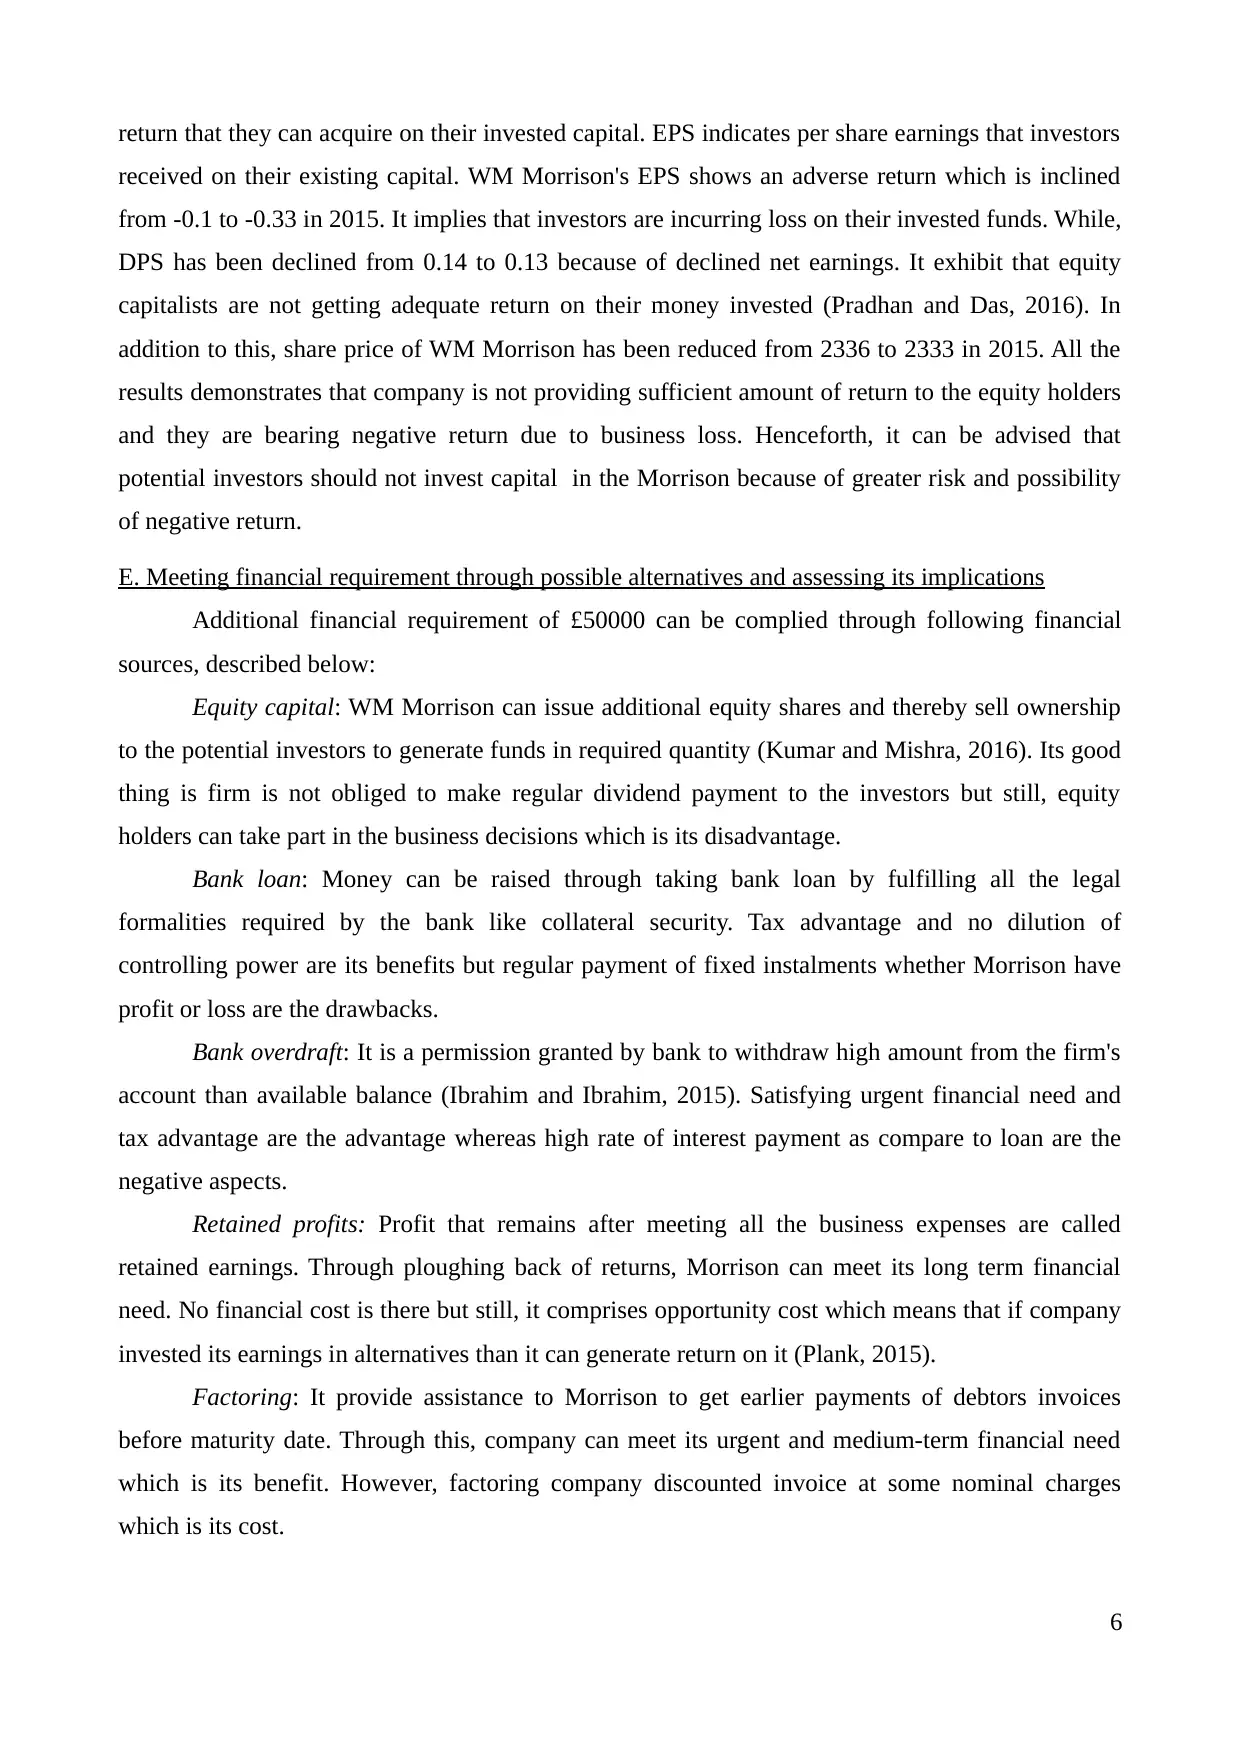
return that they can acquire on their invested capital. EPS indicates per share earnings that investors
received on their existing capital. WM Morrison's EPS shows an adverse return which is inclined
from -0.1 to -0.33 in 2015. It implies that investors are incurring loss on their invested funds. While,
DPS has been declined from 0.14 to 0.13 because of declined net earnings. It exhibit that equity
capitalists are not getting adequate return on their money invested (Pradhan and Das, 2016). In
addition to this, share price of WM Morrison has been reduced from 2336 to 2333 in 2015. All the
results demonstrates that company is not providing sufficient amount of return to the equity holders
and they are bearing negative return due to business loss. Henceforth, it can be advised that
potential investors should not invest capital in the Morrison because of greater risk and possibility
of negative return.
E. Meeting financial requirement through possible alternatives and assessing its implications
Additional financial requirement of £50000 can be complied through following financial
sources, described below:
Equity capital: WM Morrison can issue additional equity shares and thereby sell ownership
to the potential investors to generate funds in required quantity (Kumar and Mishra, 2016). Its good
thing is firm is not obliged to make regular dividend payment to the investors but still, equity
holders can take part in the business decisions which is its disadvantage.
Bank loan: Money can be raised through taking bank loan by fulfilling all the legal
formalities required by the bank like collateral security. Tax advantage and no dilution of
controlling power are its benefits but regular payment of fixed instalments whether Morrison have
profit or loss are the drawbacks.
Bank overdraft: It is a permission granted by bank to withdraw high amount from the firm's
account than available balance (Ibrahim and Ibrahim, 2015). Satisfying urgent financial need and
tax advantage are the advantage whereas high rate of interest payment as compare to loan are the
negative aspects.
Retained profits: Profit that remains after meeting all the business expenses are called
retained earnings. Through ploughing back of returns, Morrison can meet its long term financial
need. No financial cost is there but still, it comprises opportunity cost which means that if company
invested its earnings in alternatives than it can generate return on it (Plank, 2015).
Factoring: It provide assistance to Morrison to get earlier payments of debtors invoices
before maturity date. Through this, company can meet its urgent and medium-term financial need
which is its benefit. However, factoring company discounted invoice at some nominal charges
which is its cost.
6
⊘ This is a preview!⊘
Do you want full access?
Subscribe today to unlock all pages.
Trusted by 1+ million students worldwide
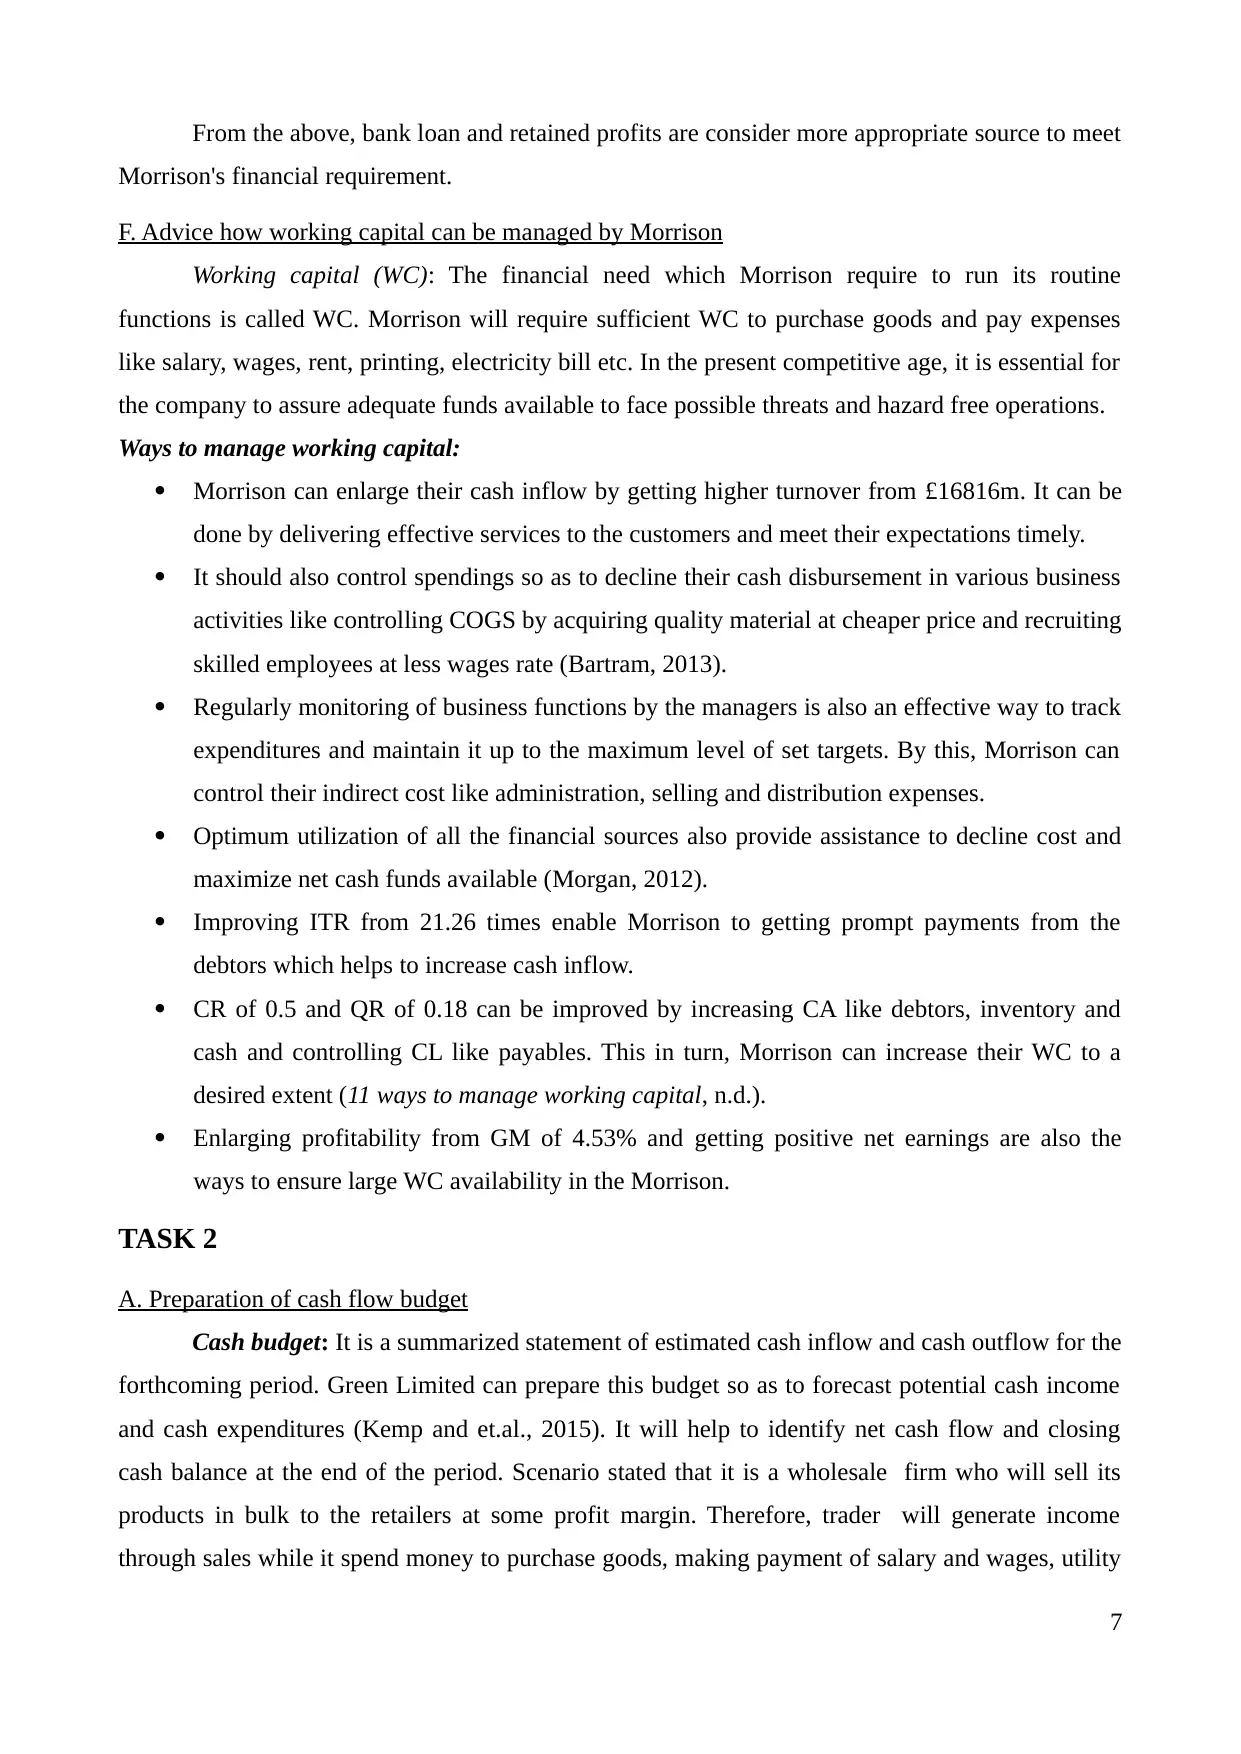
From the above, bank loan and retained profits are consider more appropriate source to meet
Morrison's financial requirement.
F. Advice how working capital can be managed by Morrison
Working capital (WC): The financial need which Morrison require to run its routine
functions is called WC. Morrison will require sufficient WC to purchase goods and pay expenses
like salary, wages, rent, printing, electricity bill etc. In the present competitive age, it is essential for
the company to assure adequate funds available to face possible threats and hazard free operations.
Ways to manage working capital:
Morrison can enlarge their cash inflow by getting higher turnover from £16816m. It can be
done by delivering effective services to the customers and meet their expectations timely.
It should also control spendings so as to decline their cash disbursement in various business
activities like controlling COGS by acquiring quality material at cheaper price and recruiting
skilled employees at less wages rate (Bartram, 2013).
Regularly monitoring of business functions by the managers is also an effective way to track
expenditures and maintain it up to the maximum level of set targets. By this, Morrison can
control their indirect cost like administration, selling and distribution expenses.
Optimum utilization of all the financial sources also provide assistance to decline cost and
maximize net cash funds available (Morgan, 2012).
Improving ITR from 21.26 times enable Morrison to getting prompt payments from the
debtors which helps to increase cash inflow.
CR of 0.5 and QR of 0.18 can be improved by increasing CA like debtors, inventory and
cash and controlling CL like payables. This in turn, Morrison can increase their WC to a
desired extent (11 ways to manage working capital, n.d.).
Enlarging profitability from GM of 4.53% and getting positive net earnings are also the
ways to ensure large WC availability in the Morrison.
TASK 2
A. Preparation of cash flow budget
Cash budget: It is a summarized statement of estimated cash inflow and cash outflow for the
forthcoming period. Green Limited can prepare this budget so as to forecast potential cash income
and cash expenditures (Kemp and et.al., 2015). It will help to identify net cash flow and closing
cash balance at the end of the period. Scenario stated that it is a wholesale firm who will sell its
products in bulk to the retailers at some profit margin. Therefore, trader will generate income
through sales while it spend money to purchase goods, making payment of salary and wages, utility
7
Paraphrase This Document
Need a fresh take? Get an instant paraphrase of this document with our AI Paraphraser
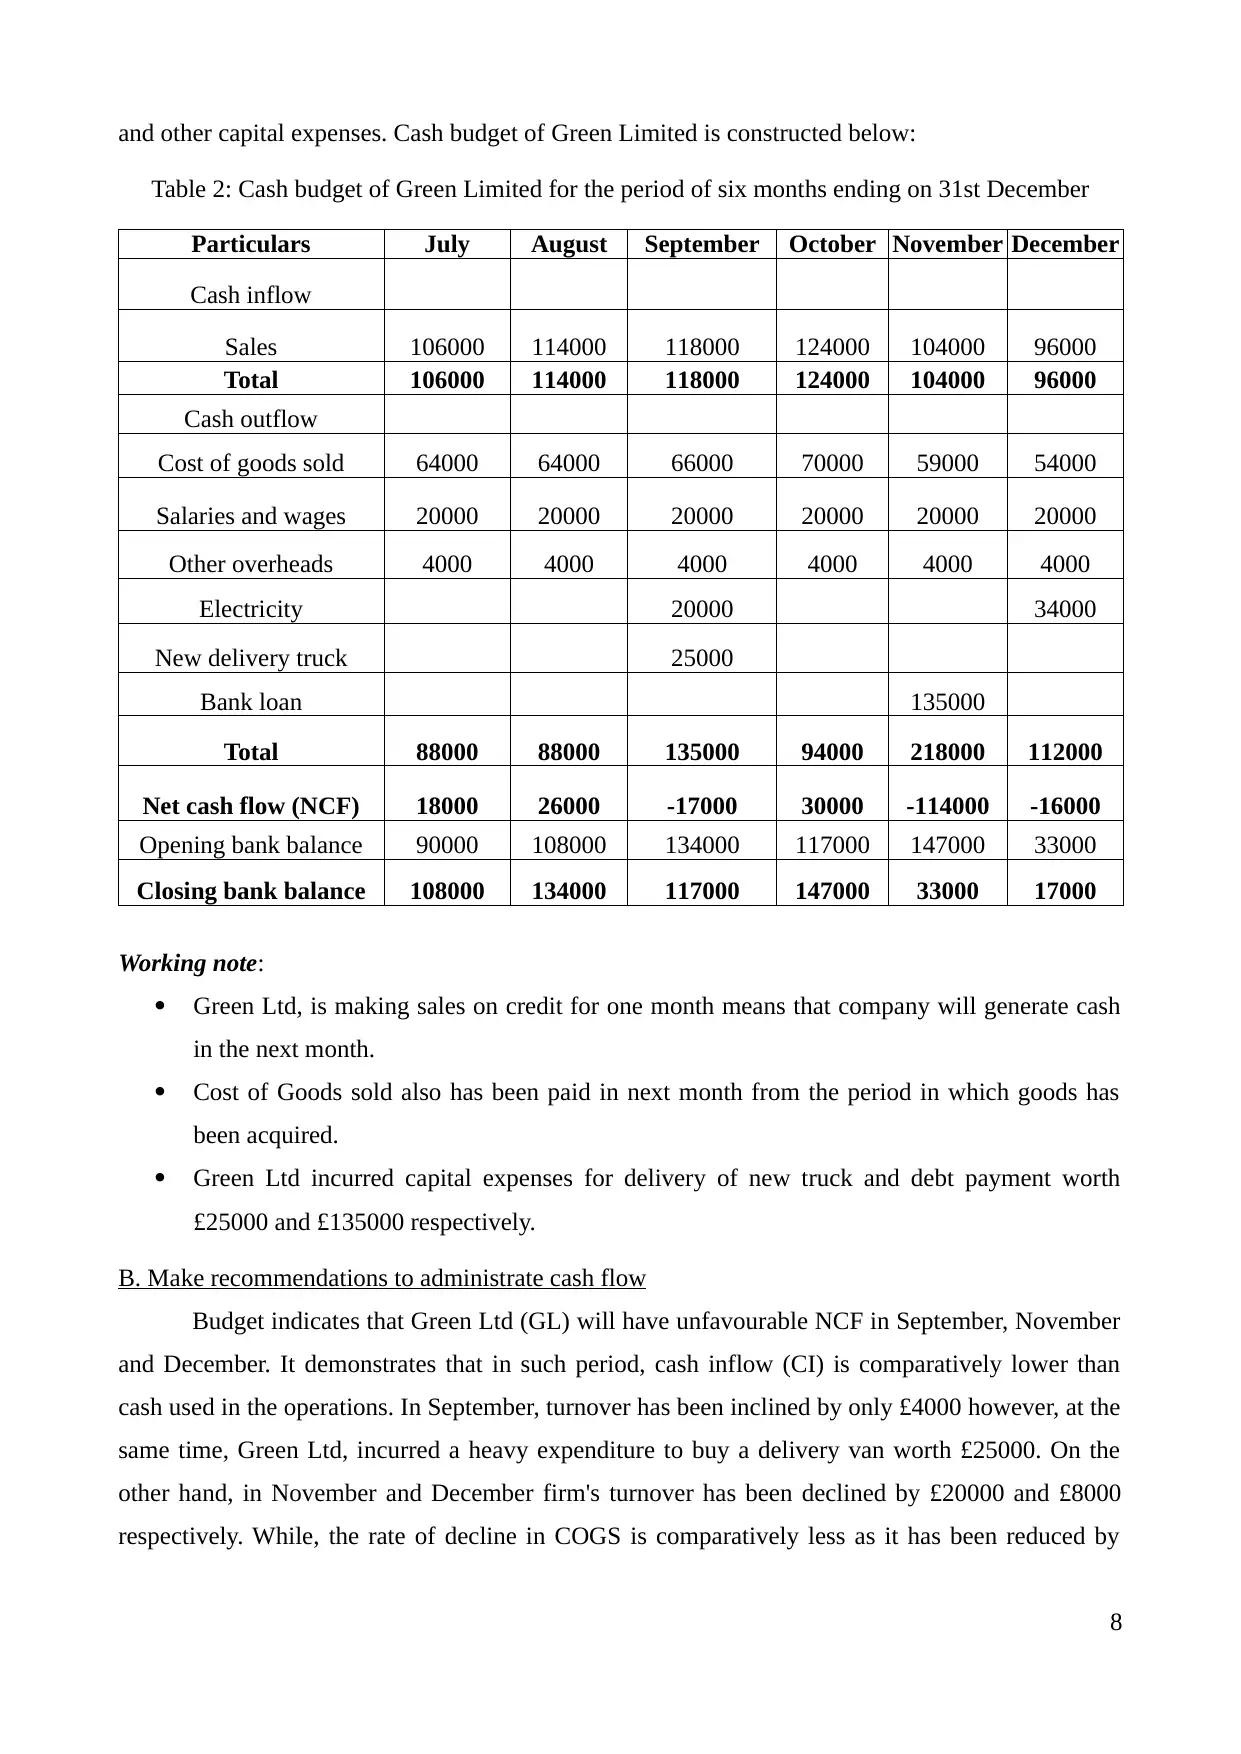
and other capital expenses. Cash budget of Green Limited is constructed below:
Table 2: Cash budget of Green Limited for the period of six months ending on 31st December
Particulars July August September October November December
Cash inflow
Sales 106000 114000 118000 124000 104000 96000
Total 106000 114000 118000 124000 104000 96000
Cash outflow
Cost of goods sold 64000 64000 66000 70000 59000 54000
Salaries and wages 20000 20000 20000 20000 20000 20000
Other overheads 4000 4000 4000 4000 4000 4000
Electricity 20000 34000
New delivery truck 25000
Bank loan 135000
Total 88000 88000 135000 94000 218000 112000
Net cash flow (NCF) 18000 26000 -17000 30000 -114000 -16000
Opening bank balance 90000 108000 134000 117000 147000 33000
Closing bank balance 108000 134000 117000 147000 33000 17000
Working note:
Green Ltd, is making sales on credit for one month means that company will generate cash
in the next month.
Cost of Goods sold also has been paid in next month from the period in which goods has
been acquired.
Green Ltd incurred capital expenses for delivery of new truck and debt payment worth
£25000 and £135000 respectively.
B. Make recommendations to administrate cash flow
Budget indicates that Green Ltd (GL) will have unfavourable NCF in September, November
and December. It demonstrates that in such period, cash inflow (CI) is comparatively lower than
cash used in the operations. In September, turnover has been inclined by only £4000 however, at the
same time, Green Ltd, incurred a heavy expenditure to buy a delivery van worth £25000. On the
other hand, in November and December firm's turnover has been declined by £20000 and £8000
respectively. While, the rate of decline in COGS is comparatively less as it has been reduced by
8
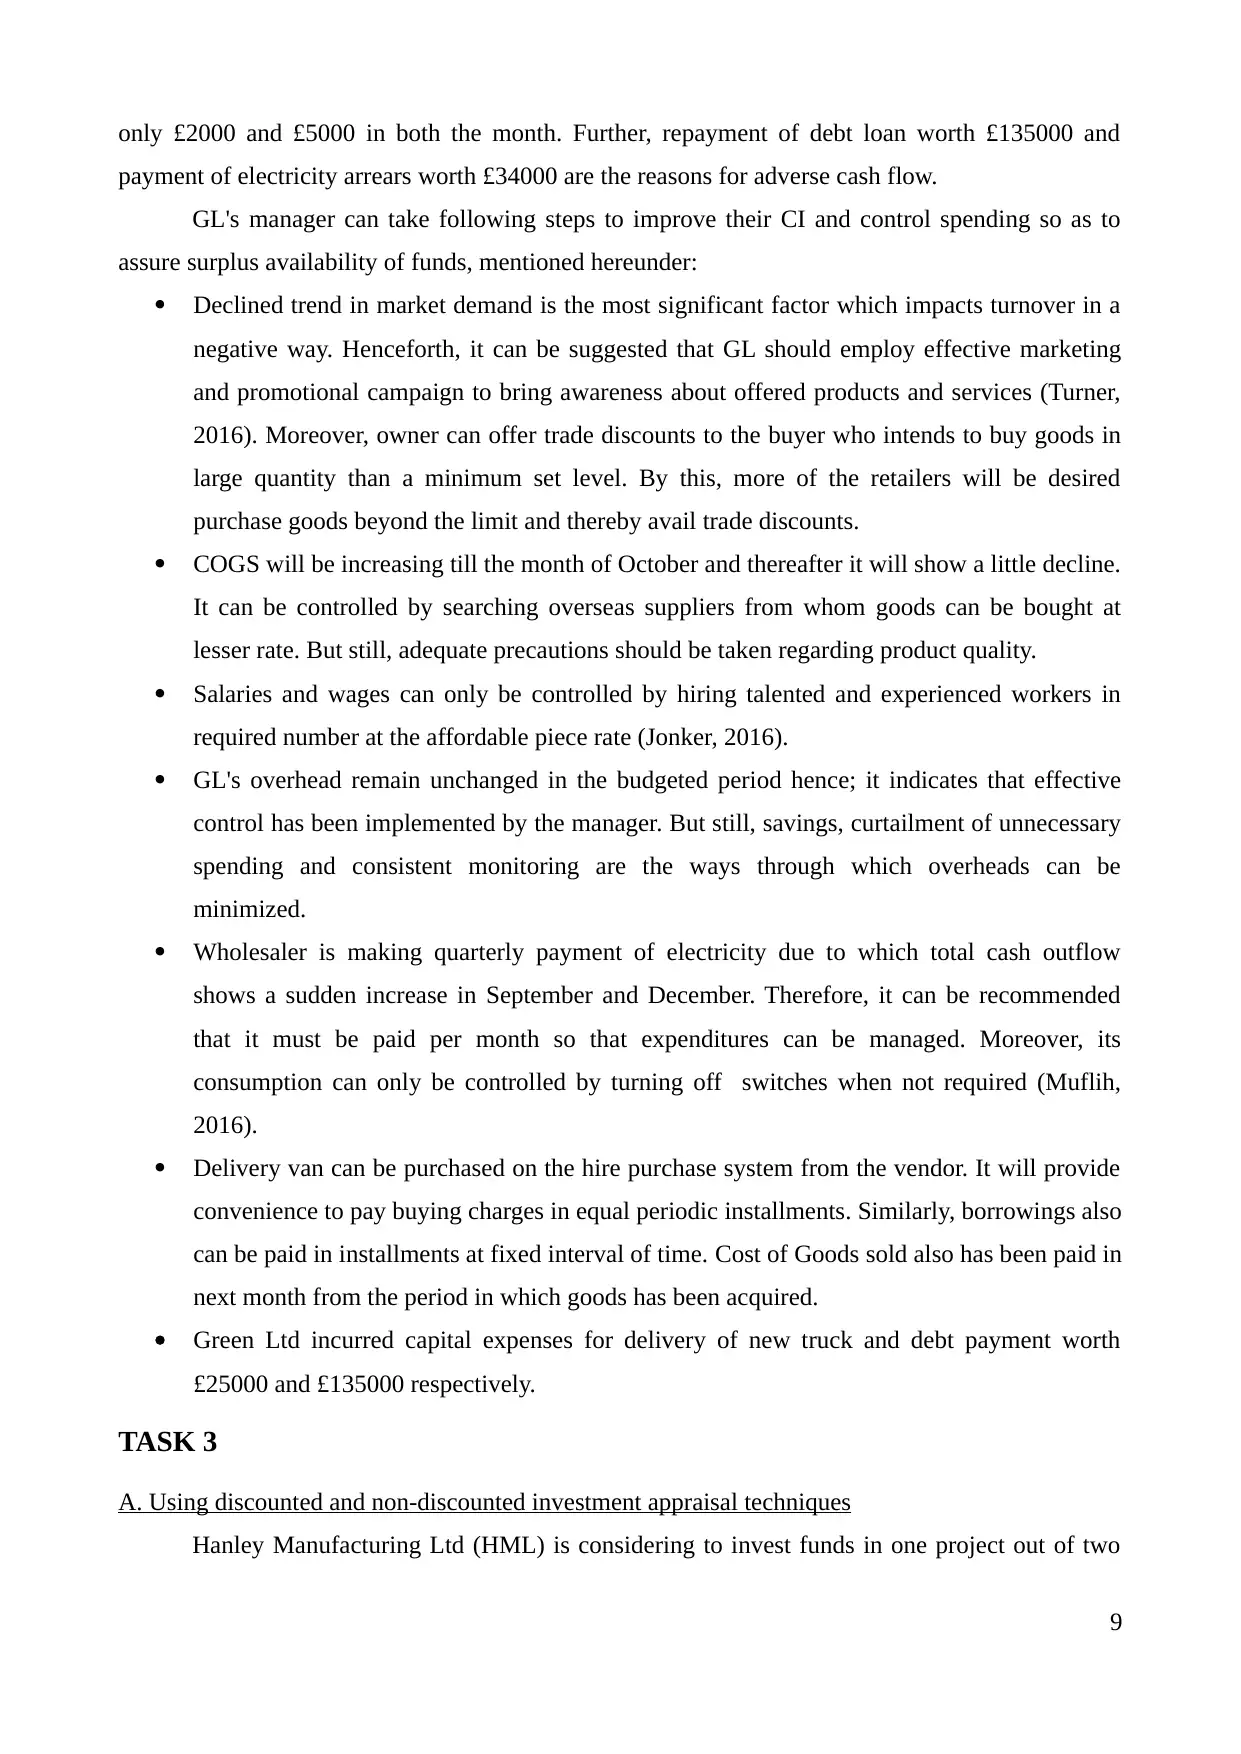
only £2000 and £5000 in both the month. Further, repayment of debt loan worth £135000 and
payment of electricity arrears worth £34000 are the reasons for adverse cash flow.
GL's manager can take following steps to improve their CI and control spending so as to
assure surplus availability of funds, mentioned hereunder:
Declined trend in market demand is the most significant factor which impacts turnover in a
negative way. Henceforth, it can be suggested that GL should employ effective marketing
and promotional campaign to bring awareness about offered products and services (Turner,
2016). Moreover, owner can offer trade discounts to the buyer who intends to buy goods in
large quantity than a minimum set level. By this, more of the retailers will be desired
purchase goods beyond the limit and thereby avail trade discounts.
COGS will be increasing till the month of October and thereafter it will show a little decline.
It can be controlled by searching overseas suppliers from whom goods can be bought at
lesser rate. But still, adequate precautions should be taken regarding product quality.
Salaries and wages can only be controlled by hiring talented and experienced workers in
required number at the affordable piece rate (Jonker, 2016).
GL's overhead remain unchanged in the budgeted period hence; it indicates that effective
control has been implemented by the manager. But still, savings, curtailment of unnecessary
spending and consistent monitoring are the ways through which overheads can be
minimized.
Wholesaler is making quarterly payment of electricity due to which total cash outflow
shows a sudden increase in September and December. Therefore, it can be recommended
that it must be paid per month so that expenditures can be managed. Moreover, its
consumption can only be controlled by turning off switches when not required (Muflih,
2016).
Delivery van can be purchased on the hire purchase system from the vendor. It will provide
convenience to pay buying charges in equal periodic installments. Similarly, borrowings also
can be paid in installments at fixed interval of time. Cost of Goods sold also has been paid in
next month from the period in which goods has been acquired.
Green Ltd incurred capital expenses for delivery of new truck and debt payment worth
£25000 and £135000 respectively.
TASK 3
A. Using discounted and non-discounted investment appraisal techniques
Hanley Manufacturing Ltd (HML) is considering to invest funds in one project out of two
9
⊘ This is a preview!⊘
Do you want full access?
Subscribe today to unlock all pages.
Trusted by 1+ million students worldwide
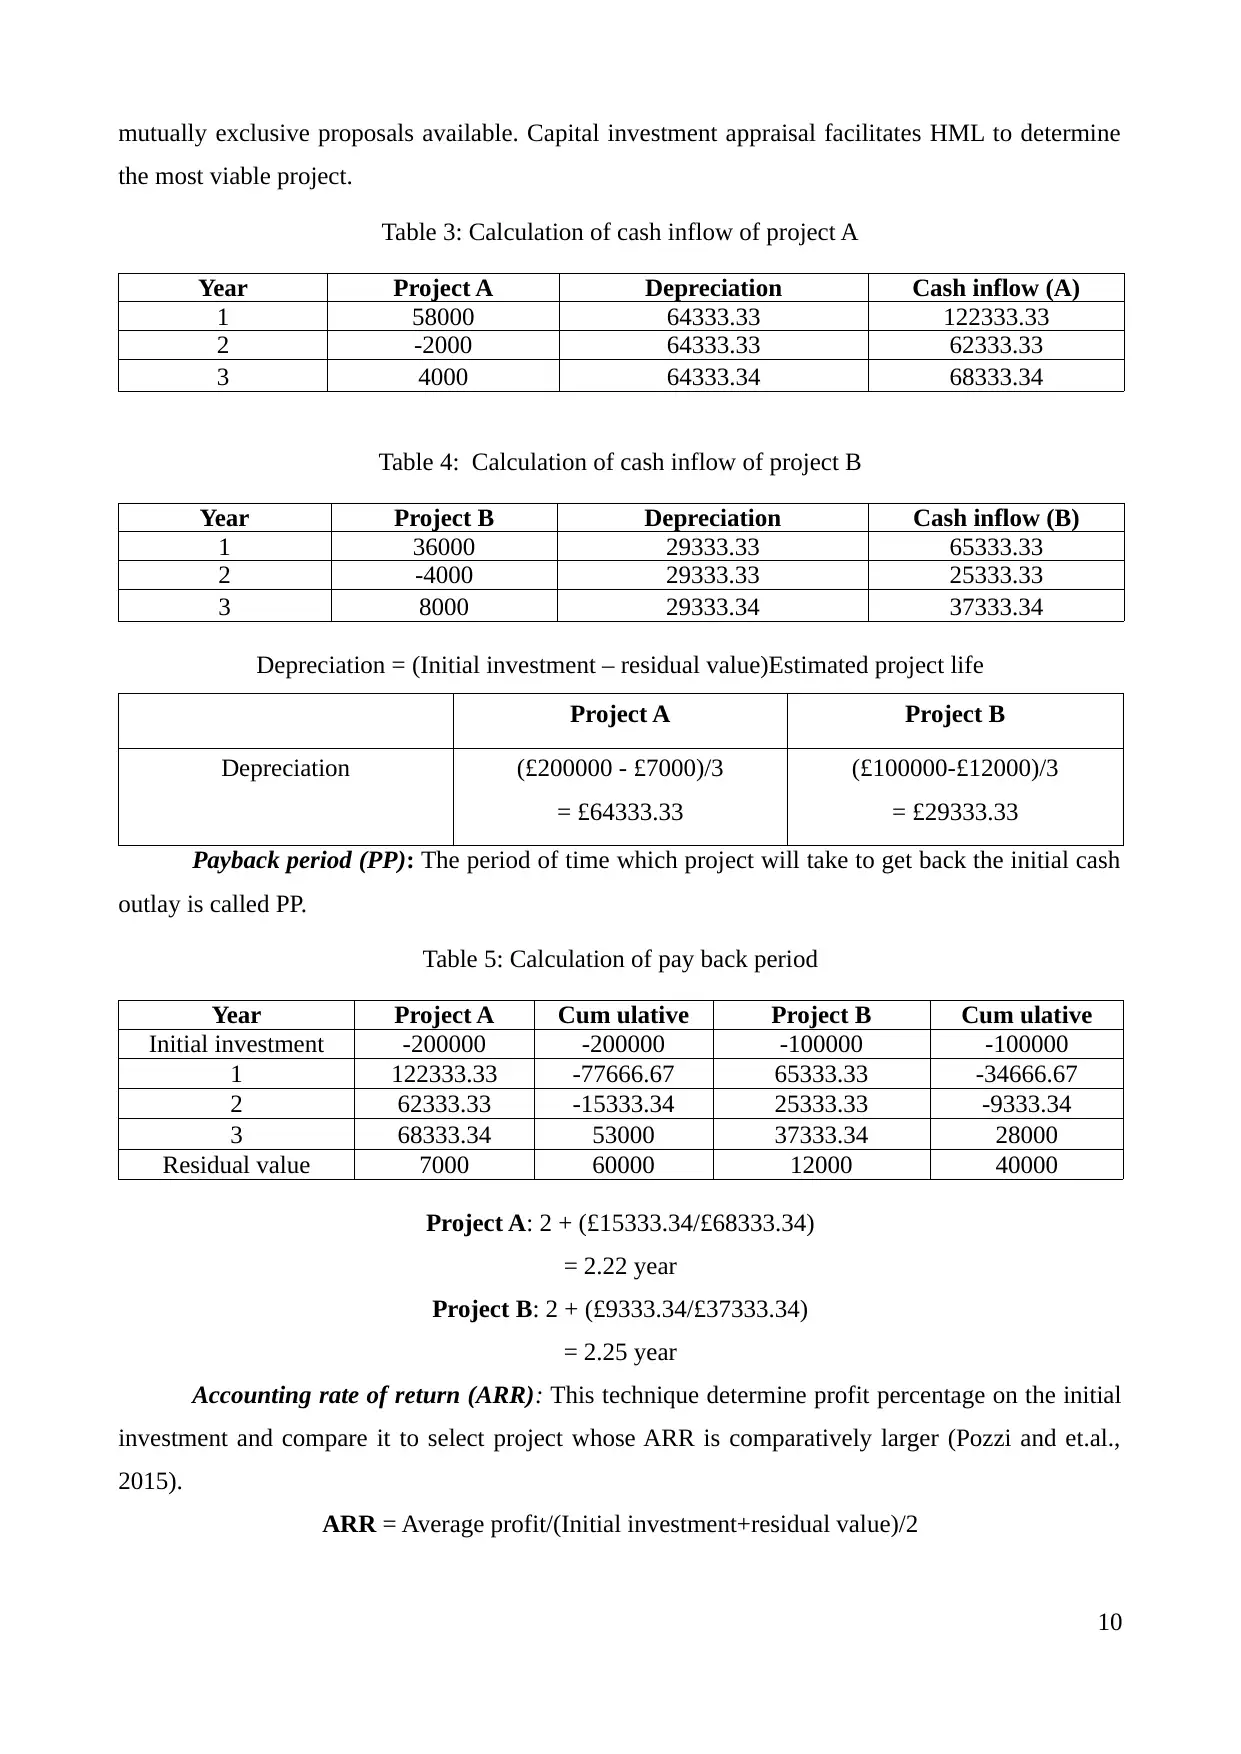
mutually exclusive proposals available. Capital investment appraisal facilitates HML to determine
the most viable project.
Table 3: Calculation of cash inflow of project A
Year Project A Depreciation Cash inflow (A)
1 58000 64333.33 122333.33
2 -2000 64333.33 62333.33
3 4000 64333.34 68333.34
Table 4: Calculation of cash inflow of project B
Year Project B Depreciation Cash inflow (B)
1 36000 29333.33 65333.33
2 -4000 29333.33 25333.33
3 8000 29333.34 37333.34
Depreciation = (Initial investment – residual value)Estimated project life
Project A Project B
Depreciation (£200000 - £7000)/3
= £64333.33
(£100000-£12000)/3
= £29333.33
Payback period (PP): The period of time which project will take to get back the initial cash
outlay is called PP.
Table 5: Calculation of pay back period
Year Project A Cum ulative Project B Cum ulative
Initial investment -200000 -200000 -100000 -100000
1 122333.33 -77666.67 65333.33 -34666.67
2 62333.33 -15333.34 25333.33 -9333.34
3 68333.34 53000 37333.34 28000
Residual value 7000 60000 12000 40000
Project A: 2 + (£15333.34/£68333.34)
= 2.22 year
Project B: 2 + (£9333.34/£37333.34)
= 2.25 year
Accounting rate of return (ARR): This technique determine profit percentage on the initial
investment and compare it to select project whose ARR is comparatively larger (Pozzi and et.al.,
2015).
ARR = Average profit/(Initial investment+residual value)/2
10
Paraphrase This Document
Need a fresh take? Get an instant paraphrase of this document with our AI Paraphraser
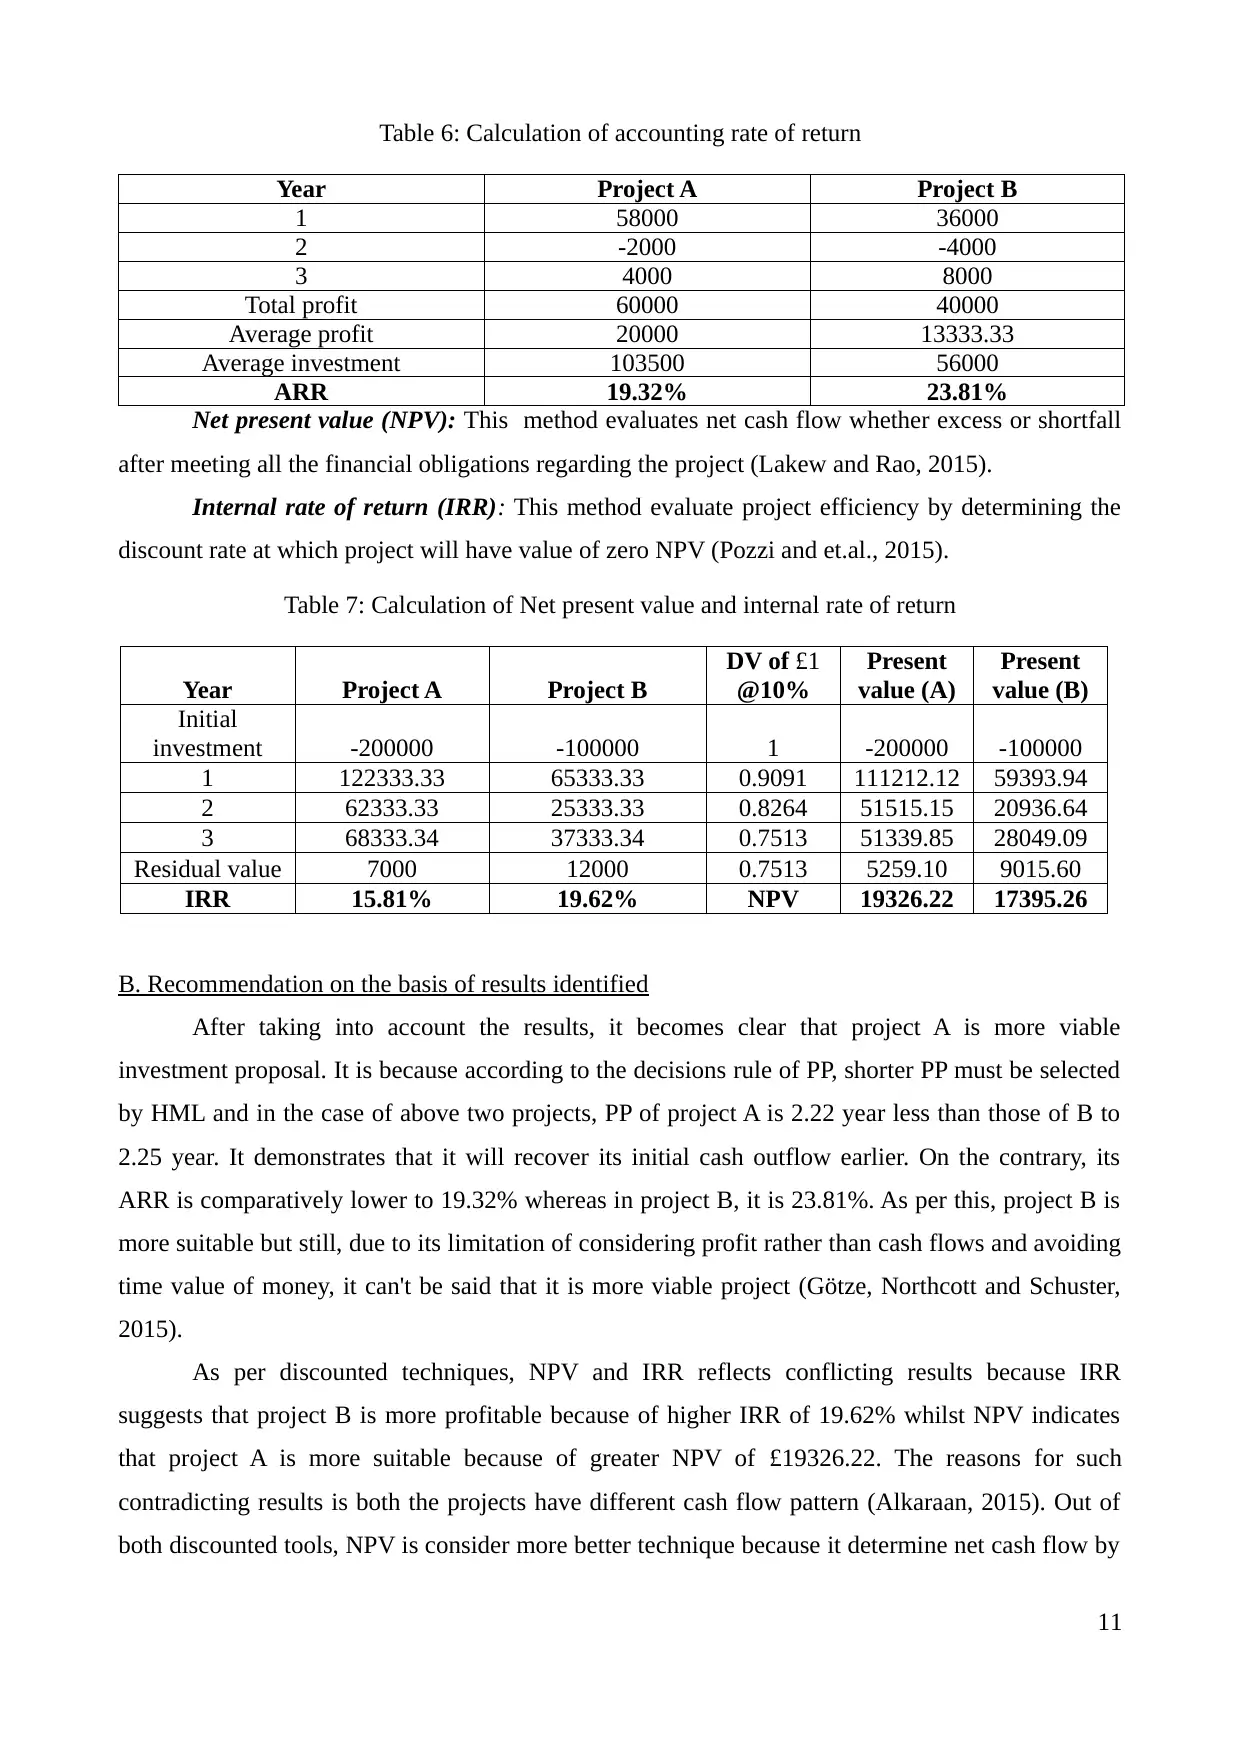
Table 6: Calculation of accounting rate of return
Year Project A Project B
1 58000 36000
2 -2000 -4000
3 4000 8000
Total profit 60000 40000
Average profit 20000 13333.33
Average investment 103500 56000
ARR 19.32% 23.81%
Net present value (NPV): This method evaluates net cash flow whether excess or shortfall
after meeting all the financial obligations regarding the project (Lakew and Rao, 2015).
Internal rate of return (IRR): This method evaluate project efficiency by determining the
discount rate at which project will have value of zero NPV (Pozzi and et.al., 2015).
Table 7: Calculation of Net present value and internal rate of return
Year Project A Project B
DV of £1
@10%
Present
value (A)
Present
value (B)
Initial
investment -200000 -100000 1 -200000 -100000
1 122333.33 65333.33 0.9091 111212.12 59393.94
2 62333.33 25333.33 0.8264 51515.15 20936.64
3 68333.34 37333.34 0.7513 51339.85 28049.09
Residual value 7000 12000 0.7513 5259.10 9015.60
IRR 15.81% 19.62% NPV 19326.22 17395.26
B. Recommendation on the basis of results identified
After taking into account the results, it becomes clear that project A is more viable
investment proposal. It is because according to the decisions rule of PP, shorter PP must be selected
by HML and in the case of above two projects, PP of project A is 2.22 year less than those of B to
2.25 year. It demonstrates that it will recover its initial cash outflow earlier. On the contrary, its
ARR is comparatively lower to 19.32% whereas in project B, it is 23.81%. As per this, project B is
more suitable but still, due to its limitation of considering profit rather than cash flows and avoiding
time value of money, it can't be said that it is more viable project (Götze, Northcott and Schuster,
2015).
As per discounted techniques, NPV and IRR reflects conflicting results because IRR
suggests that project B is more profitable because of higher IRR of 19.62% whilst NPV indicates
that project A is more suitable because of greater NPV of £19326.22. The reasons for such
contradicting results is both the projects have different cash flow pattern (Alkaraan, 2015). Out of
both discounted tools, NPV is consider more better technique because it determine net cash flow by
11
Year Project A Project B
1 58000 36000
2 -2000 -4000
3 4000 8000
Total profit 60000 40000
Average profit 20000 13333.33
Average investment 103500 56000
ARR 19.32% 23.81%
Net present value (NPV): This method evaluates net cash flow whether excess or shortfall
after meeting all the financial obligations regarding the project (Lakew and Rao, 2015).
Internal rate of return (IRR): This method evaluate project efficiency by determining the
discount rate at which project will have value of zero NPV (Pozzi and et.al., 2015).
Table 7: Calculation of Net present value and internal rate of return
Year Project A Project B
DV of £1
@10%
Present
value (A)
Present
value (B)
Initial
investment -200000 -100000 1 -200000 -100000
1 122333.33 65333.33 0.9091 111212.12 59393.94
2 62333.33 25333.33 0.8264 51515.15 20936.64
3 68333.34 37333.34 0.7513 51339.85 28049.09
Residual value 7000 12000 0.7513 5259.10 9015.60
IRR 15.81% 19.62% NPV 19326.22 17395.26
B. Recommendation on the basis of results identified
After taking into account the results, it becomes clear that project A is more viable
investment proposal. It is because according to the decisions rule of PP, shorter PP must be selected
by HML and in the case of above two projects, PP of project A is 2.22 year less than those of B to
2.25 year. It demonstrates that it will recover its initial cash outflow earlier. On the contrary, its
ARR is comparatively lower to 19.32% whereas in project B, it is 23.81%. As per this, project B is
more suitable but still, due to its limitation of considering profit rather than cash flows and avoiding
time value of money, it can't be said that it is more viable project (Götze, Northcott and Schuster,
2015).
As per discounted techniques, NPV and IRR reflects conflicting results because IRR
suggests that project B is more profitable because of higher IRR of 19.62% whilst NPV indicates
that project A is more suitable because of greater NPV of £19326.22. The reasons for such
contradicting results is both the projects have different cash flow pattern (Alkaraan, 2015). Out of
both discounted tools, NPV is consider more better technique because it determine net cash flow by
11
taking into account true value of money. Therefore, it is clear that project A is more viable because
there is a chance of having greater NPV worth £19326.22.
CONCLUSION
From the report, it can be concluded that WM Morrison financial performance has been
decreased in 2015. Therefore, it is essential for the manager to employ some strategic and tactical
decisions and policies to perform better in future. Middle part of the report concluded GL can assure
adequate surplus of cash funds by preparation and analysis of cash budget. Through this, it can
minimize spendings and maximise earnings to achieve business targets. While, capital budgeting
methods concluded that NPV is the most superior method henceforth, HML should select project A.
12
⊘ This is a preview!⊘
Do you want full access?
Subscribe today to unlock all pages.
Trusted by 1+ million students worldwide
1 out of 16
Related Documents


Your All-in-One AI-Powered Toolkit for Academic Success.
+13062052269
info@desklib.com
Available 24*7 on WhatsApp / Email
![[object Object]](/_next/static/media/star-bottom.7253800d.svg)
Unlock your academic potential
Copyright © 2020–2026 A2Z Services. All Rights Reserved. Developed and managed by ZUCOL.