Comprehensive Financial Management: Capital Budgeting & Analysis
VerifiedAdded on 2023/04/21
|14
|2117
|81
Homework Assignment
AI Summary
This document provides a comprehensive solution to a Financial Management assignment, covering key areas such as ratio analysis and capital budgeting. Part A addresses theoretical questions related to institutional vs. individual investors, illiquid investments, fundamental analysis, ratio analysis, and capital budgeting methods like Net Present Value (NPV), Payback Period, and Internal Rate of Return (IRR). Part B includes practical exercises involving activity ratios, sustainable growth rate calculation, and cash flow statement analysis. The solution demonstrates the application of financial concepts and provides insights into investment decision-making. Desklib offers similar solved assignments and resources to support students in their studies.

Running Head: FINANCIAL MANAGEMENT 0
FINANCIAL MANAGEMENT
FINANCIAL MANAGEMENT
Paraphrase This Document
Need a fresh take? Get an instant paraphrase of this document with our AI Paraphraser
FINANCIAL MANAGEMENT 1
Contents
Part A...............................................................................................................................................2
Question 1........................................................................................................................................2
Question 2........................................................................................................................................2
Question 3........................................................................................................................................2
Question 4........................................................................................................................................2
Question 5........................................................................................................................................2
Question 7........................................................................................................................................2
PART B...........................................................................................................................................3
Exercise 1.........................................................................................................................................3
Part a............................................................................................................................................3
Part b............................................................................................................................................4
Exercise 2.........................................................................................................................................5
Exercise 3.........................................................................................................................................5
Part a)...........................................................................................................................................5
Part b)...........................................................................................................................................5
Exercise 4.........................................................................................................................................6
Part I)............................................................................................................................................6
Part II)..........................................................................................................................................6

FINANCIAL MANAGEMENT 2
References........................................................................................................................................7
References........................................................................................................................................7
⊘ This is a preview!⊘
Do you want full access?
Subscribe today to unlock all pages.
Trusted by 1+ million students worldwide
FINANCIAL MANAGEMENT 3
Part A
Question 1
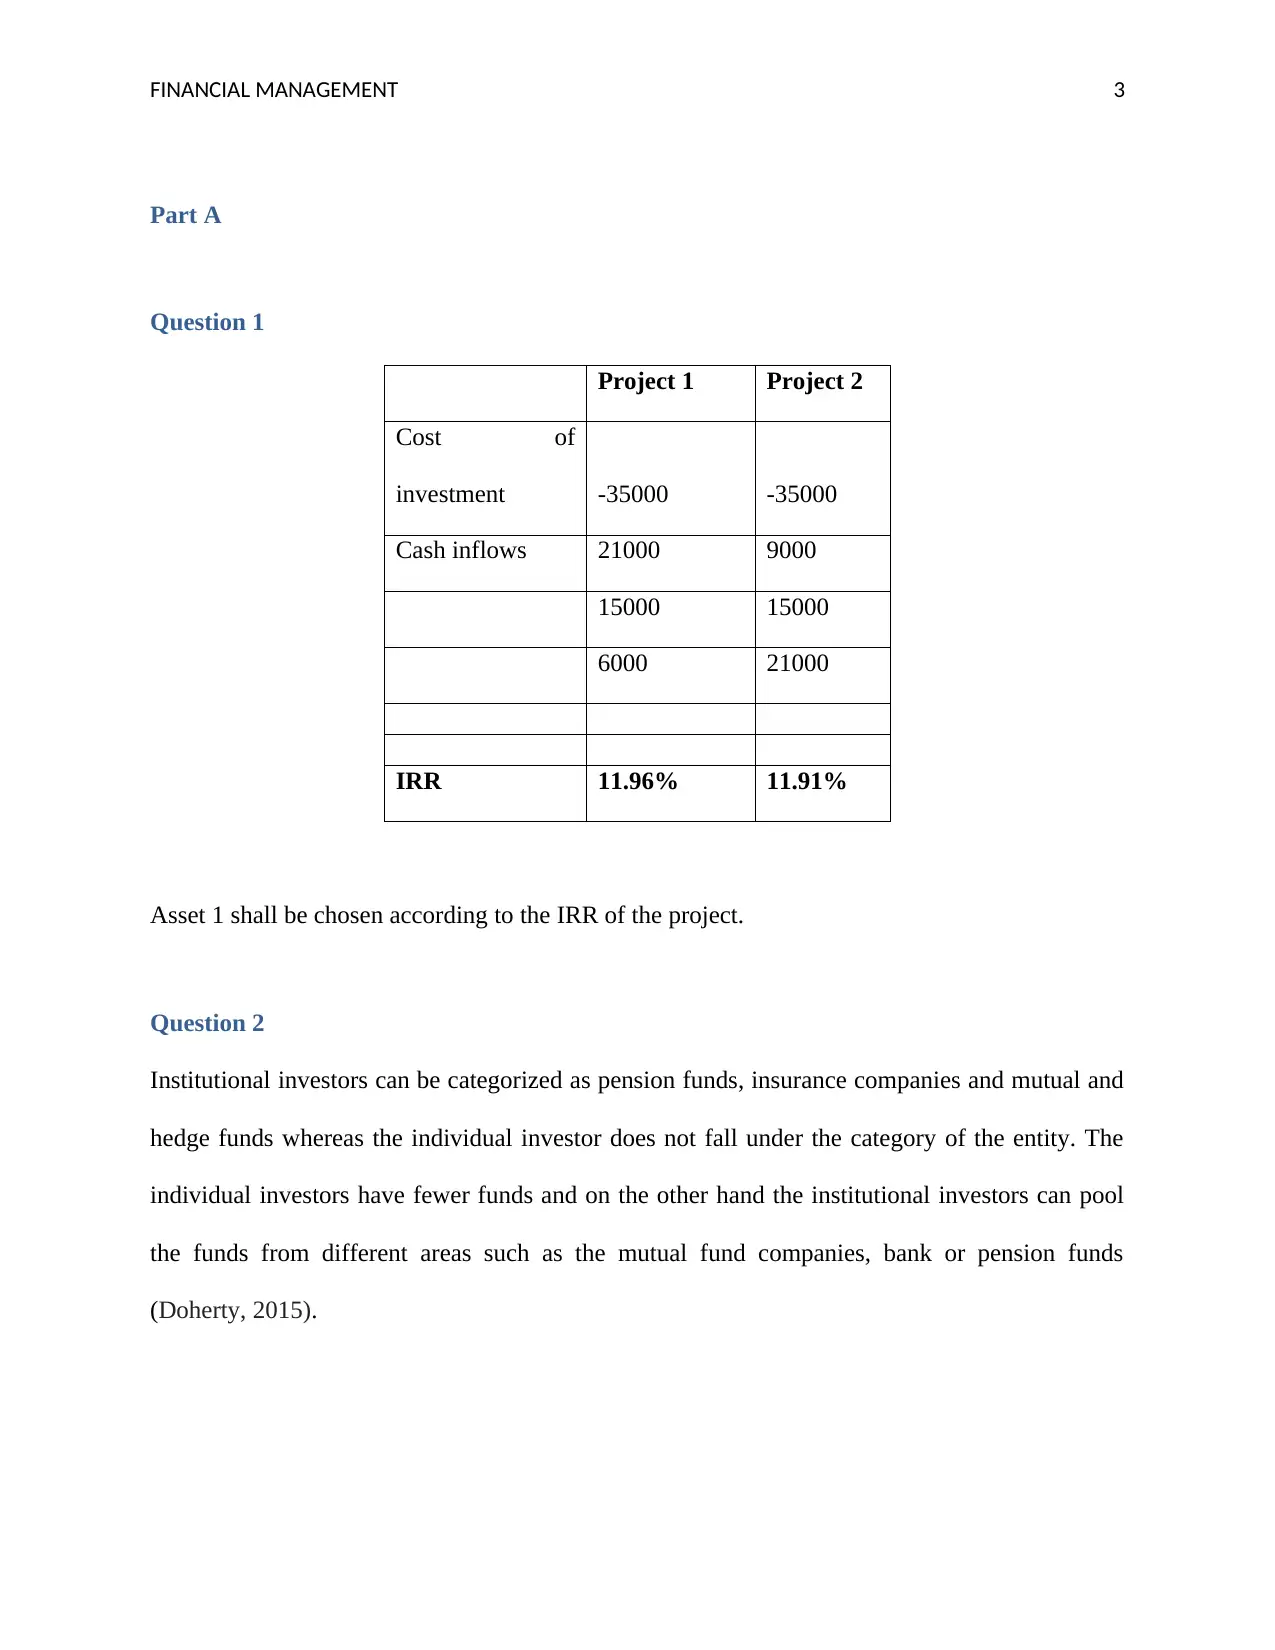
Project 1 Project 2
Cost of
investment -35000 -35000
Cash inflows 21000 9000
15000 15000
6000 21000
IRR 11.96% 11.91%
Asset 1 shall be chosen according to the IRR of the project.
Question 2
Institutional investors can be categorized as pension funds, insurance companies and mutual and
hedge funds whereas the individual investor does not fall under the category of the entity. The
individual investors have fewer funds and on the other hand the institutional investors can pool
the funds from different areas such as the mutual fund companies, bank or pension funds
(Doherty, 2015).
Part A
Question 1
Project 1 Project 2
Cost of
investment -35000 -35000
Cash inflows 21000 9000
15000 15000
6000 21000
IRR 11.96% 11.91%
Asset 1 shall be chosen according to the IRR of the project.
Question 2
Institutional investors can be categorized as pension funds, insurance companies and mutual and
hedge funds whereas the individual investor does not fall under the category of the entity. The
individual investors have fewer funds and on the other hand the institutional investors can pool
the funds from different areas such as the mutual fund companies, bank or pension funds
(Doherty, 2015).
Paraphrase This Document
Need a fresh take? Get an instant paraphrase of this document with our AI Paraphraser
FINANCIAL MANAGEMENT 4
Question 3
The illiquid investment can be described as the asset that cannot be readily converted into cash
on selling. This happens mainly because of the lack of the interest of the buyers or non-
establishment of the trading market. One examples of such stock is collectibles art and antique,
Liquid investments are those investments which can be converted into cash. One example of
such investment is marketable securities (Campbell, 2015).
Question 4
Fundamental analysis is the process of supervising the fundamental level of the business such as
sales, earnings, potential assets, debt management, products and the competition. Fundamental
analysis is performed on the historical and the present data but with the intention of the making
the financial forecasts. There are further objectives and the goals for which the fundamental
analysis is carried on to conduct a company’s stock valuation and predict its probable price, to
evaluate, the management and the business decisions are calculated (Steinbrook, 2015).
Question 5
Ratio analysis is a technique which is used for the measurement of the financial position of the
company. Generally the ratios depict the position of the company in the form of the liquidity,
efficiency, profitability and the market stability. Most of times the ratio analysis technique is
successful when compared to the previous year or against the industry benchmarks, however one
of the biggest disadvantages it carries is, that it depicts the monetary comparison and avoids the
factors like key intangibles, like brand and relationships also (Uechi, et al 2015).
FINANCIAL MANAGEMENT 5
Question 7
The various methods of the capital budgeting are net present value, payback period, internal rate
of return and profitability index. These methods are required to make the investment decisions.
Currently the profitability index or the IRR method is most widely used in the process of the
decision making. In simpler terms if explained the net present value is the difference of the
inflows and the outflows of the cash. The positive NPV indicates that the investment can be
selected. Payback period on the other hand can be determined as the time period in which the
cost of the investment can be recovered by the company.
The major importance of the NPV method is that it considers the concept off time value of
money and also helps in maximization of the value of the firm. The only biggest disadvantage
this method carries is that, if the two projects are not exclusive mutually then the comparison is
impossible. The premium advantage for calculating the payback period is that it is the simplest
method to calculate and it can be treated as a measure of the risk inheritance of the project
(Bhutto, Abbas, Rehman and Shah, 2015). On the contrary the disadvantage of the payback
period is that it ignores the time value of money. It does not account for the cash flow that occurs
after the payback period. The IRR commonly known as the internal rate of return is the rate that
is used in the capital budgeting to estimate the real potential of the investments. The internal rate
of return is a discount that makes the present value of the investment equals to zero. The
advantages of the time value of money is considered and it’s simple to interpret after the IRR is
calculated. The economies of scale are ignored and moreover there are certain assumptions of
reinvestment rate of return for the remaining period of the investment or proposal. Therefore
these are the capital budgeting methods that are used to make the investment decisions (Bülow,
2017).
⊘ This is a preview!⊘
Do you want full access?
Subscribe today to unlock all pages.
Trusted by 1+ million students worldwide
FINANCIAL MANAGEMENT 6
PART B
Exercise 1
Part a
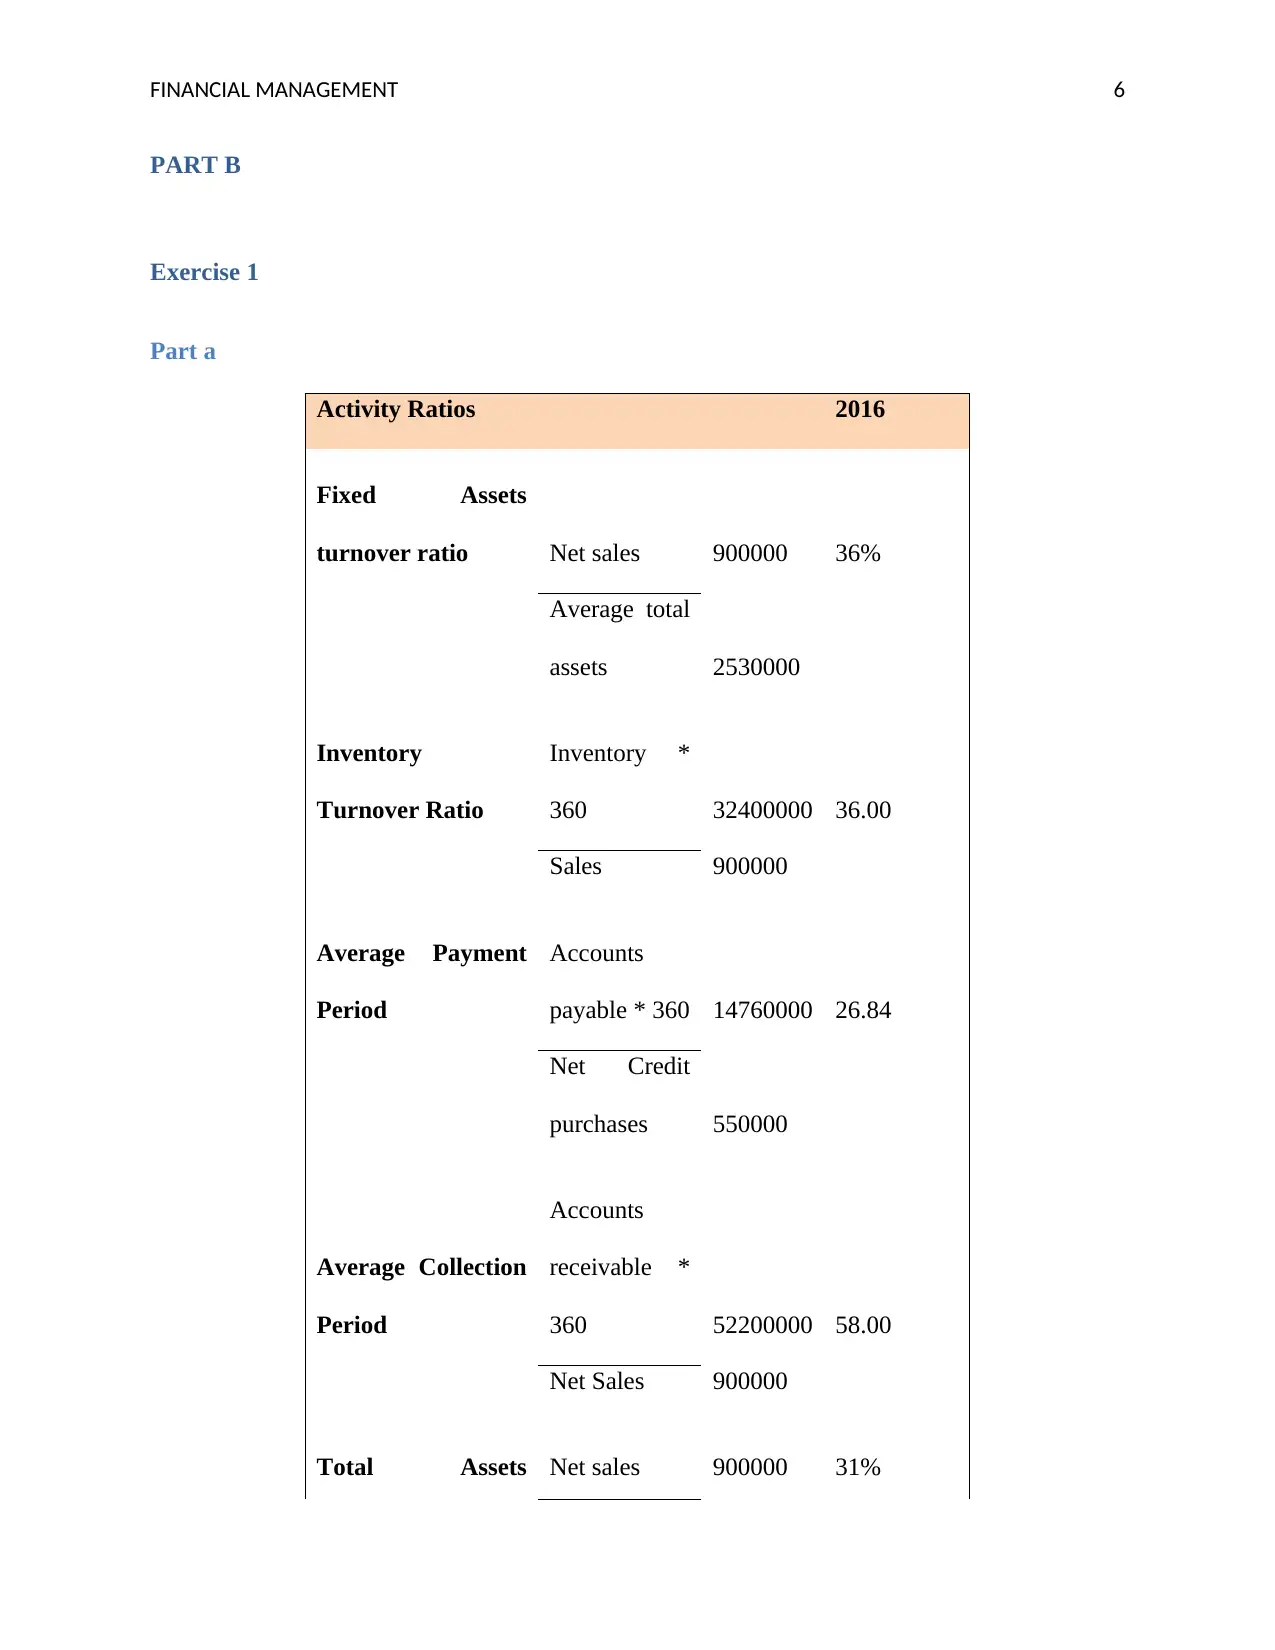
Activity Ratios 2016
Fixed Assets
turnover ratio Net sales 900000 36%
Average total
assets 2530000
Inventory
Turnover Ratio
Inventory *
360 32400000 36.00
Sales 900000
Average Payment
Period
Accounts
payable * 360 14760000 26.84
Net Credit
purchases 550000
Average Collection
Period
Accounts
receivable *
360 52200000 58.00
Net Sales 900000
Total Assets Net sales 900000 31%
PART B
Exercise 1
Part a
Activity Ratios 2016
Fixed Assets
turnover ratio Net sales 900000 36%
Average total
assets 2530000
Inventory
Turnover Ratio
Inventory *
360 32400000 36.00
Sales 900000
Average Payment
Period
Accounts
payable * 360 14760000 26.84
Net Credit
purchases 550000
Average Collection
Period
Accounts
receivable *
360 52200000 58.00
Net Sales 900000
Total Assets Net sales 900000 31%
Paraphrase This Document
Need a fresh take? Get an instant paraphrase of this document with our AI Paraphraser
FINANCIAL MANAGEMENT 7
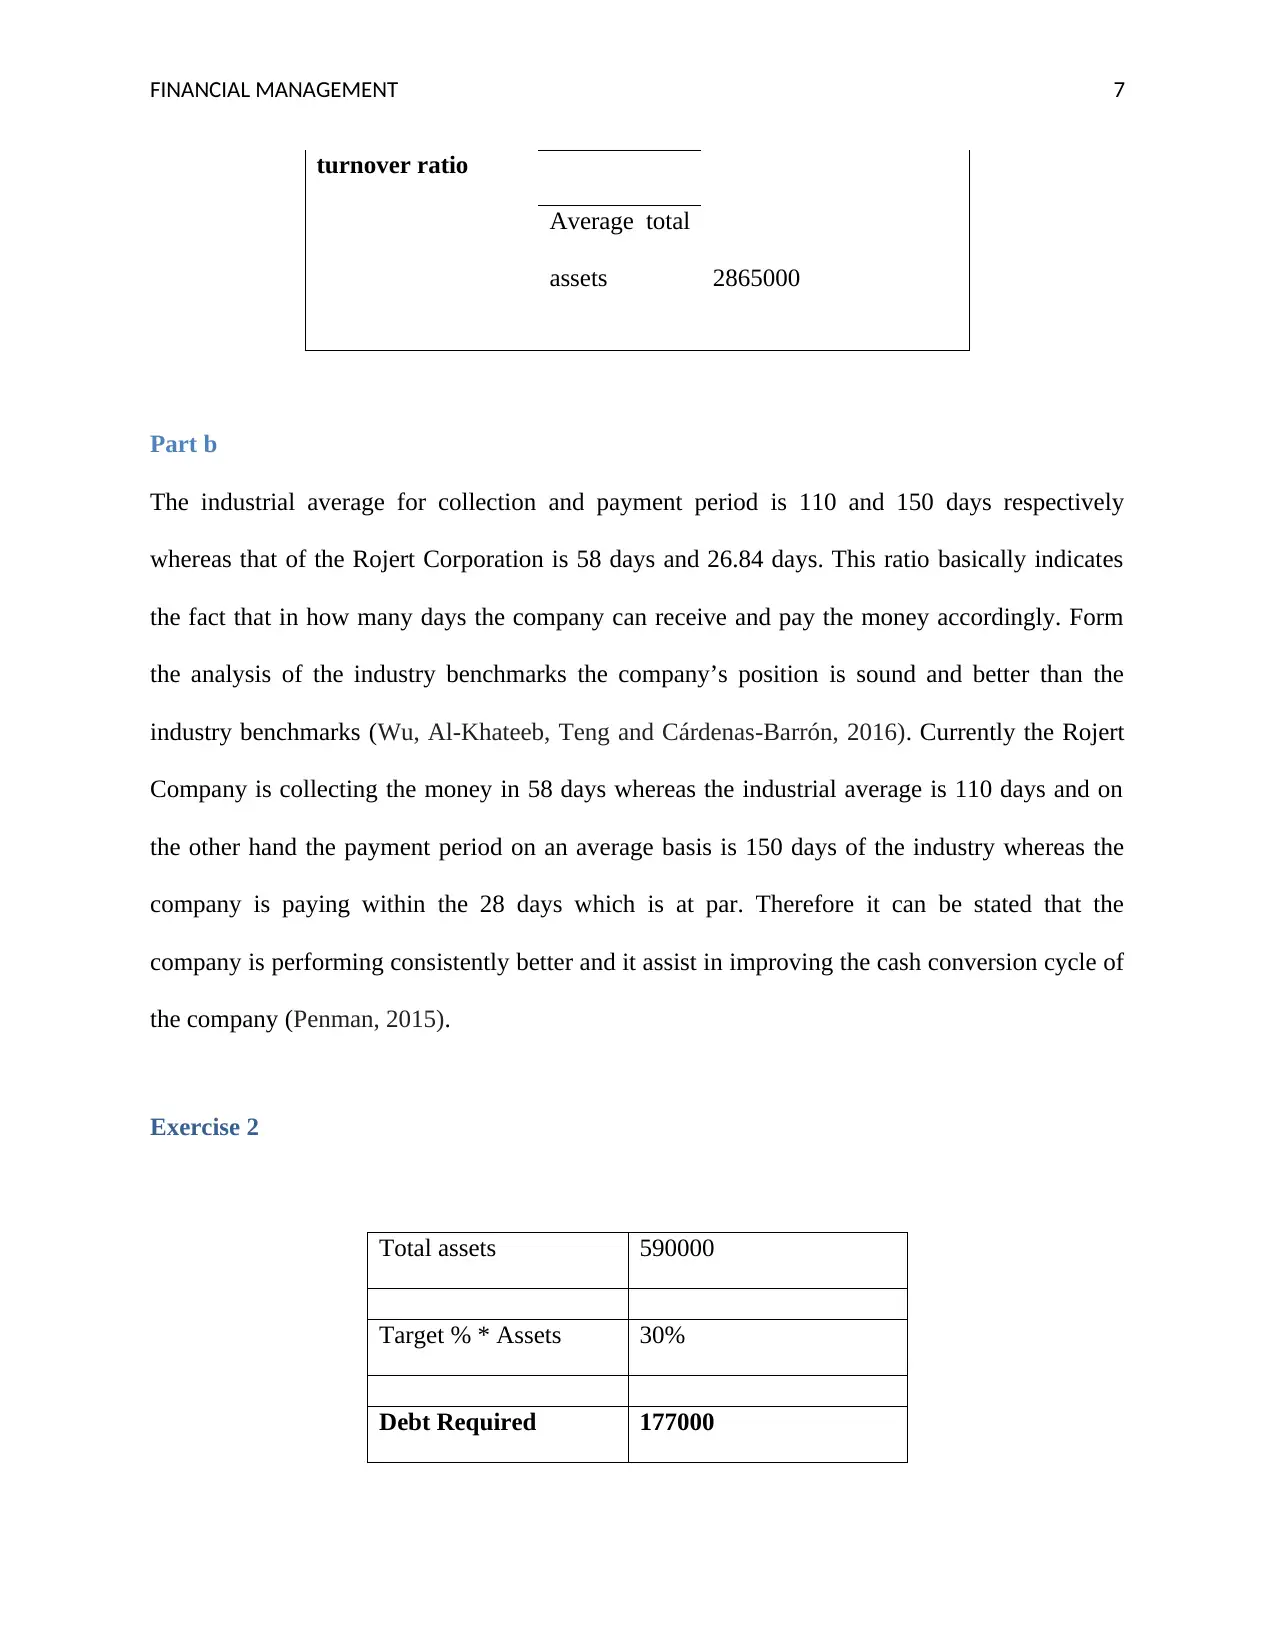
turnover ratio
Average total
assets 2865000
Part b
The industrial average for collection and payment period is 110 and 150 days respectively
whereas that of the Rojert Corporation is 58 days and 26.84 days. This ratio basically indicates
the fact that in how many days the company can receive and pay the money accordingly. Form
the analysis of the industry benchmarks the company’s position is sound and better than the
industry benchmarks (Wu, Al-Khateeb, Teng and Cárdenas-Barrón, 2016). Currently the Rojert
Company is collecting the money in 58 days whereas the industrial average is 110 days and on
the other hand the payment period on an average basis is 150 days of the industry whereas the
company is paying within the 28 days which is at par. Therefore it can be stated that the
company is performing consistently better and it assist in improving the cash conversion cycle of
the company (Penman, 2015).
Exercise 2
Total assets 590000
Target % * Assets 30%
Debt Required 177000
FINANCIAL MANAGEMENT 8
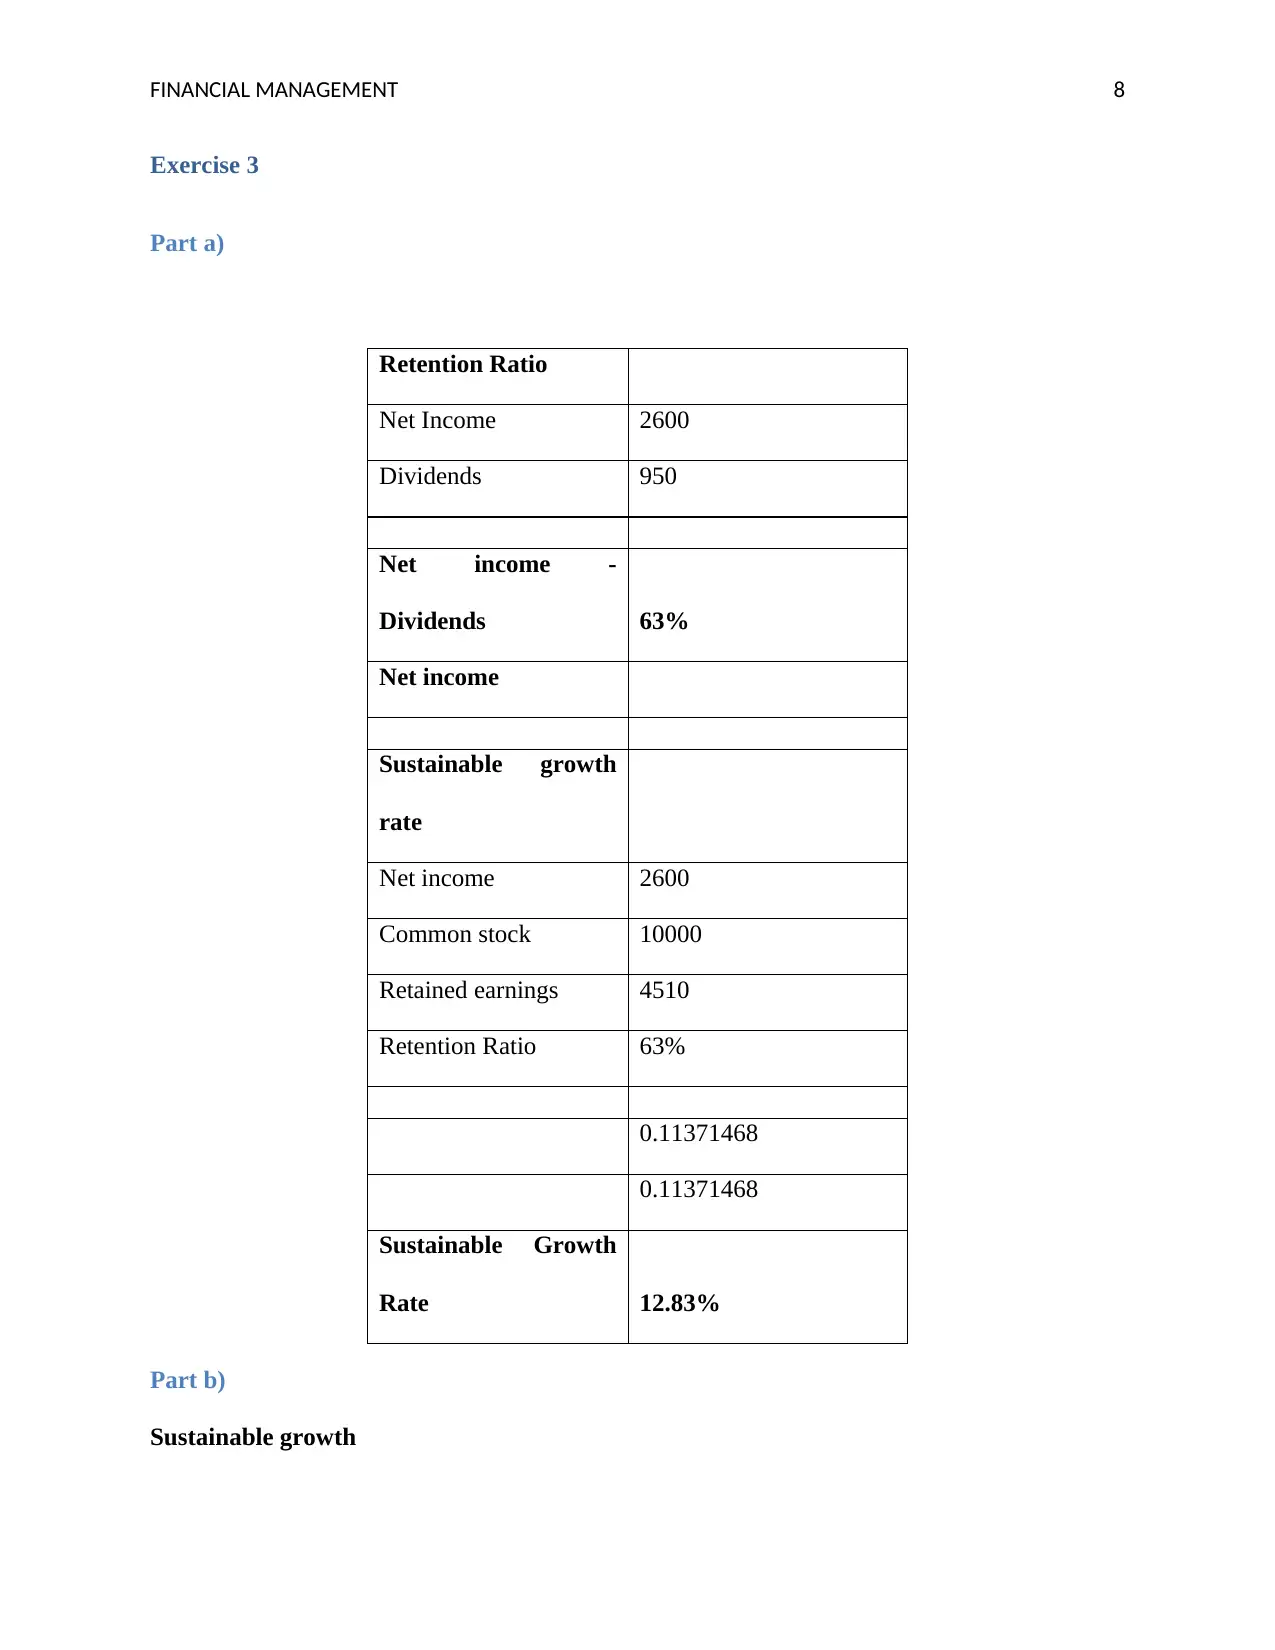
Exercise 3
Part a)
Retention Ratio
Net Income 2600
Dividends 950
Net income -
Dividends 63%
Net income
Sustainable growth
rate
Net income 2600
Common stock 10000
Retained earnings 4510
Retention Ratio 63%
0.11371468
0.11371468
Sustainable Growth
Rate 12.83%
Part b)
Sustainable growth
Exercise 3
Part a)
Retention Ratio
Net Income 2600
Dividends 950
Net income -
Dividends 63%
Net income
Sustainable growth
rate
Net income 2600
Common stock 10000
Retained earnings 4510
Retention Ratio 63%
0.11371468
0.11371468
Sustainable Growth
Rate 12.83%
Part b)
Sustainable growth
⊘ This is a preview!⊘
Do you want full access?
Subscribe today to unlock all pages.
Trusted by 1+ million students worldwide
FINANCIAL MANAGEMENT 9
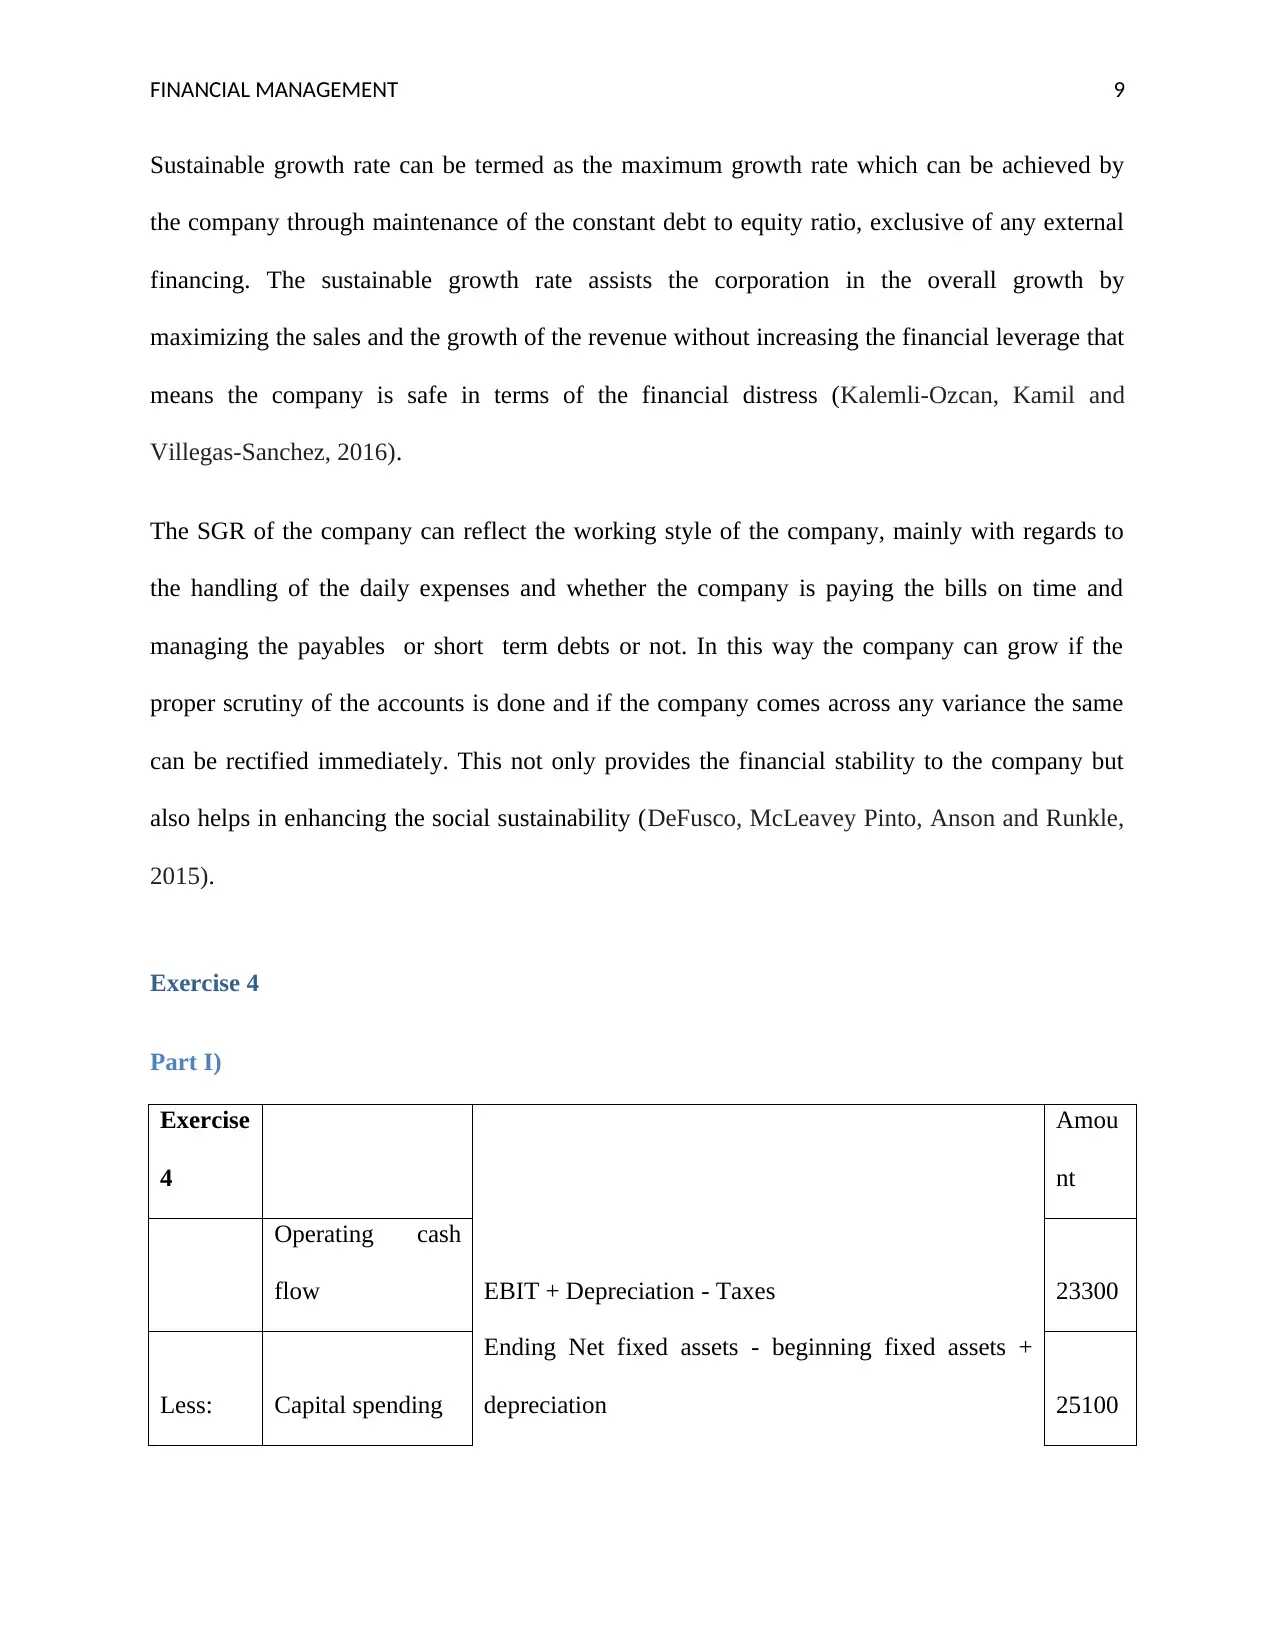
Sustainable growth rate can be termed as the maximum growth rate which can be achieved by
the company through maintenance of the constant debt to equity ratio, exclusive of any external
financing. The sustainable growth rate assists the corporation in the overall growth by
maximizing the sales and the growth of the revenue without increasing the financial leverage that
means the company is safe in terms of the financial distress (Kalemli-Ozcan, Kamil and
Villegas-Sanchez, 2016).
The SGR of the company can reflect the working style of the company, mainly with regards to
the handling of the daily expenses and whether the company is paying the bills on time and
managing the payables or short term debts or not. In this way the company can grow if the
proper scrutiny of the accounts is done and if the company comes across any variance the same
can be rectified immediately. This not only provides the financial stability to the company but
also helps in enhancing the social sustainability (DeFusco, McLeavey Pinto, Anson and Runkle,
2015).
Exercise 4
Part I)
Exercise
4
Amou
nt
Operating cash
flow EBIT + Depreciation - Taxes 23300
Less: Capital spending
Ending Net fixed assets - beginning fixed assets +
depreciation 25100
Paraphrase This Document
Need a fresh take? Get an instant paraphrase of this document with our AI Paraphraser
FINANCIAL MANAGEMENT 10
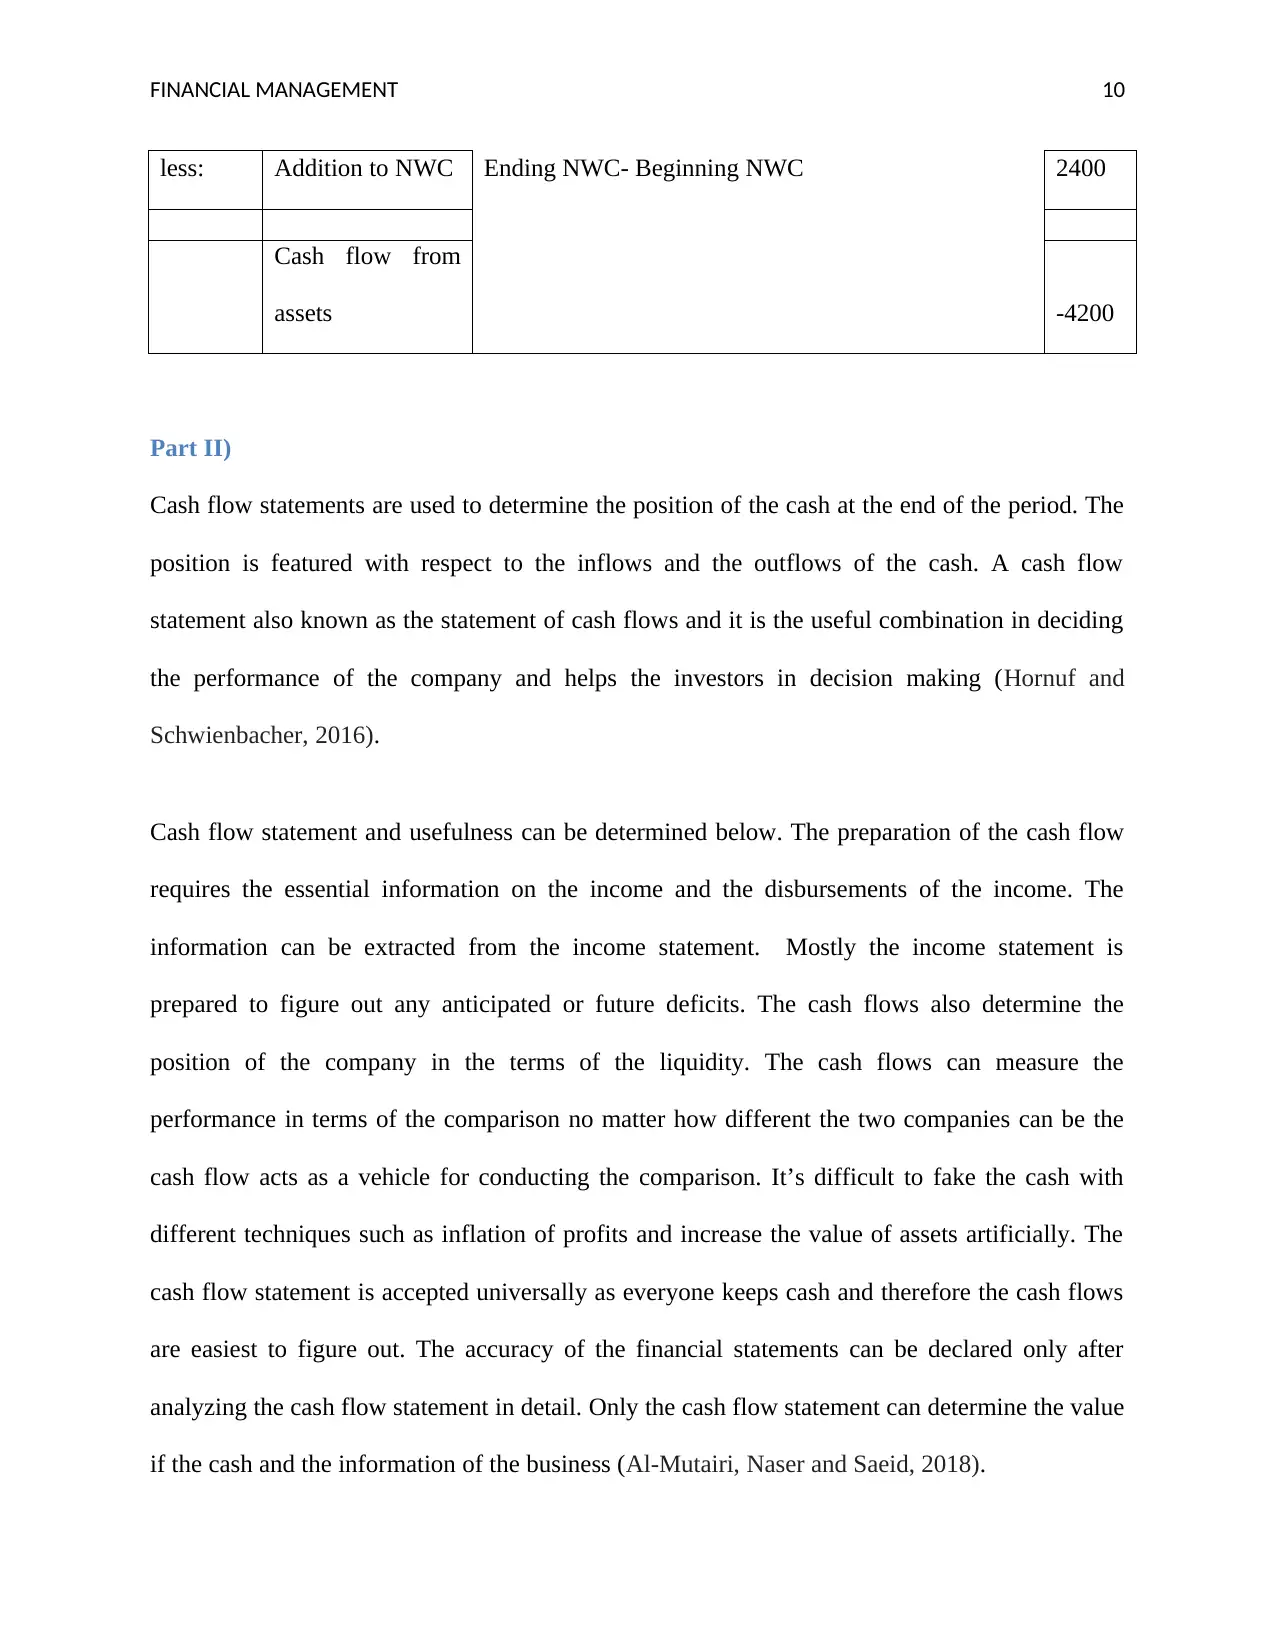
less: Addition to NWC Ending NWC- Beginning NWC 2400
Cash flow from
assets -4200
Part II)
Cash flow statements are used to determine the position of the cash at the end of the period. The
position is featured with respect to the inflows and the outflows of the cash. A cash flow
statement also known as the statement of cash flows and it is the useful combination in deciding
the performance of the company and helps the investors in decision making (Hornuf and
Schwienbacher, 2016).
Cash flow statement and usefulness can be determined below. The preparation of the cash flow
requires the essential information on the income and the disbursements of the income. The
information can be extracted from the income statement. Mostly the income statement is
prepared to figure out any anticipated or future deficits. The cash flows also determine the
position of the company in the terms of the liquidity. The cash flows can measure the
performance in terms of the comparison no matter how different the two companies can be the
cash flow acts as a vehicle for conducting the comparison. It’s difficult to fake the cash with
different techniques such as inflation of profits and increase the value of assets artificially. The
cash flow statement is accepted universally as everyone keeps cash and therefore the cash flows
are easiest to figure out. The accuracy of the financial statements can be declared only after
analyzing the cash flow statement in detail. Only the cash flow statement can determine the value
if the cash and the information of the business (Al-Mutairi, Naser and Saeid, 2018).

FINANCIAL MANAGEMENT 11
⊘ This is a preview!⊘
Do you want full access?
Subscribe today to unlock all pages.
Trusted by 1+ million students worldwide
1 out of 14
Related Documents


Your All-in-One AI-Powered Toolkit for Academic Success.
+13062052269
info@desklib.com
Available 24*7 on WhatsApp / Email
![[object Object]](/_next/static/media/star-bottom.7253800d.svg)
Unlock your academic potential
Copyright © 2020–2026 A2Z Services. All Rights Reserved. Developed and managed by ZUCOL.