Business Decision Making: Food for Friends London Expansion Report
VerifiedAdded on 2023/03/23
|20
|4476
|69
Report
AI Summary
This report delves into the business decision-making process for 'Food for Friends' as they plan a new franchise expansion in London. It outlines a comprehensive research plan involving both primary and secondary data collection methods, including a survey methodology utilizing questionnaires to gather customer opinions. The collected data is then analyzed using measures of central tendency (mean, median, mode) and dispersion (standard deviation, variance) to derive meaningful insights. The report also explores the use of quartiles, percentiles, and correlation coefficients for further data analysis. The findings are presented visually through graphs and charts, and the report concludes with a financial analysis of the project's feasibility, providing a well-rounded assessment for informed decision-making. Desklib offers similar solved assignments and past papers for students.
Business Decision
Making
Making
Paraphrase This Document
Need a fresh take? Get an instant paraphrase of this document with our AI Paraphraser
Table of Contents
INTRODUCTION...........................................................................................................................1
TASK 1............................................................................................................................................1
1.1 Formation of the plan for collecting primary and secondary data........................................1
1.2 Survey methodology and sample framing utilised for research............................................2
1.3 Designing of a questionnaire for gathering of the information.............................................3
2.1 Creation of information based on the gathered data.............................................................4
2.2 Utilisation of the measure of central tendency in relation to come with proper outcome. . .4
2.3 Analysis of measure of dispersion with standard deviation. ................................................5
2.4 Use of quartile, percentile and correlation coefficient for calculation of the data................6
TASK 2............................................................................................................................................7
3.1 Generation of the graph with the utilisation of spreadsheet..................................................7
3.2 Developing trend lines to determine the results....................................................................9
3.3 Business presentation for spreading the message...............................................................10
3.4 A formal business report.....................................................................................................10
TASK 3..........................................................................................................................................11
4.1 Use of suitable information tool..........................................................................................11
4.2 Project plan for the operation to determine the time frame................................................11
4.3 Usage of the financial tool in decision making procedure..................................................13
CONCLUSION..............................................................................................................................14
REFERENCES..............................................................................................................................15
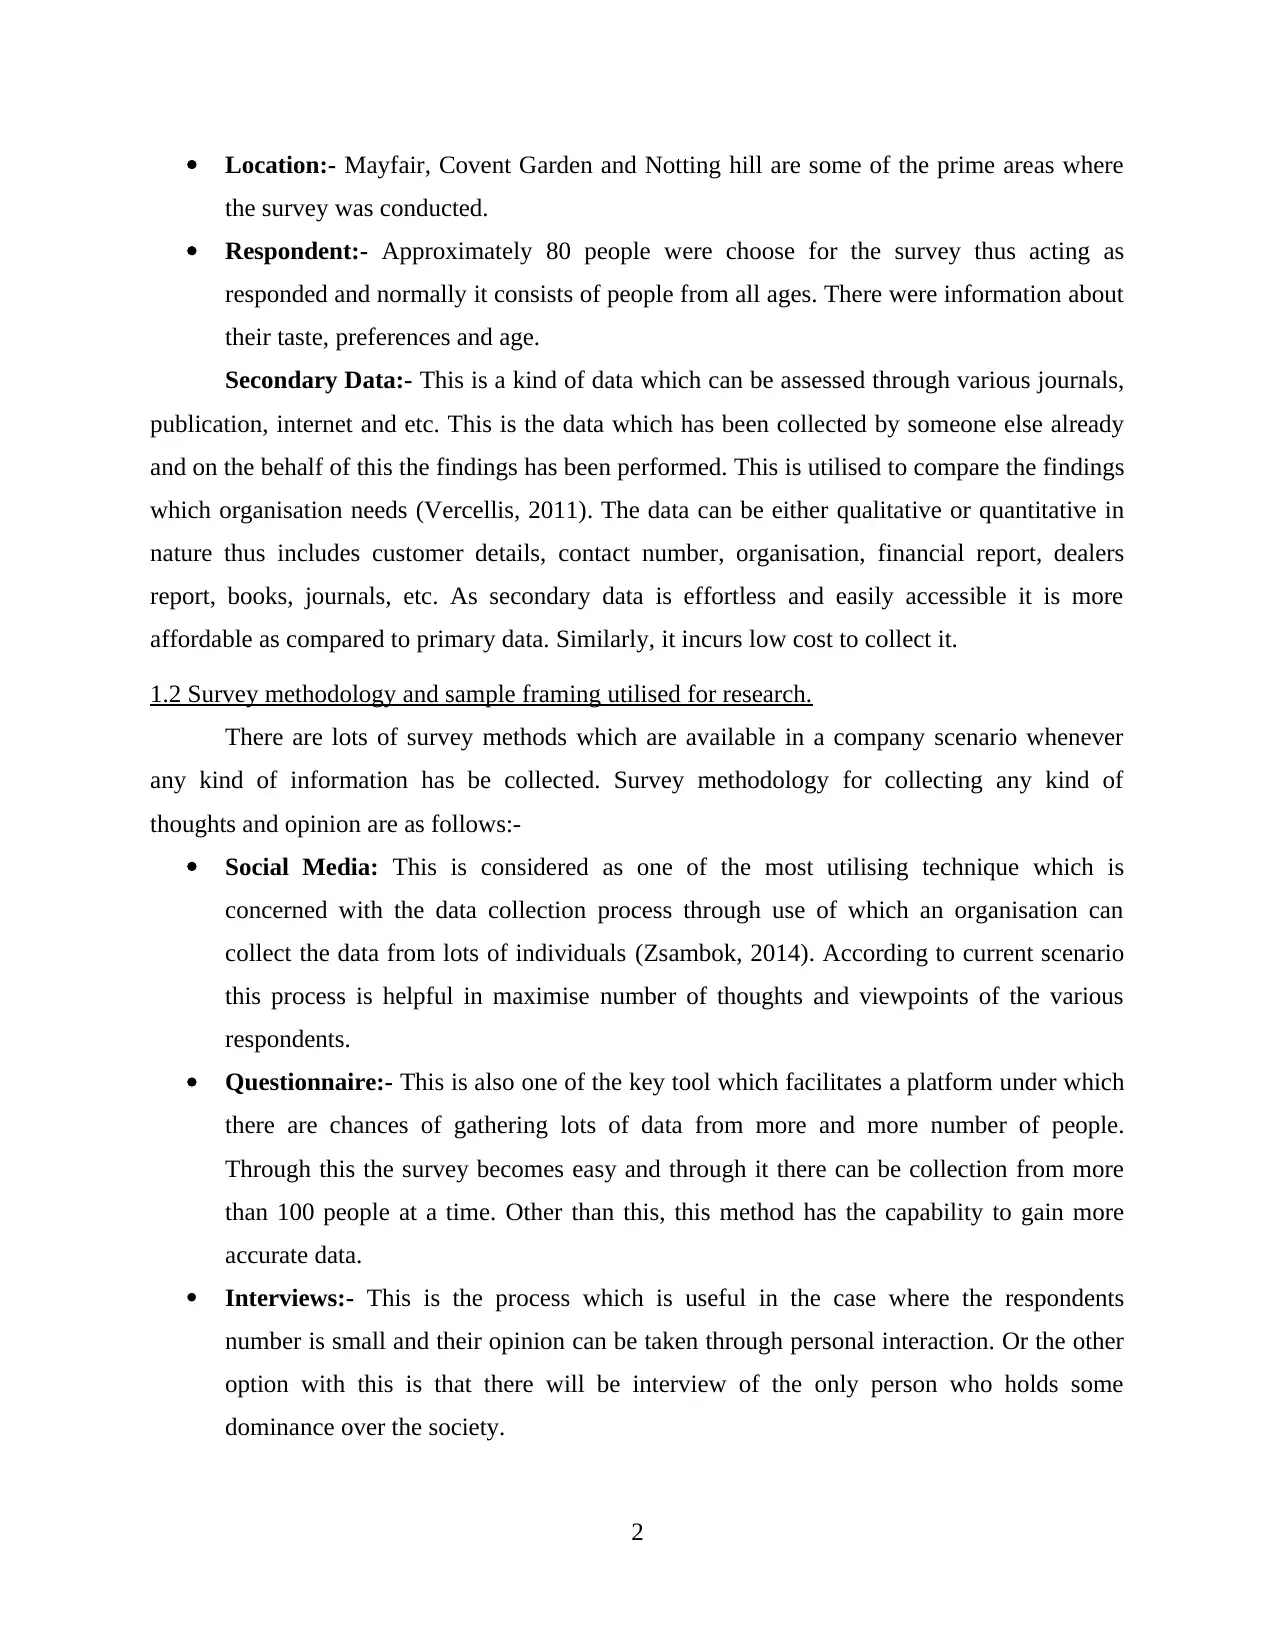
INTRODUCTION
Large companies identify the nature of market before implementing any product and plan
development. This is process which assist in bringing a better useful outcome as through this
they can better organise the things. This context is helping in long term scenario so that chances
of ascertaining objectives become easy and suitable. It can be said that business decision making
is not an easy procedure thus it requires more and more emphasis on activities which are taking
placed with the expansion. Food for Friends is looking forward to come out with a new franchise
in London for increasing their market share and enhance the profit margins (Groebner and et. al.,
2011). For this the manager of this has surveyed so that they can find out a suitable judgement
for a longer period of time. This all report consists of a plan which facilitate investigation
implantation more appropriately. Other than this a questionnaire has been framed to know the
opinion of the individuals. With the help of this they can make better decision thus using
measure of central tendency and measure dispersion. Presentation of the information will be
done through making graphs, charts thus making the data more interesting. In the end, with the
help of financial tools, feasibility of project gets analysed with help in future context.
TASK 1
1.1 Formation of the plan for collecting primary and secondary data.
To part of the expansion plan of 'Food for Friends' in the newer market a full research has
been done through using Primary data and Secondary data.
Primary Data:- It can be called as the first hand data which is gathered by using
questionnaire, surveys, providing free samples with the intention of helping the researcher to
assess the information as per the requirement of the firm. It is the tailor made data and researcher
is needs to sort, arrange and analyse it.
For the expansion of a given organisation survey has been done in the following way:-
Time: Questionnaire was done for a one month period of the time.
Cost: The money which has been used for printing, transportation from the area of the
survey to the office and the person who has been hired is 500 GBP.
Survey Method:- The questionnaire which was prepared was given to the common
people and after they have given the response the forms were taken back.
1
⊘ This is a preview!⊘
Do you want full access?
Subscribe today to unlock all pages.
Trusted by 1+ million students worldwide
Location:- Mayfair, Covent Garden and Notting hill are some of the prime areas where
the survey was conducted.
Respondent:- Approximately 80 people were choose for the survey thus acting as
responded and normally it consists of people from all ages. There were information about
their taste, preferences and age.
Secondary Data:- This is a kind of data which can be assessed through various journals,
publication, internet and etc. This is the data which has been collected by someone else already
and on the behalf of this the findings has been performed. This is utilised to compare the findings
which organisation needs (Vercellis, 2011). The data can be either qualitative or quantitative in
nature thus includes customer details, contact number, organisation, financial report, dealers
report, books, journals, etc. As secondary data is effortless and easily accessible it is more
affordable as compared to primary data. Similarly, it incurs low cost to collect it.
1.2 Survey methodology and sample framing utilised for research.
There are lots of survey methods which are available in a company scenario whenever
any kind of information has be collected. Survey methodology for collecting any kind of
thoughts and opinion are as follows:-
Social Media: This is considered as one of the most utilising technique which is
concerned with the data collection process through use of which an organisation can
collect the data from lots of individuals (Zsambok, 2014). According to current scenario
this process is helpful in maximise number of thoughts and viewpoints of the various
respondents.
Questionnaire:- This is also one of the key tool which facilitates a platform under which
there are chances of gathering lots of data from more and more number of people.
Through this the survey becomes easy and through it there can be collection from more
than 100 people at a time. Other than this, this method has the capability to gain more
accurate data.
Interviews:- This is the process which is useful in the case where the respondents
number is small and their opinion can be taken through personal interaction. Or the other
option with this is that there will be interview of the only person who holds some
dominance over the society.
2
Paraphrase This Document
Need a fresh take? Get an instant paraphrase of this document with our AI Paraphraser
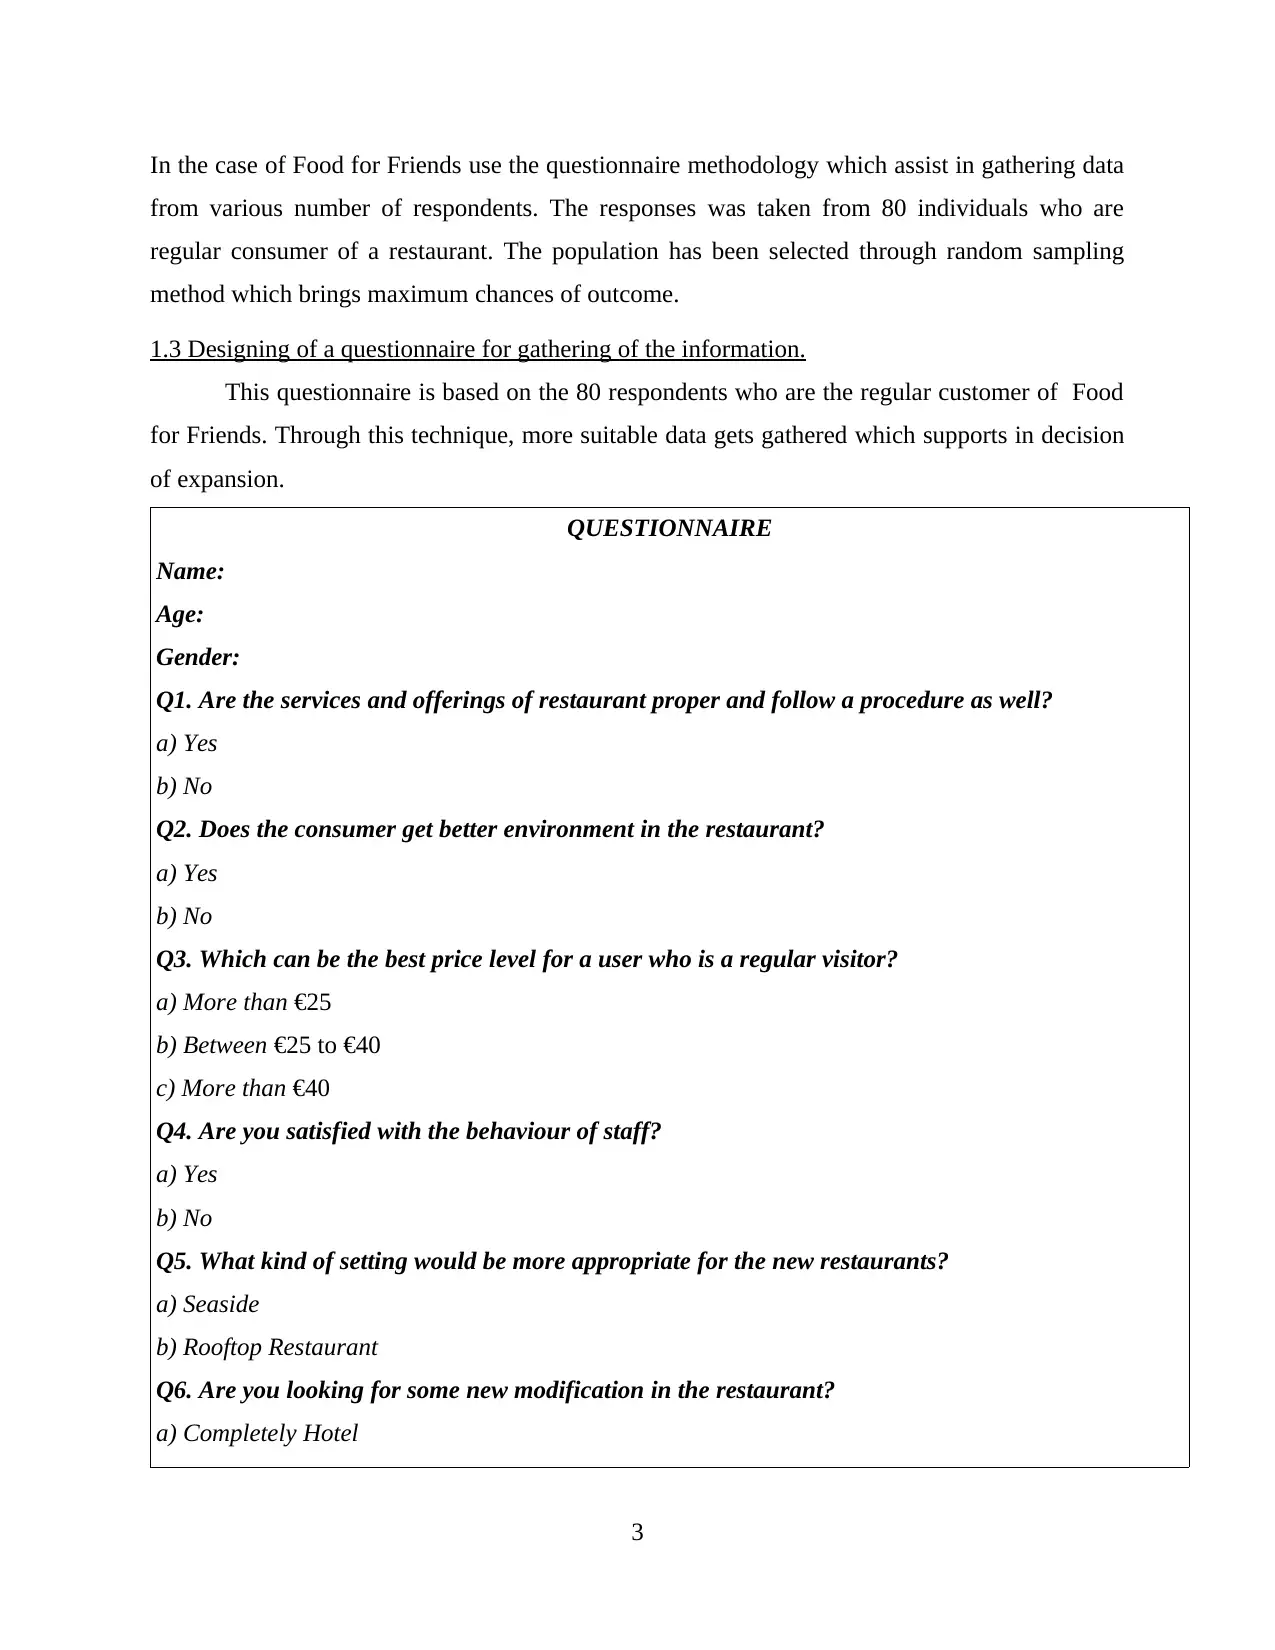
In the case of Food for Friends use the questionnaire methodology which assist in gathering data
from various number of respondents. The responses was taken from 80 individuals who are
regular consumer of a restaurant. The population has been selected through random sampling
method which brings maximum chances of outcome.
1.3 Designing of a questionnaire for gathering of the information.
This questionnaire is based on the 80 respondents who are the regular customer of Food
for Friends. Through this technique, more suitable data gets gathered which supports in decision
of expansion.
QUESTIONNAIRE
Name:
Age:
Gender:
Q1. Are the services and offerings of restaurant proper and follow a procedure as well?
a) Yes
b) No
Q2. Does the consumer get better environment in the restaurant?
a) Yes
b) No
Q3. Which can be the best price level for a user who is a regular visitor?
a) More than €25
b) Between €25 to €40
c) More than €40
Q4. Are you satisfied with the behaviour of staff?
a) Yes
b) No
Q5. What kind of setting would be more appropriate for the new restaurants?
a) Seaside
b) Rooftop Restaurant
Q6. Are you looking for some new modification in the restaurant?
a) Completely Hotel
3
b) Cafe
c) Hotel with restaurant
Q7. Which thing attracts you the most?
a) Amenities
b) Environment
Q8. Any kind of new recommendations or views.
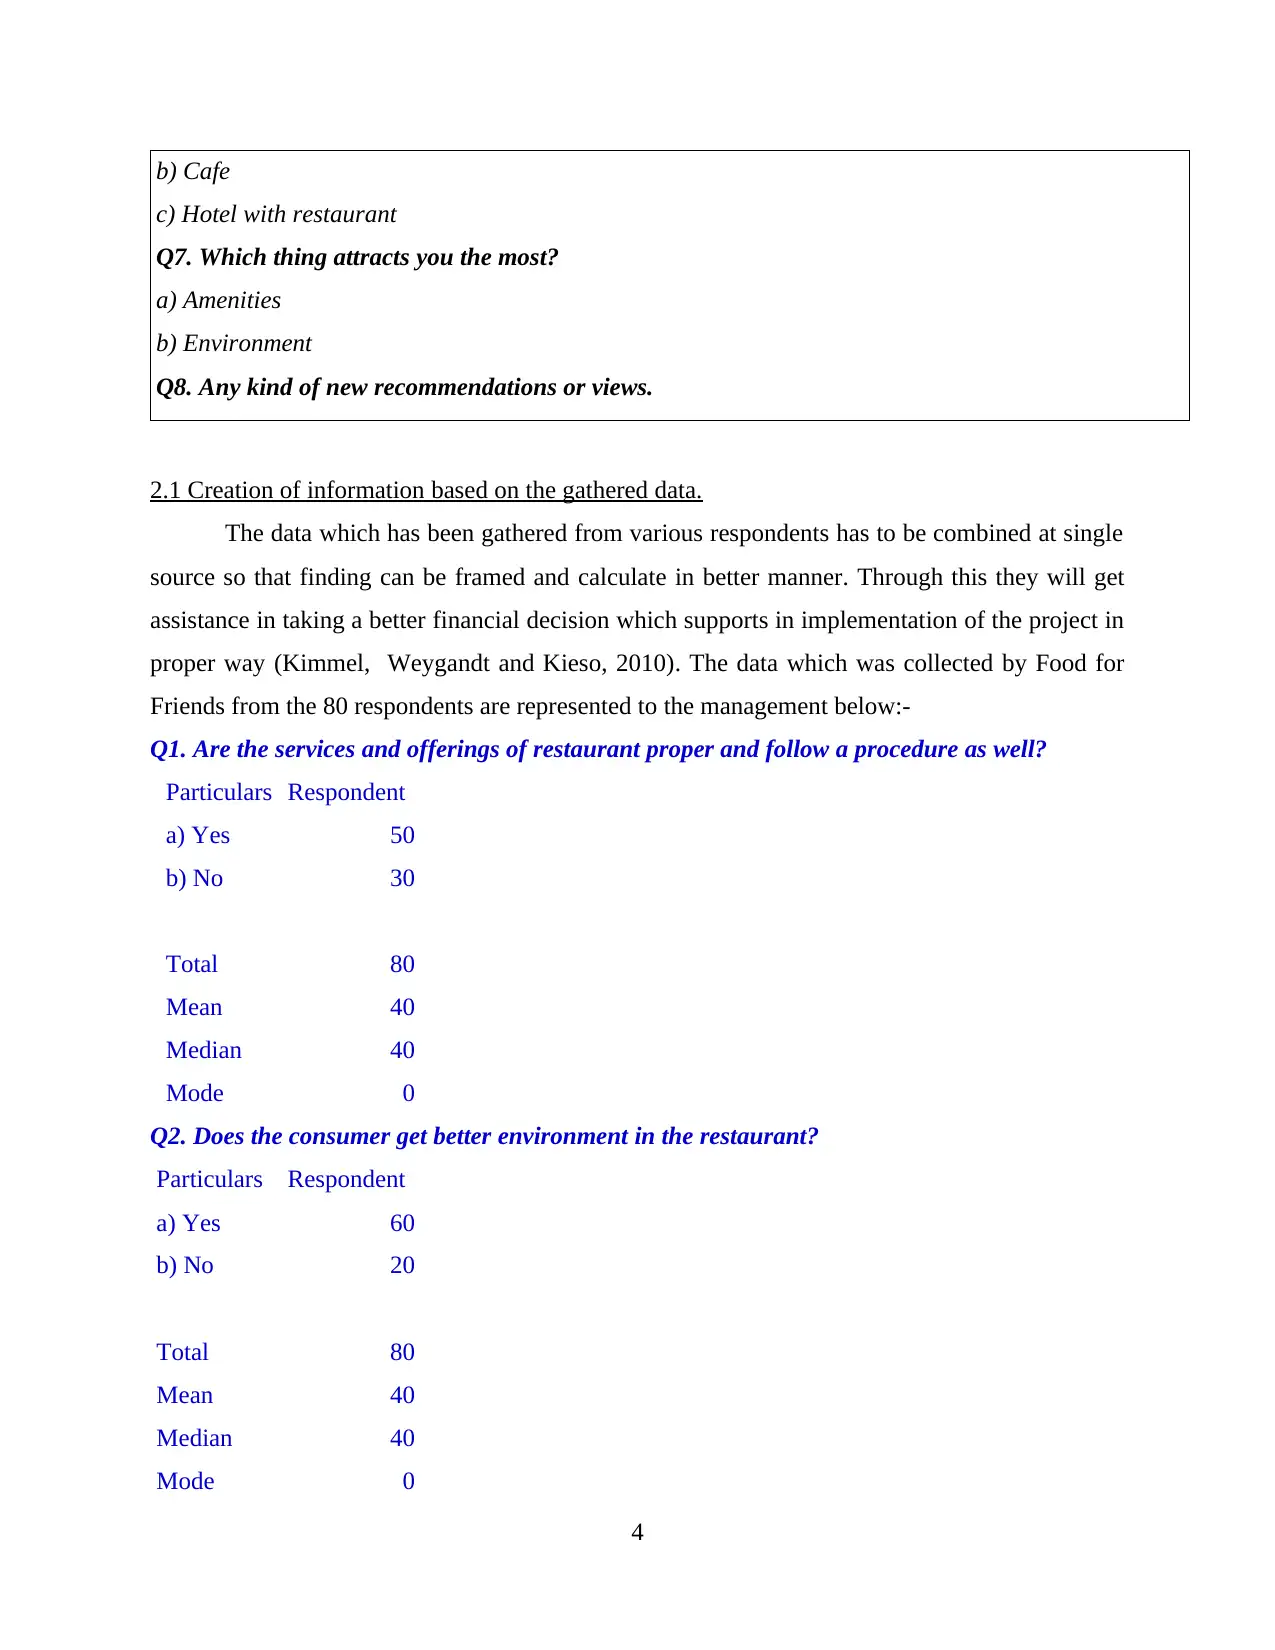
2.1 Creation of information based on the gathered data.
The data which has been gathered from various respondents has to be combined at single
source so that finding can be framed and calculate in better manner. Through this they will get
assistance in taking a better financial decision which supports in implementation of the project in
proper way (Kimmel, Weygandt and Kieso, 2010). The data which was collected by Food for
Friends from the 80 respondents are represented to the management below:-
Q1. Are the services and offerings of restaurant proper and follow a procedure as well?
Particulars Respondent
a) Yes 50
b) No 30
Total 80
Mean 40
Median 40
Mode 0
Q2. Does the consumer get better environment in the restaurant?
Particulars Respondent
a) Yes 60
b) No 20
Total 80
Mean 40
Median 40
Mode 0
4
c) Hotel with restaurant
Q7. Which thing attracts you the most?
a) Amenities
b) Environment
Q8. Any kind of new recommendations or views.
2.1 Creation of information based on the gathered data.
The data which has been gathered from various respondents has to be combined at single
source so that finding can be framed and calculate in better manner. Through this they will get
assistance in taking a better financial decision which supports in implementation of the project in
proper way (Kimmel, Weygandt and Kieso, 2010). The data which was collected by Food for
Friends from the 80 respondents are represented to the management below:-
Q1. Are the services and offerings of restaurant proper and follow a procedure as well?
Particulars Respondent
a) Yes 50
b) No 30
Total 80
Mean 40
Median 40
Mode 0
Q2. Does the consumer get better environment in the restaurant?
Particulars Respondent
a) Yes 60
b) No 20
Total 80
Mean 40
Median 40
Mode 0
4
⊘ This is a preview!⊘
Do you want full access?
Subscribe today to unlock all pages.
Trusted by 1+ million students worldwide
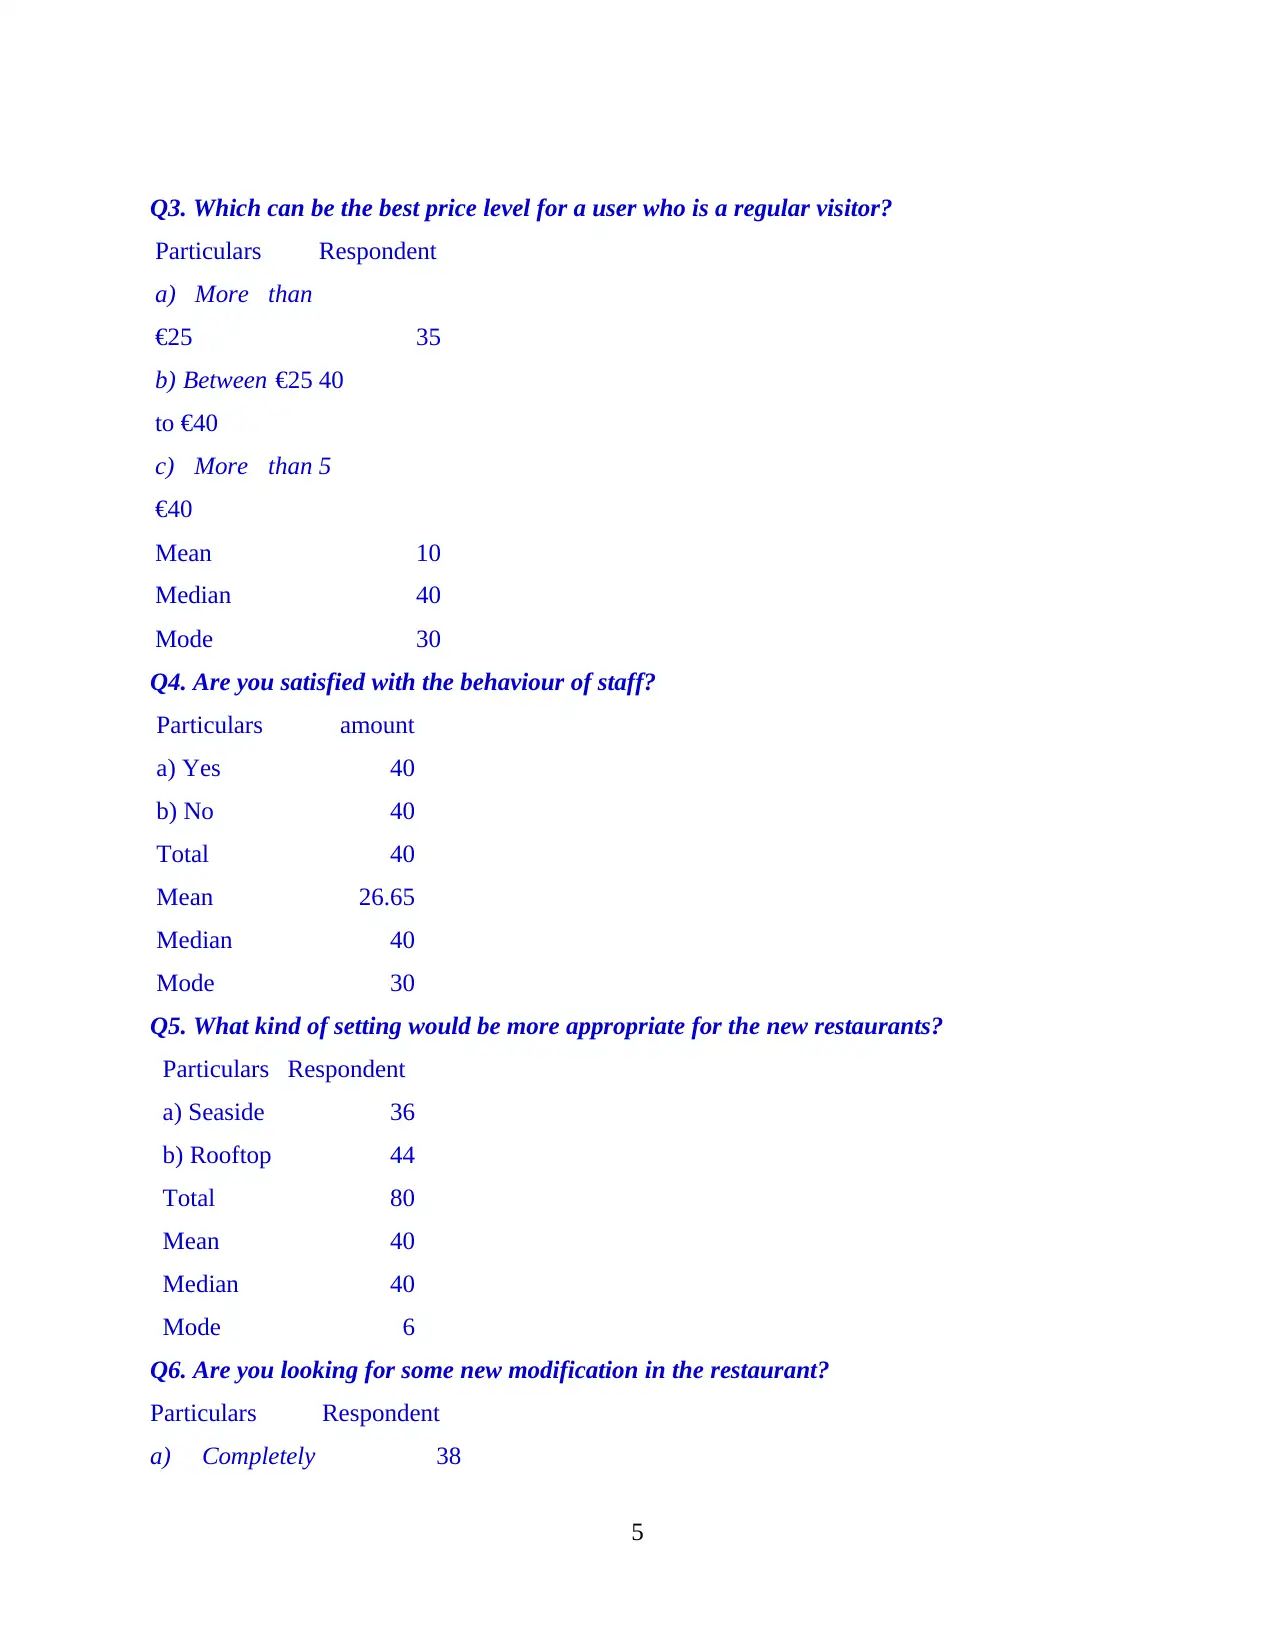
Q3. Which can be the best price level for a user who is a regular visitor?
Particulars Respondent
a) More than
€25 35
b) Between €25
to €40
40
c) More than
€40
5
Mean 10
Median 40
Mode 30
Q4. Are you satisfied with the behaviour of staff?
Particulars amount
a) Yes 40
b) No 40
Total 40
Mean 26.65
Median 40
Mode 30
Q5. What kind of setting would be more appropriate for the new restaurants?
Particulars Respondent
a) Seaside 36
b) Rooftop 44
Total 80
Mean 40
Median 40
Mode 6
Q6. Are you looking for some new modification in the restaurant?
Particulars Respondent
a) Completely 38
5
Particulars Respondent
a) More than
€25 35
b) Between €25
to €40
40
c) More than
€40
5
Mean 10
Median 40
Mode 30
Q4. Are you satisfied with the behaviour of staff?
Particulars amount
a) Yes 40
b) No 40
Total 40
Mean 26.65
Median 40
Mode 30
Q5. What kind of setting would be more appropriate for the new restaurants?
Particulars Respondent
a) Seaside 36
b) Rooftop 44
Total 80
Mean 40
Median 40
Mode 6
Q6. Are you looking for some new modification in the restaurant?
Particulars Respondent
a) Completely 38
5
Paraphrase This Document
Need a fresh take? Get an instant paraphrase of this document with our AI Paraphraser
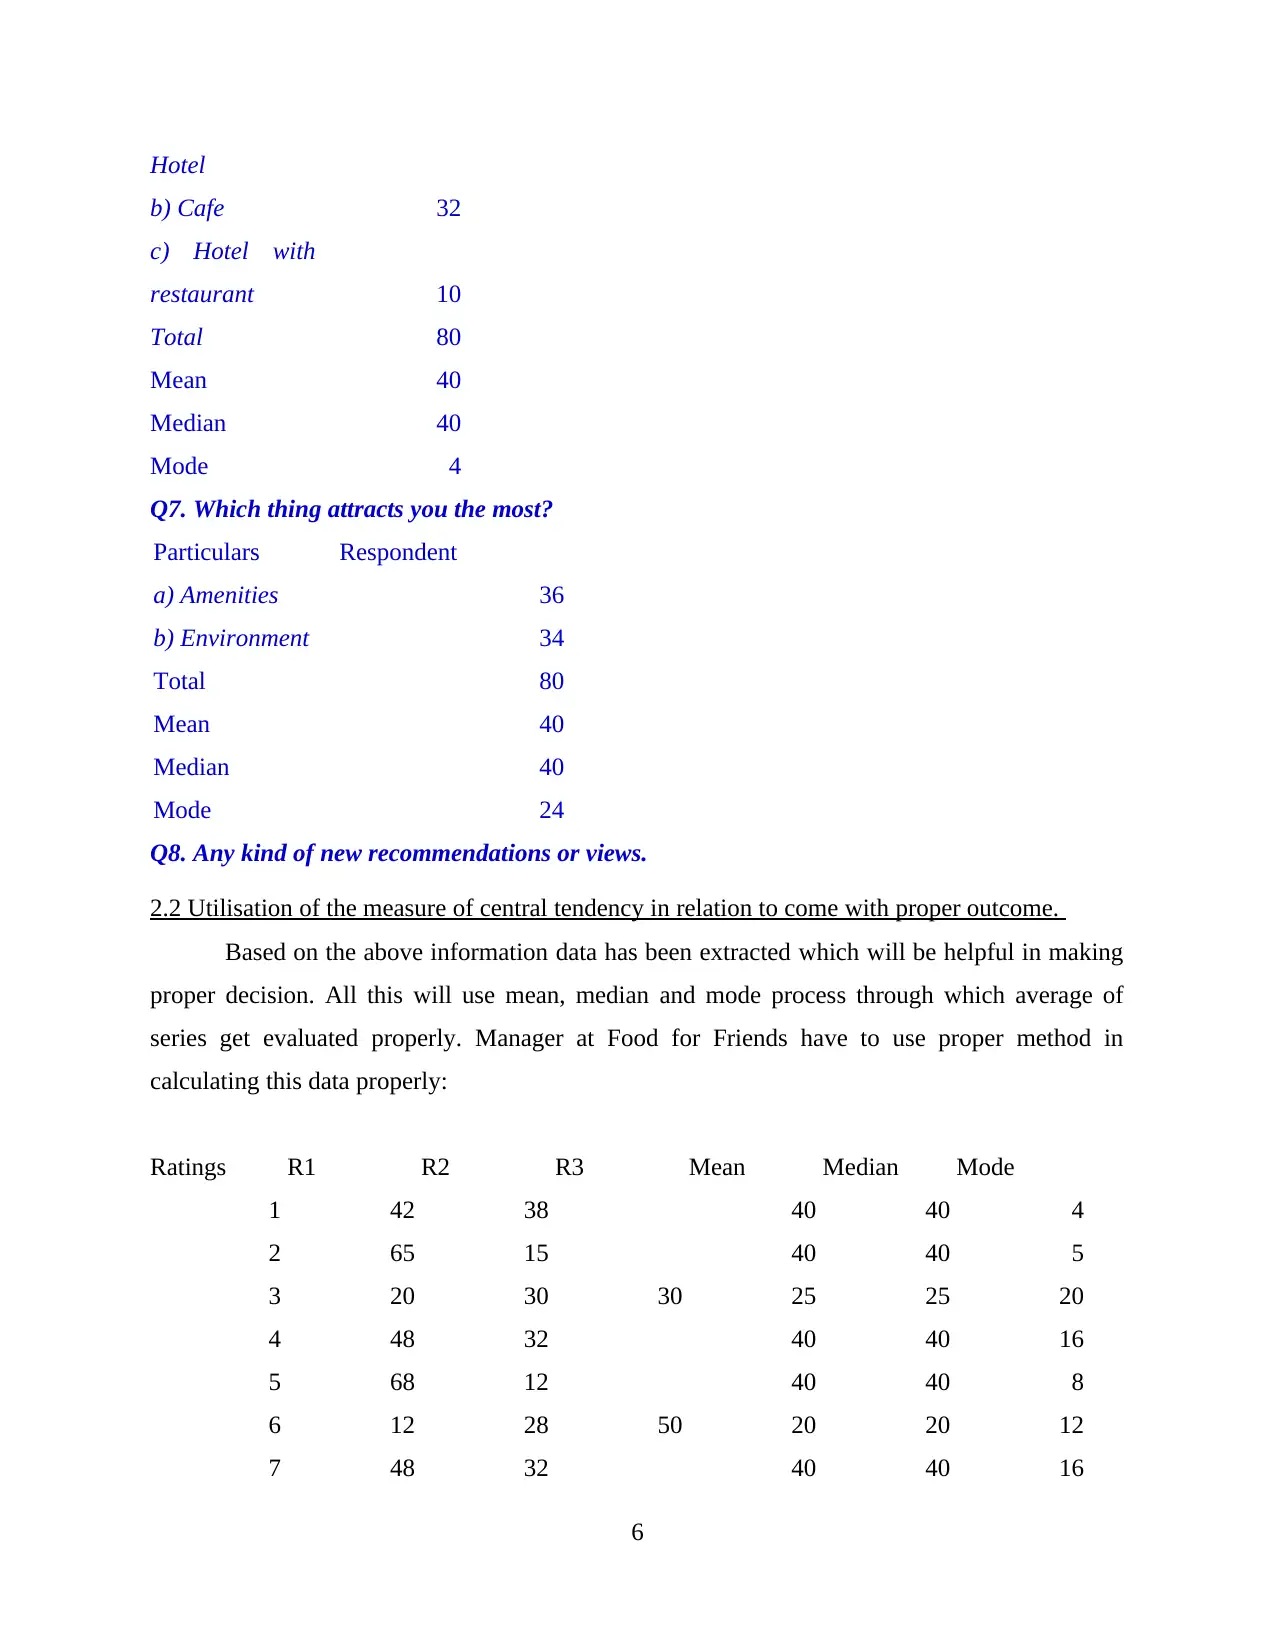
Hotel
b) Cafe 32
c) Hotel with
restaurant 10
Total 80
Mean 40
Median 40
Mode 4
Q7. Which thing attracts you the most?
Particulars Respondent
a) Amenities 36
b) Environment 34
Total 80
Mean 40
Median 40
Mode 24
Q8. Any kind of new recommendations or views.
2.2 Utilisation of the measure of central tendency in relation to come with proper outcome.
Based on the above information data has been extracted which will be helpful in making
proper decision. All this will use mean, median and mode process through which average of
series get evaluated properly. Manager at Food for Friends have to use proper method in
calculating this data properly:
Ratings R1 R2 R3 Mean Median Mode
1 42 38 40 40 4
2 65 15 40 40 5
3 20 30 30 25 25 20
4 48 32 40 40 16
5 68 12 40 40 8
6 12 28 50 20 20 12
7 48 32 40 40 16
6
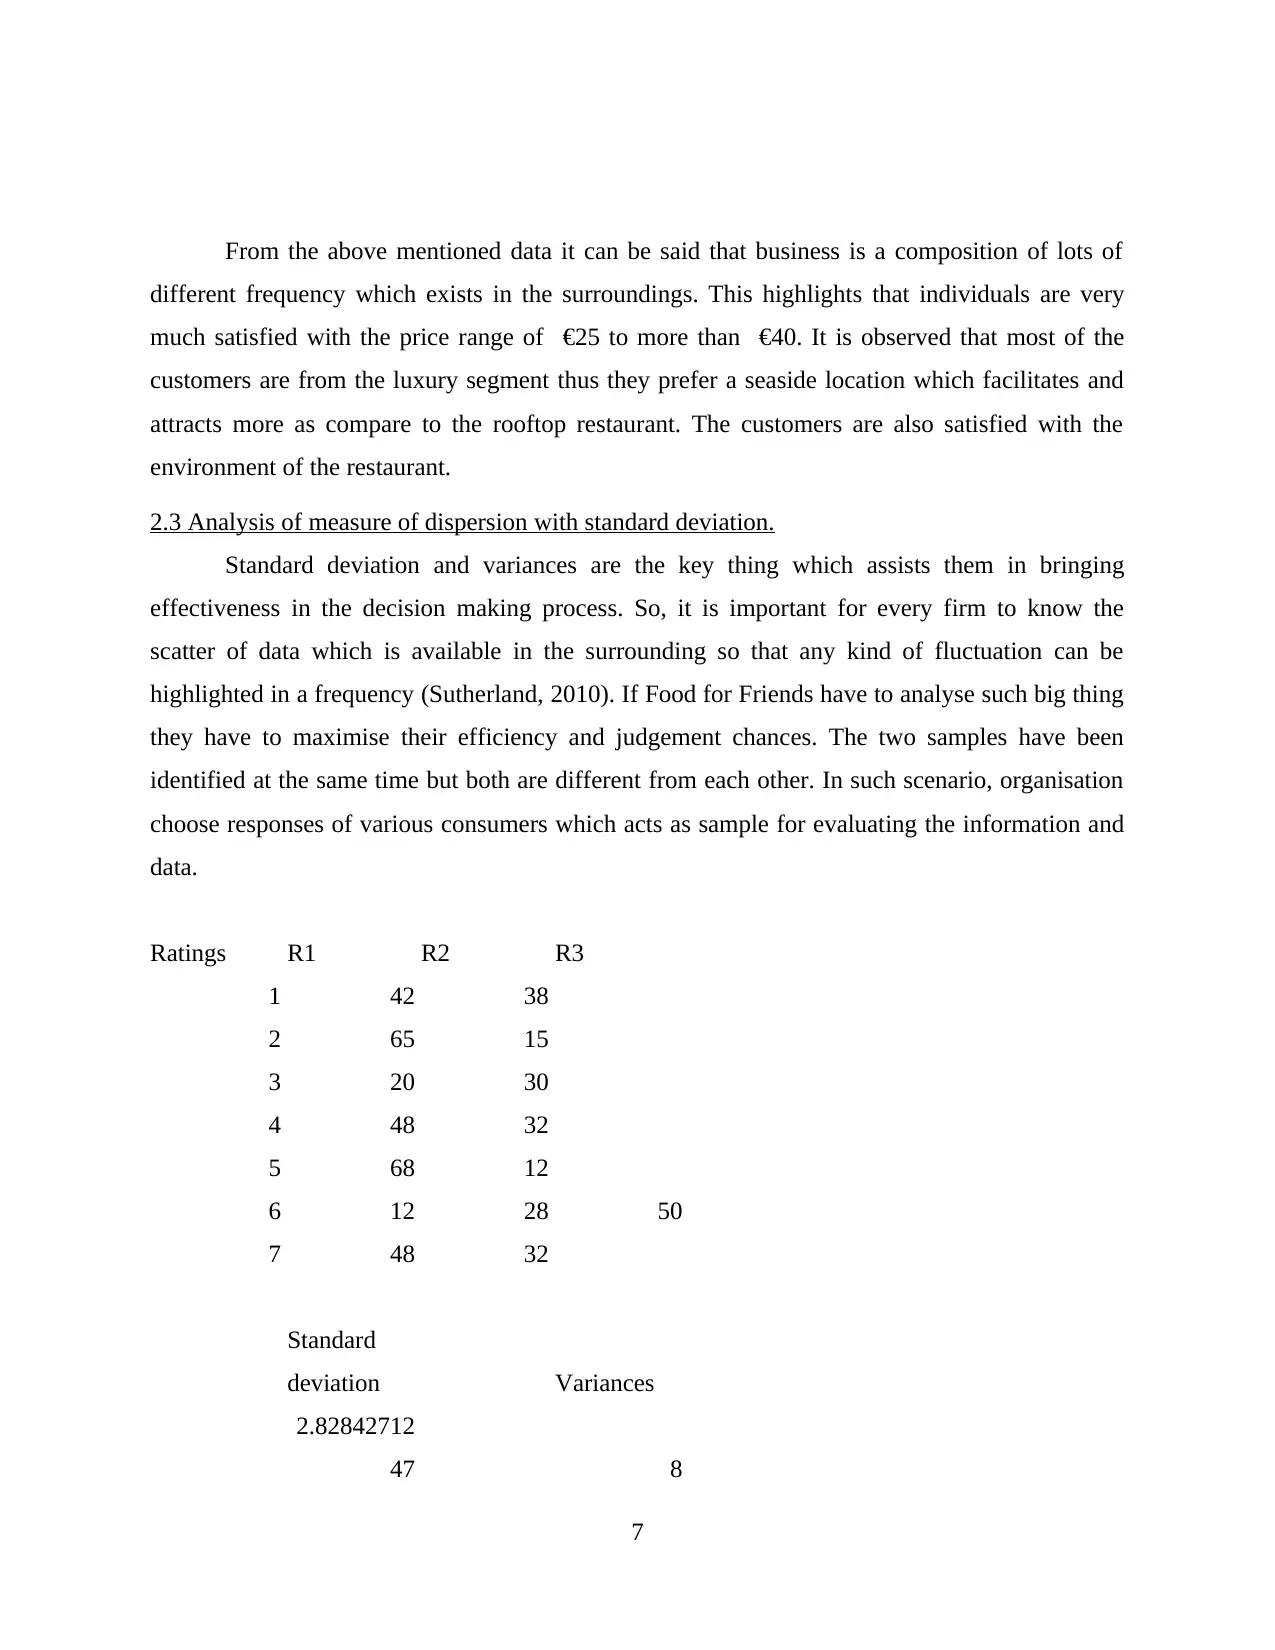
From the above mentioned data it can be said that business is a composition of lots of
different frequency which exists in the surroundings. This highlights that individuals are very
much satisfied with the price range of €25 to more than €40. It is observed that most of the
customers are from the luxury segment thus they prefer a seaside location which facilitates and
attracts more as compare to the rooftop restaurant. The customers are also satisfied with the
environment of the restaurant.
2.3 Analysis of measure of dispersion with standard deviation.
Standard deviation and variances are the key thing which assists them in bringing
effectiveness in the decision making process. So, it is important for every firm to know the
scatter of data which is available in the surrounding so that any kind of fluctuation can be
highlighted in a frequency (Sutherland, 2010). If Food for Friends have to analyse such big thing
they have to maximise their efficiency and judgement chances. The two samples have been
identified at the same time but both are different from each other. In such scenario, organisation
choose responses of various consumers which acts as sample for evaluating the information and
data.
Ratings R1 R2 R3
1 42 38
2 65 15
3 20 30 30
4 48 32
5 68 12
6 12 28 50
7 48 32
Standard
deviation Variances
2.82842712
47 8
7
⊘ This is a preview!⊘
Do you want full access?
Subscribe today to unlock all pages.
Trusted by 1+ million students worldwide
35.3553390
593 1250
7.07106781
19 50
11.3137084
99 128
39.5979797
464 1568
11.3137084
99 128
11.3137084
99 128
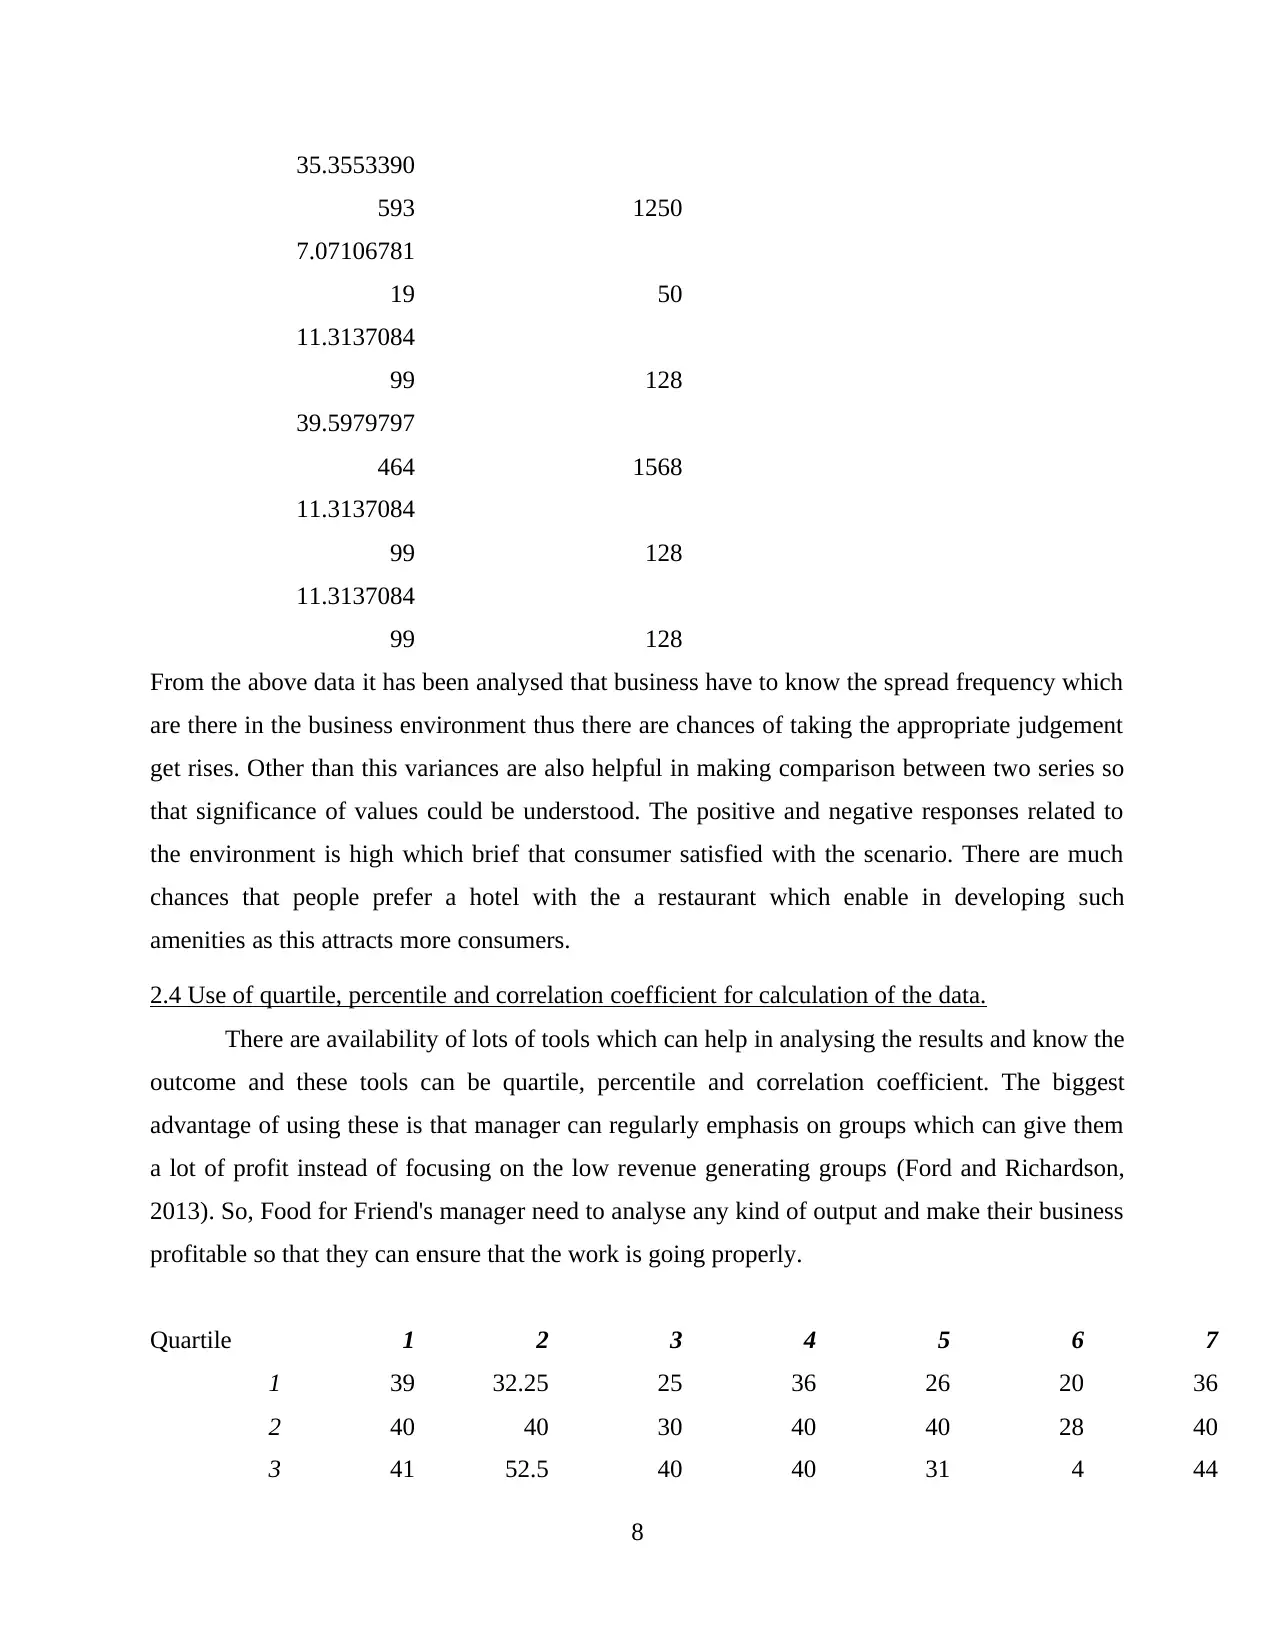
From the above data it has been analysed that business have to know the spread frequency which
are there in the business environment thus there are chances of taking the appropriate judgement
get rises. Other than this variances are also helpful in making comparison between two series so
that significance of values could be understood. The positive and negative responses related to
the environment is high which brief that consumer satisfied with the scenario. There are much
chances that people prefer a hotel with the a restaurant which enable in developing such
amenities as this attracts more consumers.
2.4 Use of quartile, percentile and correlation coefficient for calculation of the data.
There are availability of lots of tools which can help in analysing the results and know the
outcome and these tools can be quartile, percentile and correlation coefficient. The biggest
advantage of using these is that manager can regularly emphasis on groups which can give them
a lot of profit instead of focusing on the low revenue generating groups (Ford and Richardson,
2013). So, Food for Friend's manager need to analyse any kind of output and make their business
profitable so that they can ensure that the work is going properly.
Quartile 1 2 3 4 5 6 7
1 39 32.25 25 36 26 20 36
2 40 40 30 40 40 28 40
3 41 52.5 40 40 31 4 44
8
593 1250
7.07106781
19 50
11.3137084
99 128
39.5979797
464 1568
11.3137084
99 128
11.3137084
99 128
From the above data it has been analysed that business have to know the spread frequency which
are there in the business environment thus there are chances of taking the appropriate judgement
get rises. Other than this variances are also helpful in making comparison between two series so
that significance of values could be understood. The positive and negative responses related to
the environment is high which brief that consumer satisfied with the scenario. There are much
chances that people prefer a hotel with the a restaurant which enable in developing such
amenities as this attracts more consumers.
2.4 Use of quartile, percentile and correlation coefficient for calculation of the data.
There are availability of lots of tools which can help in analysing the results and know the
outcome and these tools can be quartile, percentile and correlation coefficient. The biggest
advantage of using these is that manager can regularly emphasis on groups which can give them
a lot of profit instead of focusing on the low revenue generating groups (Ford and Richardson,
2013). So, Food for Friend's manager need to analyse any kind of output and make their business
profitable so that they can ensure that the work is going properly.
Quartile 1 2 3 4 5 6 7
1 39 32.25 25 36 26 20 36
2 40 40 30 40 40 28 40
3 41 52.5 40 40 31 4 44
8
Paraphrase This Document
Need a fresh take? Get an instant paraphrase of this document with our AI Paraphraser
4 42 38 40 40 40 4 68
Correlation
coefficient
1 and 2 1
3 and 6
0.81705716
91
4 and 5 1
From the calculated data they can know the environment and offerings have good relation
thus bringing a better relationship. This area promote business in ethical direction but avoid
many certainties. Other than this, activities are implemented in right direction thus making it sure
that the leaders and manager are performing their work in better way. This also include the new
location of the restaurant. So there are lots of things which are in favour of an organisation and
can gain benefit in longer period. The association has to take better actions against these things.
TASK 2
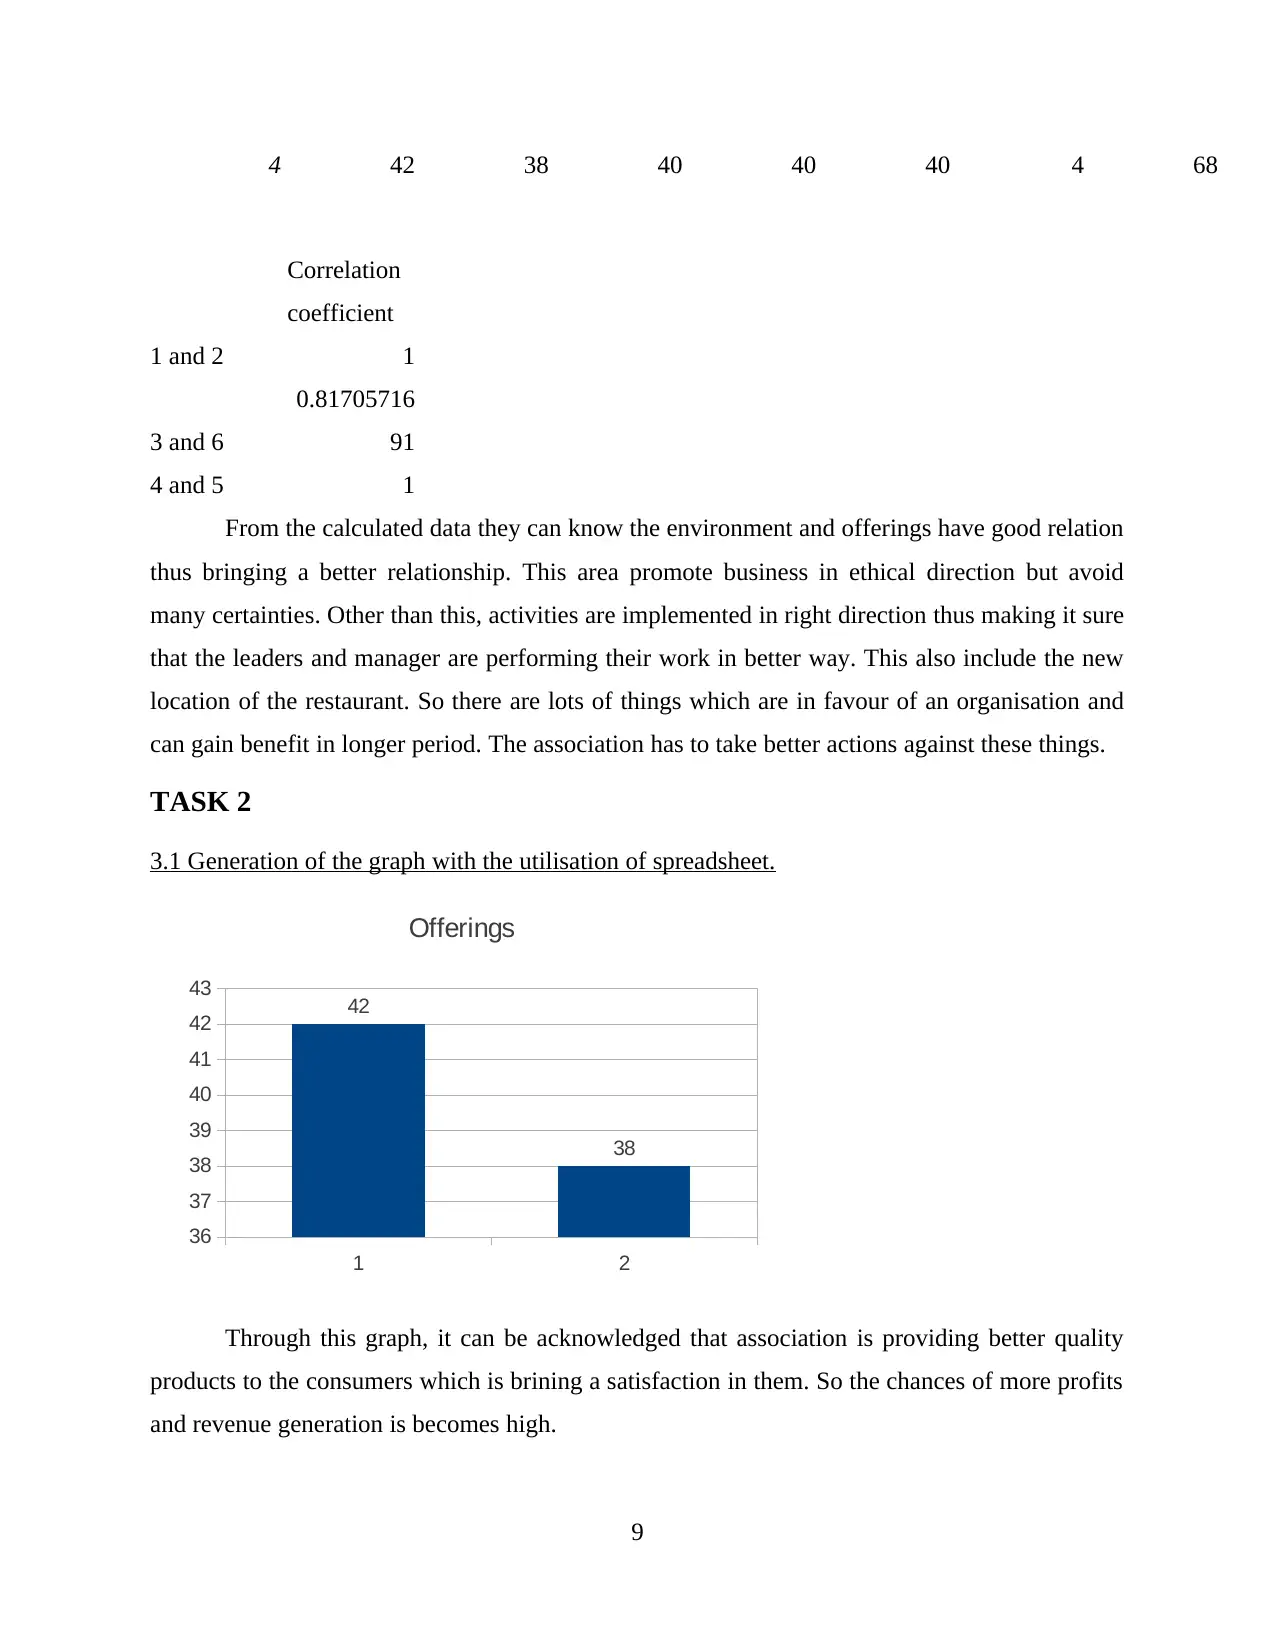
3.1 Generation of the graph with the utilisation of spreadsheet.
1 2
36
37
38
39
40
41
42
43 42
38
Offerings
Through this graph, it can be acknowledged that association is providing better quality
products to the consumers which is brining a satisfaction in them. So the chances of more profits
and revenue generation is becomes high.
9
Correlation
coefficient
1 and 2 1
3 and 6
0.81705716
91
4 and 5 1
From the calculated data they can know the environment and offerings have good relation
thus bringing a better relationship. This area promote business in ethical direction but avoid
many certainties. Other than this, activities are implemented in right direction thus making it sure
that the leaders and manager are performing their work in better way. This also include the new
location of the restaurant. So there are lots of things which are in favour of an organisation and
can gain benefit in longer period. The association has to take better actions against these things.
TASK 2
3.1 Generation of the graph with the utilisation of spreadsheet.
1 2
36
37
38
39
40
41
42
43 42
38
Offerings
Through this graph, it can be acknowledged that association is providing better quality
products to the consumers which is brining a satisfaction in them. So the chances of more profits
and revenue generation is becomes high.
9
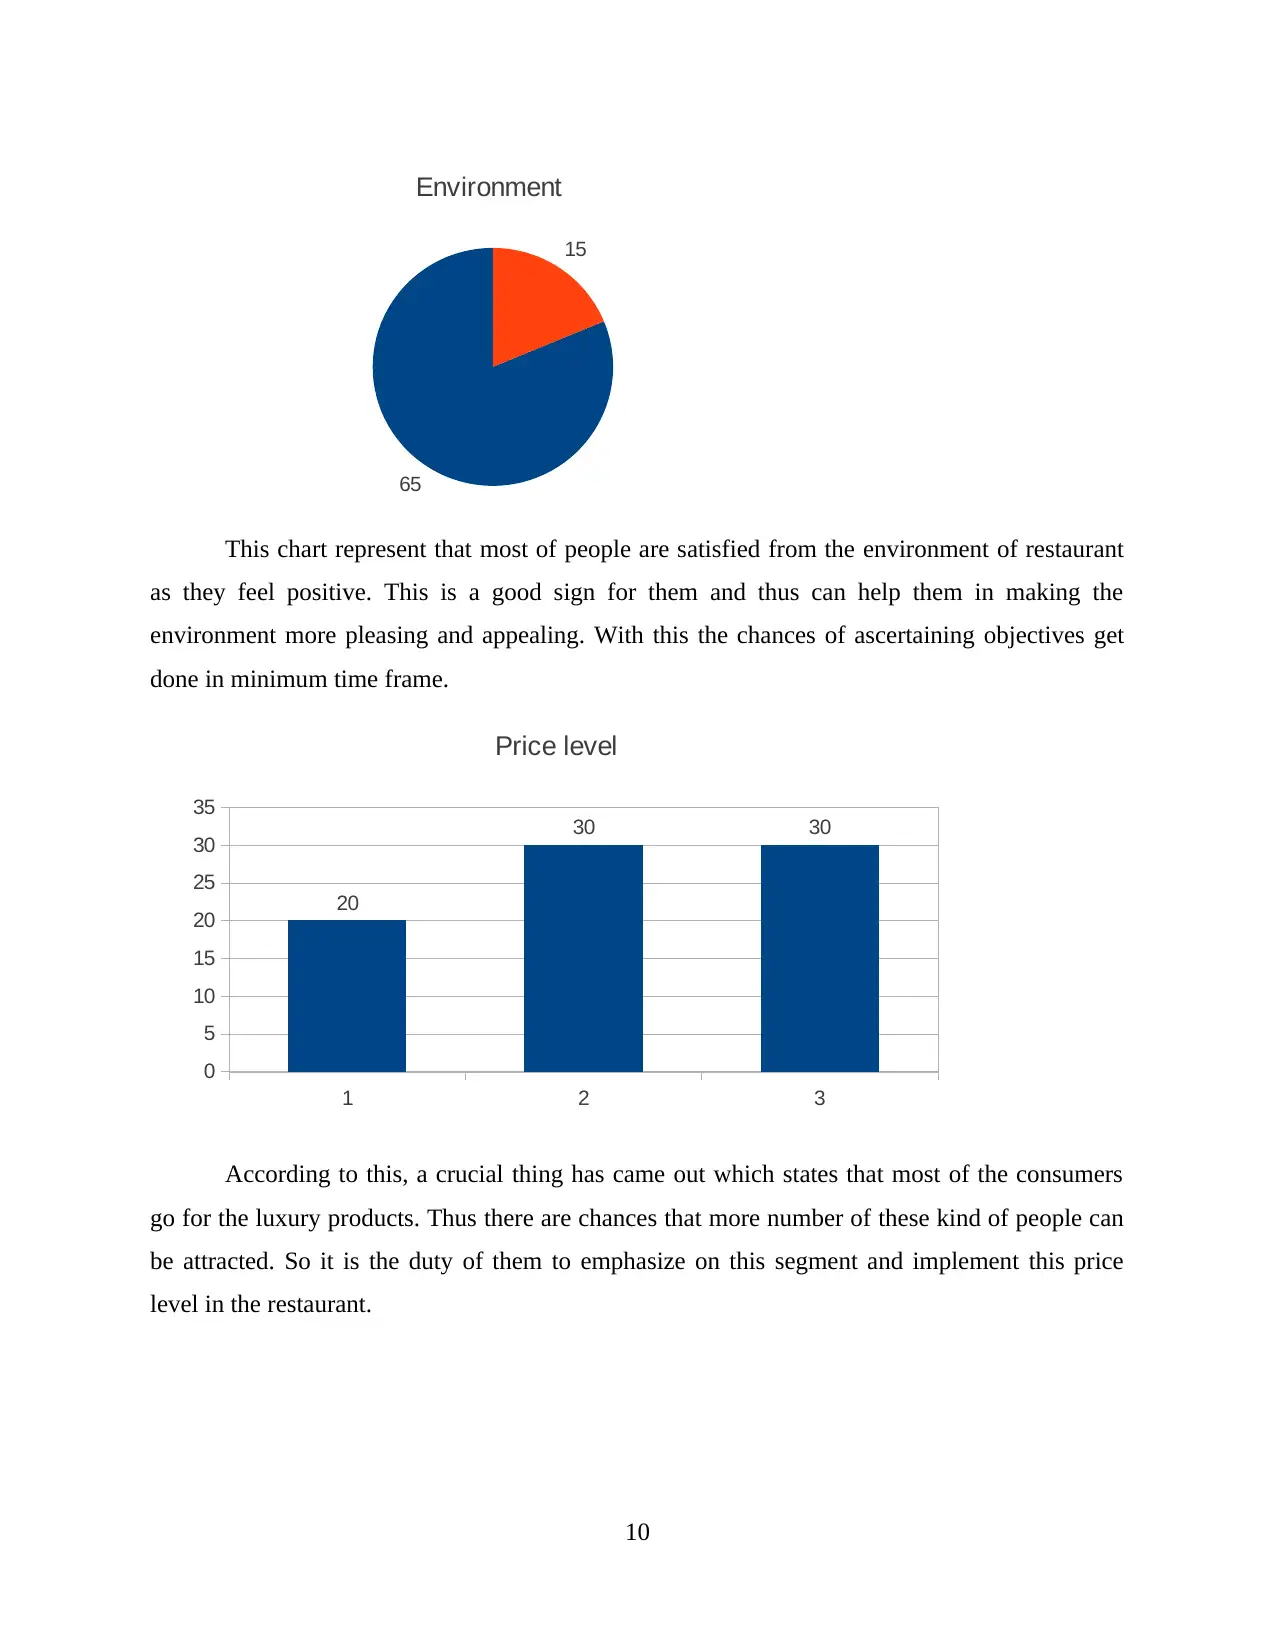
65
15
Environment
This chart represent that most of people are satisfied from the environment of restaurant
as they feel positive. This is a good sign for them and thus can help them in making the
environment more pleasing and appealing. With this the chances of ascertaining objectives get
done in minimum time frame.
1 2 3
0
5
10
15
20
25
30
35
20
30 30
Price level
According to this, a crucial thing has came out which states that most of the consumers
go for the luxury products. Thus there are chances that more number of these kind of people can
be attracted. So it is the duty of them to emphasize on this segment and implement this price
level in the restaurant.
10
15
Environment
This chart represent that most of people are satisfied from the environment of restaurant
as they feel positive. This is a good sign for them and thus can help them in making the
environment more pleasing and appealing. With this the chances of ascertaining objectives get
done in minimum time frame.
1 2 3
0
5
10
15
20
25
30
35
20
30 30
Price level
According to this, a crucial thing has came out which states that most of the consumers
go for the luxury products. Thus there are chances that more number of these kind of people can
be attracted. So it is the duty of them to emphasize on this segment and implement this price
level in the restaurant.
10
⊘ This is a preview!⊘
Do you want full access?
Subscribe today to unlock all pages.
Trusted by 1+ million students worldwide
1 out of 20
Related Documents


Your All-in-One AI-Powered Toolkit for Academic Success.
+13062052269
info@desklib.com
Available 24*7 on WhatsApp / Email
![[object Object]](/_next/static/media/star-bottom.7253800d.svg)
Unlock your academic potential
Copyright © 2020–2026 A2Z Services. All Rights Reserved. Developed and managed by ZUCOL.