Analysis of Murano Restaurant Data for Business Decisions
VerifiedAdded on 2020/06/04
|19
|3734
|169
Report
AI Summary
This report analyzes data collected from customers of Murano Restaurant to inform business decisions. It begins with an introduction and then outlines the plan for collecting primary and secondary data, including sampling methods and questionnaire design. The report then calculates descriptive statistics such as mean, median, and mode, and analyzes the results, including measures of dispersion, quartile, and correlation. Primary data is analyzed through charts, and a formal business report is prepared. Finally, project evaluation methods are applied to assess the cash flow and viability of the project, including payback period, ARR, NPV, and IRR calculations. The report uses various figures and tables to present the findings and provides interpretations of the data to support business decision-making.

BUSINESS DECISION MAKING
Paraphrase This Document
Need a fresh take? Get an instant paraphrase of this document with our AI Paraphraser
TABLE OF CONTENTS
INTRODUCTION...........................................................................................................................1
TASK 1............................................................................................................................................1
1.1 Plan for collection of primary and secondary data...........................................................1
1.2 Sampling methods and survey methodology....................................................................1
1.3 Questionnaire for research.....................................................................................................2
TASK 2............................................................................................................................................4
2.1 Calculation of descriptive statistics.......................................................................................4
2.2 Analysis of results..................................................................................................................5
2.3 Measures of dispersion..........................................................................................................5
2.4 Quartile and correlation.........................................................................................................6
TASK 3............................................................................................................................................6
3.1 Analysis of primary data........................................................................................................6
3.2 Trend analysis chart...............................................................................................................9
3.3 Presentation of results..........................................................................................................10
3.4 Formal business report.........................................................................................................10
TASK 4..........................................................................................................................................11
4.1 Information processing tools...............................................................................................11
4.2 Project network diagram......................................................................................................11
4.3 Project evaluation methods..................................................................................................13
CONCLUSION..............................................................................................................................15
Figure 1: People opinion on quality of service................................................................................7
Figure 2: Quality of dining facilities at Murano restaurant.............................................................8
Figure 3: Factors given importance by individuals while selecting any restaurant.........................9
Figure 4: Trend analysis chart.........................................................................................................9
Figure 5: GANTT chart.................................................................................................................12
Figure 6: Calculation of payback period.......................................................................................13
Figure 7: Calculation of ARR........................................................................................................13
Figure 8: Calculation of NPV........................................................................................................14
Figure 9: Calculation of IRR.........................................................................................................14
Table 1: Calculation of mean, median and mode............................................................................4
Table 2: Measures of dispersion......................................................................................................5
Table 3: Calculation of quartile and correlation..............................................................................6
⊘ This is a preview!⊘
Do you want full access?
Subscribe today to unlock all pages.
Trusted by 1+ million students worldwide
INTRODUCTION
Research is one of the fastest growing field in UK and other nations of the world. In the
current research, analysis of data is done that is collected from people who consume products of
Murano restaurant. Descriptive analysis is done and through charts, primary data is analysed.
Sample of 50 people is taken in the present research study. In middle part of the report, formal
business report is prepared and at the end, project evaluation methods are applied on cash flow
and viability of project is measured.
TASK 1
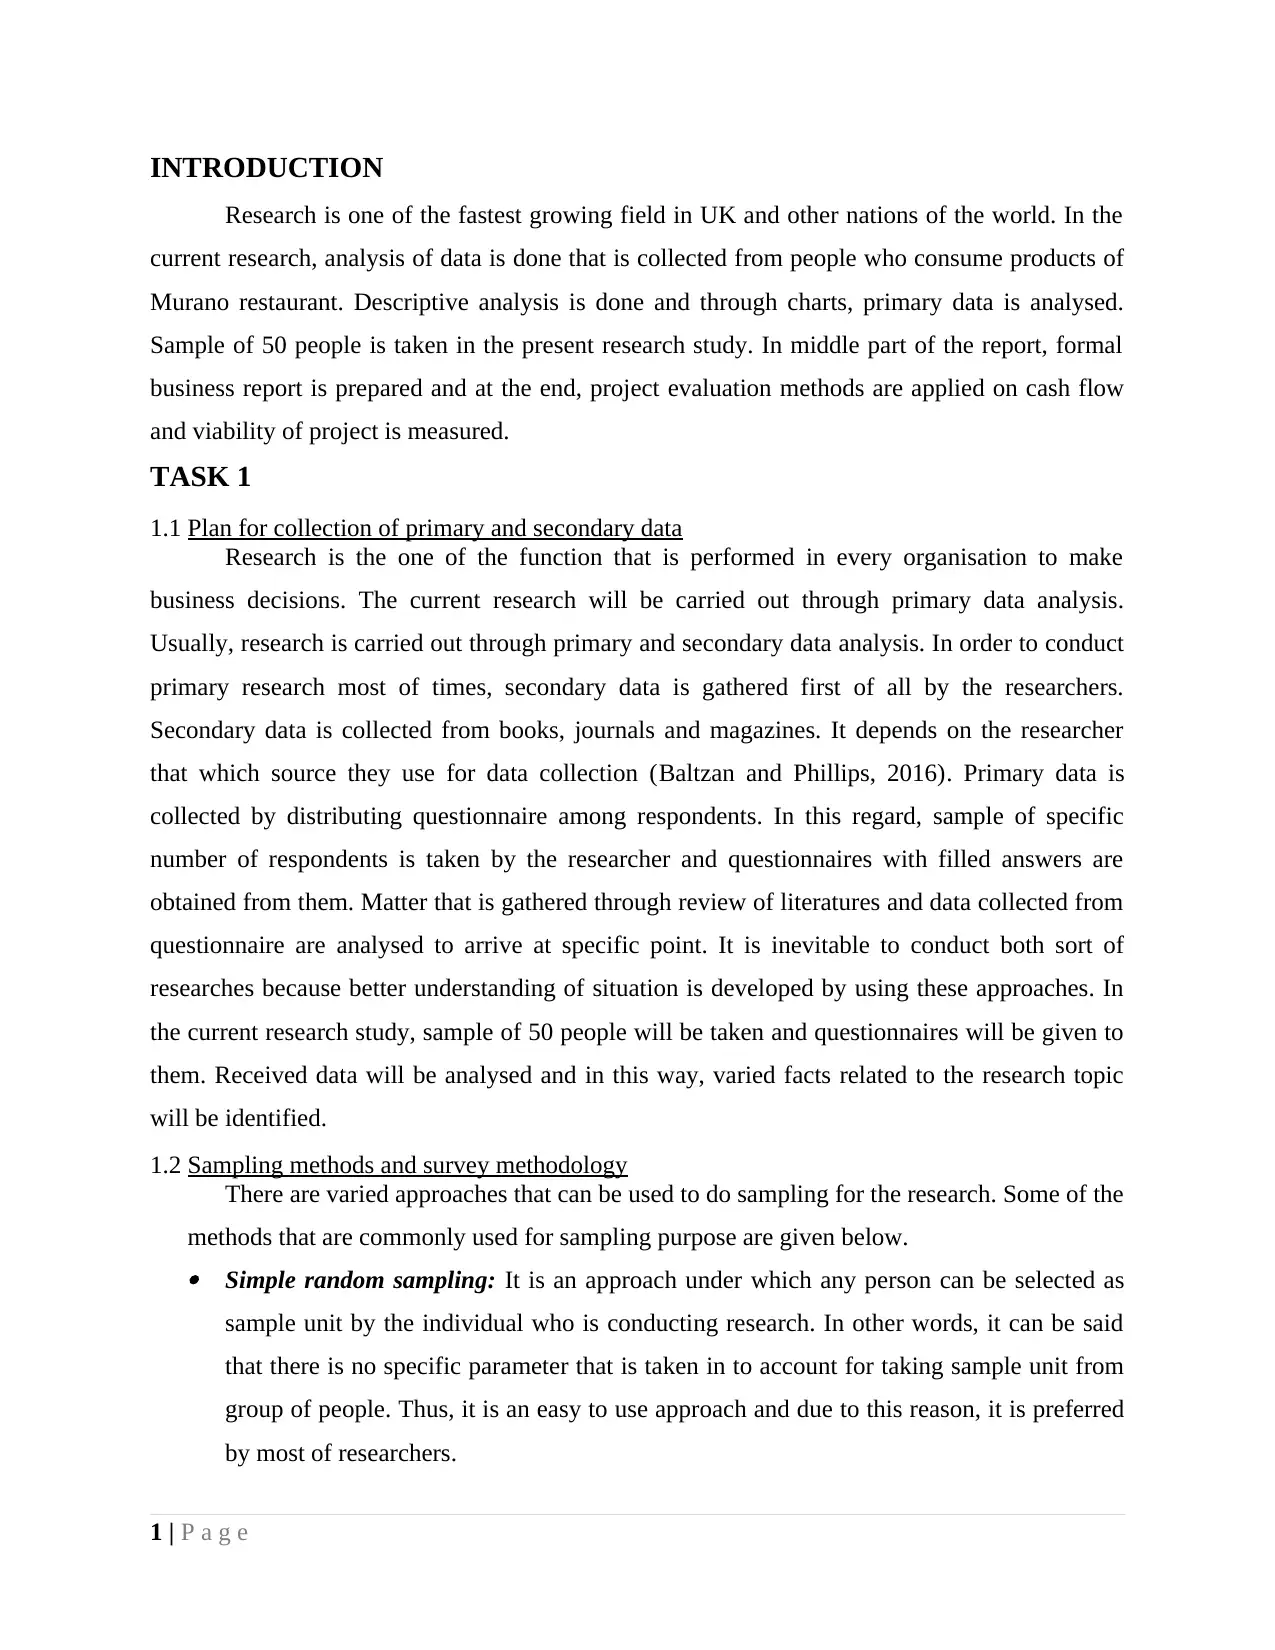
1.1 Plan for collection of primary and secondary data
Research is the one of the function that is performed in every organisation to make
business decisions. The current research will be carried out through primary data analysis.
Usually, research is carried out through primary and secondary data analysis. In order to conduct
primary research most of times, secondary data is gathered first of all by the researchers.
Secondary data is collected from books, journals and magazines. It depends on the researcher
that which source they use for data collection (Baltzan and Phillips, 2016). Primary data is
collected by distributing questionnaire among respondents. In this regard, sample of specific
number of respondents is taken by the researcher and questionnaires with filled answers are
obtained from them. Matter that is gathered through review of literatures and data collected from
questionnaire are analysed to arrive at specific point. It is inevitable to conduct both sort of
researches because better understanding of situation is developed by using these approaches. In
the current research study, sample of 50 people will be taken and questionnaires will be given to
them. Received data will be analysed and in this way, varied facts related to the research topic
will be identified.
1.2 Sampling methods and survey methodology
There are varied approaches that can be used to do sampling for the research. Some of the
methods that are commonly used for sampling purpose are given below. Simple random sampling: It is an approach under which any person can be selected as
sample unit by the individual who is conducting research. In other words, it can be said
that there is no specific parameter that is taken in to account for taking sample unit from
group of people. Thus, it is an easy to use approach and due to this reason, it is preferred
by most of researchers.
1 | P a g e
Research is one of the fastest growing field in UK and other nations of the world. In the
current research, analysis of data is done that is collected from people who consume products of
Murano restaurant. Descriptive analysis is done and through charts, primary data is analysed.
Sample of 50 people is taken in the present research study. In middle part of the report, formal
business report is prepared and at the end, project evaluation methods are applied on cash flow
and viability of project is measured.
TASK 1
1.1 Plan for collection of primary and secondary data
Research is the one of the function that is performed in every organisation to make
business decisions. The current research will be carried out through primary data analysis.
Usually, research is carried out through primary and secondary data analysis. In order to conduct
primary research most of times, secondary data is gathered first of all by the researchers.
Secondary data is collected from books, journals and magazines. It depends on the researcher
that which source they use for data collection (Baltzan and Phillips, 2016). Primary data is
collected by distributing questionnaire among respondents. In this regard, sample of specific
number of respondents is taken by the researcher and questionnaires with filled answers are
obtained from them. Matter that is gathered through review of literatures and data collected from
questionnaire are analysed to arrive at specific point. It is inevitable to conduct both sort of
researches because better understanding of situation is developed by using these approaches. In
the current research study, sample of 50 people will be taken and questionnaires will be given to
them. Received data will be analysed and in this way, varied facts related to the research topic
will be identified.
1.2 Sampling methods and survey methodology
There are varied approaches that can be used to do sampling for the research. Some of the
methods that are commonly used for sampling purpose are given below. Simple random sampling: It is an approach under which any person can be selected as
sample unit by the individual who is conducting research. In other words, it can be said
that there is no specific parameter that is taken in to account for taking sample unit from
group of people. Thus, it is an easy to use approach and due to this reason, it is preferred
by most of researchers.
1 | P a g e
Paraphrase This Document
Need a fresh take? Get an instant paraphrase of this document with our AI Paraphraser
Stratified sampling: It is another approach under which population is classified in to
varied segments and from this respondents are taken by the researcher. This approach
best fit to the research requirement especially when data need to be gathered from
different sort of people. Cluster sampling: It is the method under which from particular location, sample units are
taken and that location is classified into varied parts (Canhoto and Dibb, 2016). Like
stratified sampling method in cluster sampling also sample units are taken from varied
segments. Hence, it can be said that there is significant importance of the cluster
sampling for researcher. Convenience sampling: Convenience sampling is the method where according to
convenience sample units are taken from the population. This method is almost similar to
the simple random sampling method.
1.3 Questionnaire for research
Name...
Age....
1. In your view, on an average how many times do you visit Murano restaurant?
One time ( )
Twice ( )
Thrice ( )
More than thrice ( )
2. Most of people think that Murano restaurant is offering the best quality of service to the
customers. Do you completely agree with asked statement?
Strongly agree ( )
Agree ( )
Neutral ( )
Disagree ( )
Strongly disagree ( )
3. Are dining facilities excellent at our restaurant in comparison to rivals?
Strongly agree ( )
Agree ( )
Neutral ( )
2 | P a g e
Disagree ( )
Strongly disagree ( )
4. There are some of the factors that are taken into account for selecting restaurant by individuals
for taking lunch or dinner. Which of below given factors you give due importance while
choosing any restaurant for lunch or dinner purpose?
Internal appearance of restaurant ( )
Portfolio of wide variety of dishes ( )
Word of mouth marketing of restaurant among people ( )
5. Interior and product portfolio size both collectively work together in creating new customers
in the business?
Yes ( )
No ( )
6. Which sort of dishes you most of time prefer to eat in our restaurant?
Spicy ( )
Less spicy ( )
Other than spicy and less spicy ( )
7. There is time punctuality among employees of Murano restaurant in respect to serving
customers in the restaurant. Do you agree?
Strongly agree ( )
Agree ( )
Neutral ( )
Disagree ( )
Strongly disagree ( )
8. There are some of the areas where employees of Murano restaurant need to work in order to
improve their performance?
Strongly agree ( )
Agree ( )
Neutral ( )
Disagree ( )
Strongly disagree ( )
9. Edible items are available at fair price at Murano restaurant. Do you agree with this fact?
3 | P a g e
Strongly disagree ( )
4. There are some of the factors that are taken into account for selecting restaurant by individuals
for taking lunch or dinner. Which of below given factors you give due importance while
choosing any restaurant for lunch or dinner purpose?
Internal appearance of restaurant ( )
Portfolio of wide variety of dishes ( )
Word of mouth marketing of restaurant among people ( )
5. Interior and product portfolio size both collectively work together in creating new customers
in the business?
Yes ( )
No ( )
6. Which sort of dishes you most of time prefer to eat in our restaurant?
Spicy ( )
Less spicy ( )
Other than spicy and less spicy ( )
7. There is time punctuality among employees of Murano restaurant in respect to serving
customers in the restaurant. Do you agree?
Strongly agree ( )
Agree ( )
Neutral ( )
Disagree ( )
Strongly disagree ( )
8. There are some of the areas where employees of Murano restaurant need to work in order to
improve their performance?
Strongly agree ( )
Agree ( )
Neutral ( )
Disagree ( )
Strongly disagree ( )
9. Edible items are available at fair price at Murano restaurant. Do you agree with this fact?
3 | P a g e
⊘ This is a preview!⊘
Do you want full access?
Subscribe today to unlock all pages.
Trusted by 1+ million students worldwide
Strongly agree ( )
Agree ( )
Neutral ( )
Disagree ( )
Strongly disagree ( )
TASK 2
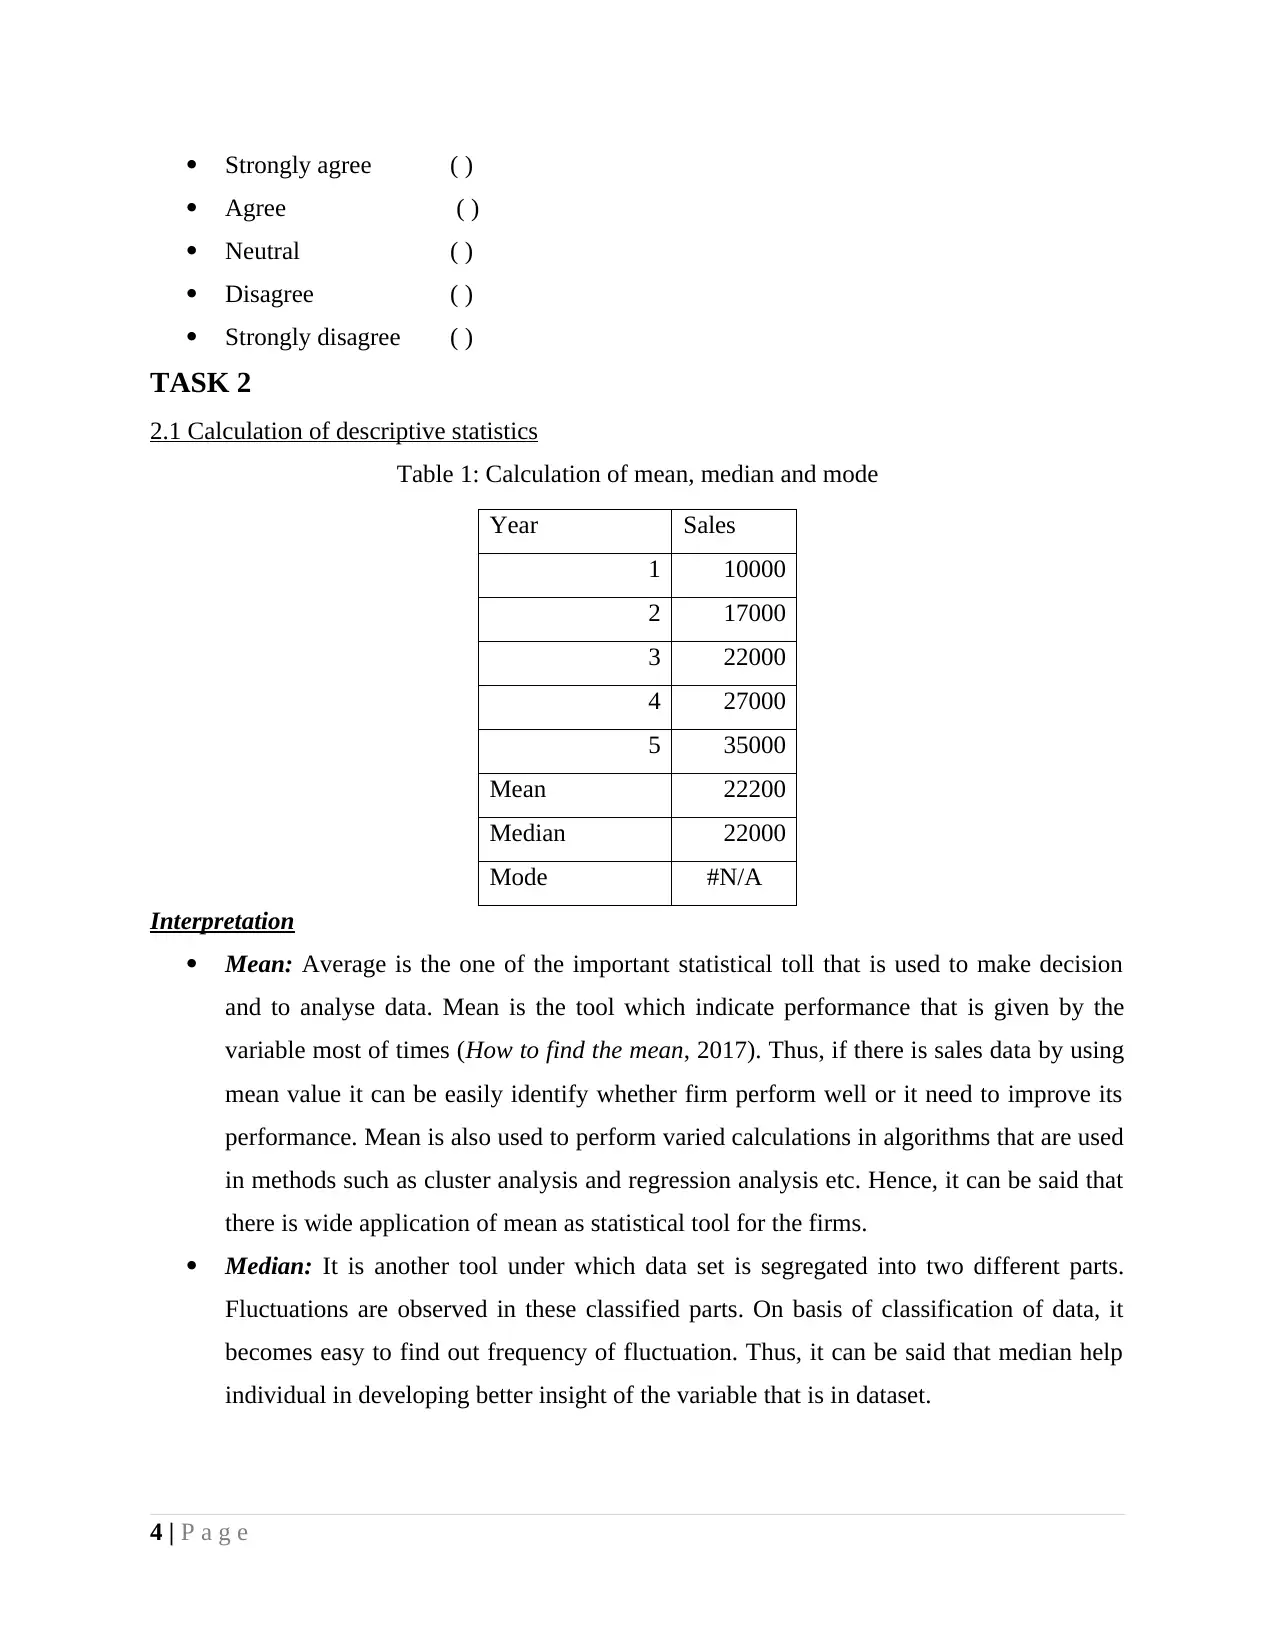
2.1 Calculation of descriptive statistics
Table 1: Calculation of mean, median and mode
Year Sales
1 10000
2 17000
3 22000
4 27000
5 35000
Mean 22200
Median 22000
Mode #N/A
Interpretation
Mean: Average is the one of the important statistical toll that is used to make decision
and to analyse data. Mean is the tool which indicate performance that is given by the
variable most of times (How to find the mean, 2017). Thus, if there is sales data by using
mean value it can be easily identify whether firm perform well or it need to improve its
performance. Mean is also used to perform varied calculations in algorithms that are used
in methods such as cluster analysis and regression analysis etc. Hence, it can be said that
there is wide application of mean as statistical tool for the firms.
Median: It is another tool under which data set is segregated into two different parts.
Fluctuations are observed in these classified parts. On basis of classification of data, it
becomes easy to find out frequency of fluctuation. Thus, it can be said that median help
individual in developing better insight of the variable that is in dataset.
4 | P a g e
Agree ( )
Neutral ( )
Disagree ( )
Strongly disagree ( )
TASK 2
2.1 Calculation of descriptive statistics
Table 1: Calculation of mean, median and mode
Year Sales
1 10000
2 17000
3 22000
4 27000
5 35000
Mean 22200
Median 22000
Mode #N/A
Interpretation
Mean: Average is the one of the important statistical toll that is used to make decision
and to analyse data. Mean is the tool which indicate performance that is given by the
variable most of times (How to find the mean, 2017). Thus, if there is sales data by using
mean value it can be easily identify whether firm perform well or it need to improve its
performance. Mean is also used to perform varied calculations in algorithms that are used
in methods such as cluster analysis and regression analysis etc. Hence, it can be said that
there is wide application of mean as statistical tool for the firms.
Median: It is another tool under which data set is segregated into two different parts.
Fluctuations are observed in these classified parts. On basis of classification of data, it
becomes easy to find out frequency of fluctuation. Thus, it can be said that median help
individual in developing better insight of the variable that is in dataset.
4 | P a g e
Paraphrase This Document
Need a fresh take? Get an instant paraphrase of this document with our AI Paraphraser
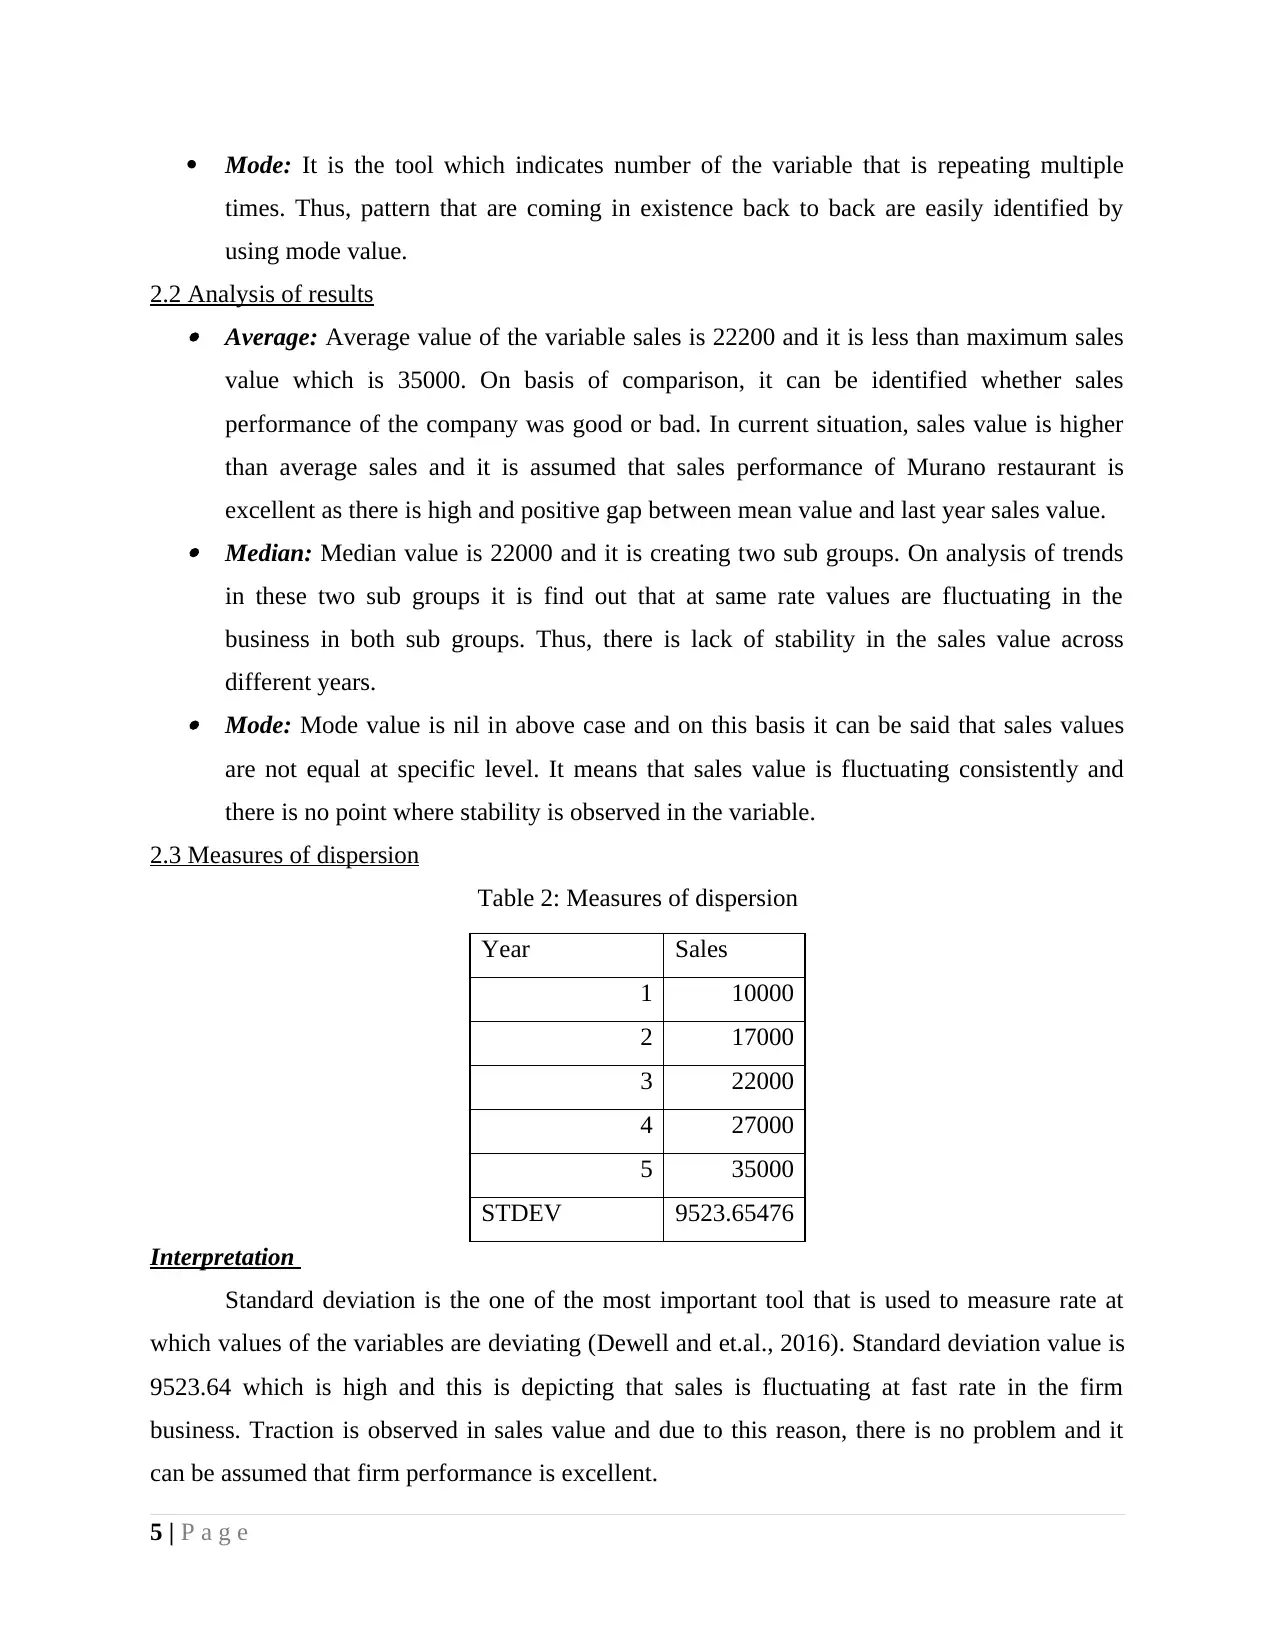
Mode: It is the tool which indicates number of the variable that is repeating multiple
times. Thus, pattern that are coming in existence back to back are easily identified by
using mode value.
2.2 Analysis of results Average: Average value of the variable sales is 22200 and it is less than maximum sales
value which is 35000. On basis of comparison, it can be identified whether sales
performance of the company was good or bad. In current situation, sales value is higher
than average sales and it is assumed that sales performance of Murano restaurant is
excellent as there is high and positive gap between mean value and last year sales value. Median: Median value is 22000 and it is creating two sub groups. On analysis of trends
in these two sub groups it is find out that at same rate values are fluctuating in the
business in both sub groups. Thus, there is lack of stability in the sales value across
different years. Mode: Mode value is nil in above case and on this basis it can be said that sales values
are not equal at specific level. It means that sales value is fluctuating consistently and
there is no point where stability is observed in the variable.
2.3 Measures of dispersion
Table 2: Measures of dispersion
Year Sales
1 10000
2 17000
3 22000
4 27000
5 35000
STDEV 9523.65476
Interpretation
Standard deviation is the one of the most important tool that is used to measure rate at
which values of the variables are deviating (Dewell and et.al., 2016). Standard deviation value is
9523.64 which is high and this is depicting that sales is fluctuating at fast rate in the firm
business. Traction is observed in sales value and due to this reason, there is no problem and it
can be assumed that firm performance is excellent.
5 | P a g e
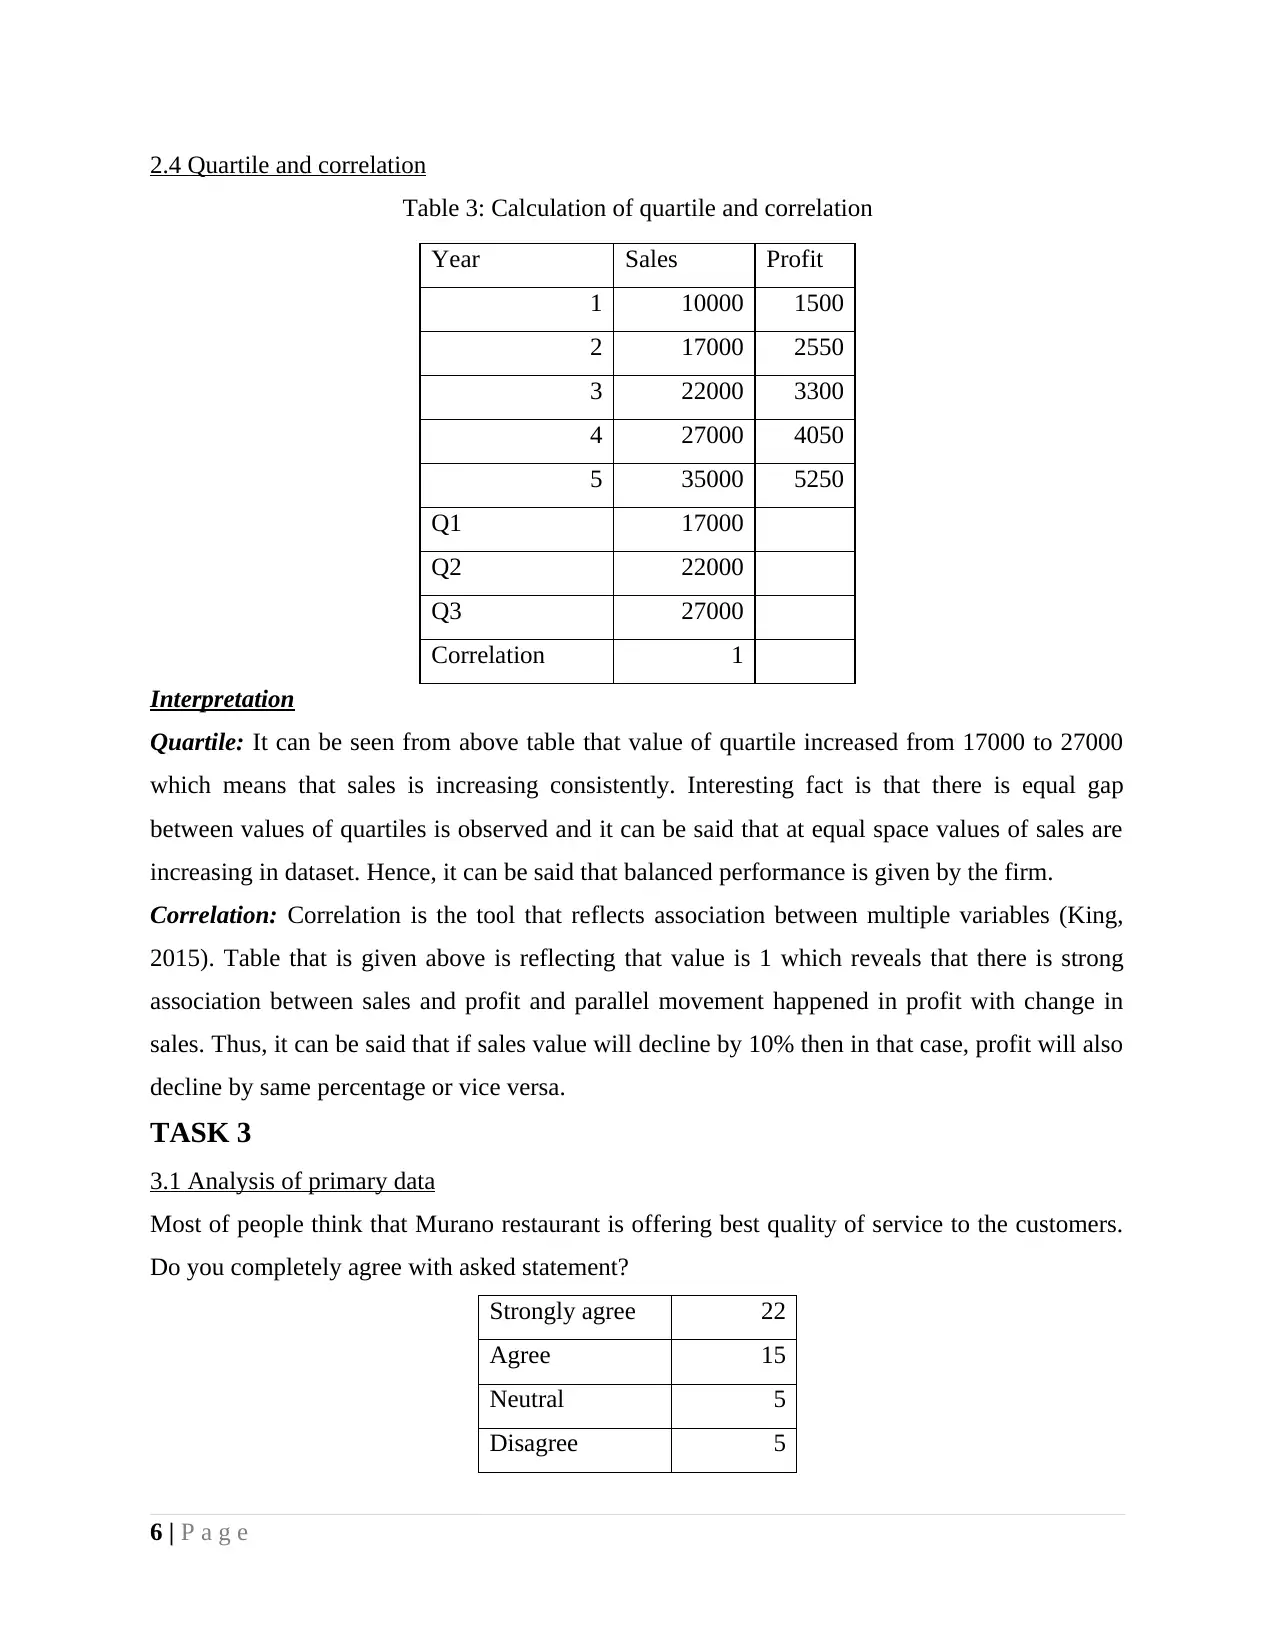
2.4 Quartile and correlation
Table 3: Calculation of quartile and correlation
Year Sales Profit
1 10000 1500
2 17000 2550
3 22000 3300
4 27000 4050
5 35000 5250
Q1 17000
Q2 22000
Q3 27000
Correlation 1
Interpretation
Quartile: It can be seen from above table that value of quartile increased from 17000 to 27000
which means that sales is increasing consistently. Interesting fact is that there is equal gap
between values of quartiles is observed and it can be said that at equal space values of sales are
increasing in dataset. Hence, it can be said that balanced performance is given by the firm.
Correlation: Correlation is the tool that reflects association between multiple variables (King,
2015). Table that is given above is reflecting that value is 1 which reveals that there is strong
association between sales and profit and parallel movement happened in profit with change in
sales. Thus, it can be said that if sales value will decline by 10% then in that case, profit will also
decline by same percentage or vice versa.
TASK 3
3.1 Analysis of primary data
Most of people think that Murano restaurant is offering best quality of service to the customers.
Do you completely agree with asked statement?
Strongly agree 22
Agree 15
Neutral 5
Disagree 5
6 | P a g e
⊘ This is a preview!⊘
Do you want full access?
Subscribe today to unlock all pages.
Trusted by 1+ million students worldwide
Strongly
disagree 3
Total 50
Strongly agree Agree Neutral Disagree Strongly
disagree
0
2
4
6
8
10
12
14
16 15 15
5
9
6
Chart Title
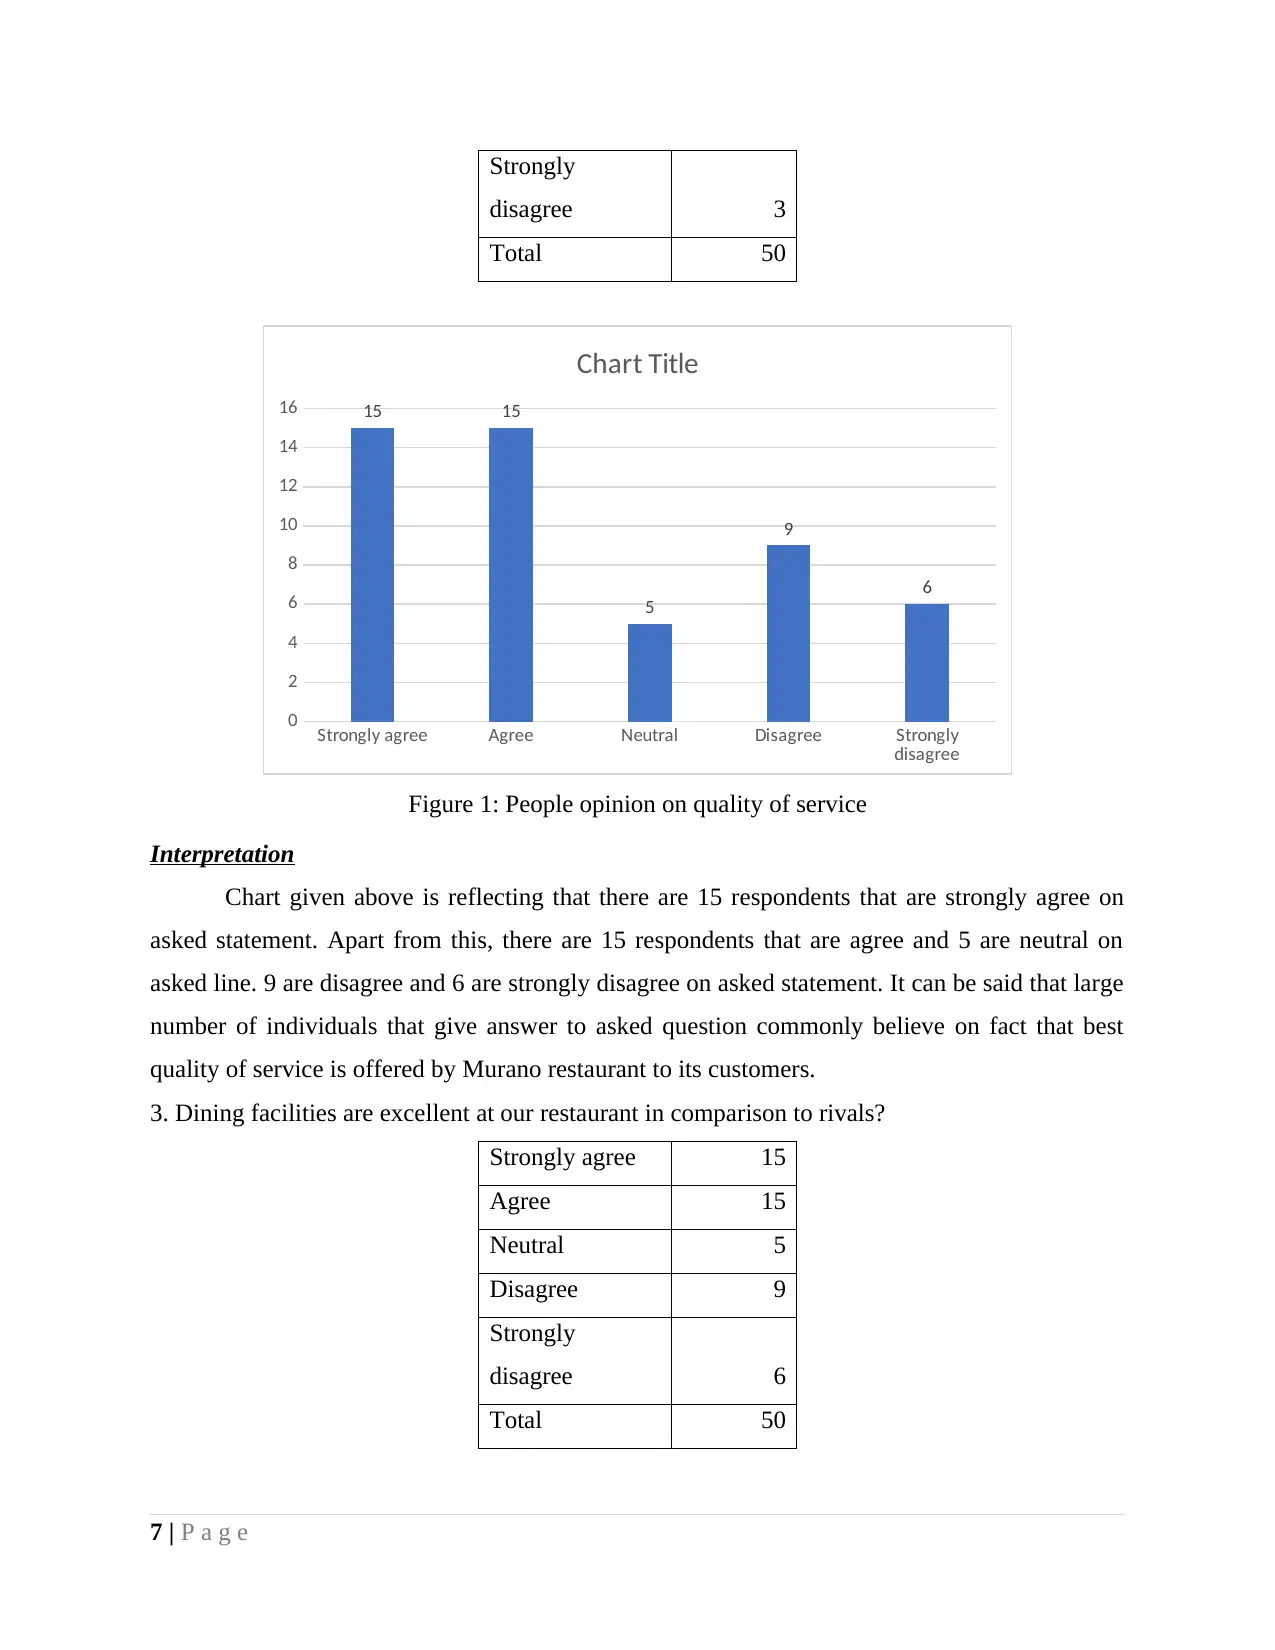
Figure 1: People opinion on quality of service
Interpretation
Chart given above is reflecting that there are 15 respondents that are strongly agree on
asked statement. Apart from this, there are 15 respondents that are agree and 5 are neutral on
asked line. 9 are disagree and 6 are strongly disagree on asked statement. It can be said that large
number of individuals that give answer to asked question commonly believe on fact that best
quality of service is offered by Murano restaurant to its customers.
3. Dining facilities are excellent at our restaurant in comparison to rivals?
Strongly agree 15
Agree 15
Neutral 5
Disagree 9
Strongly
disagree 6
Total 50
7 | P a g e
disagree 3
Total 50
Strongly agree Agree Neutral Disagree Strongly
disagree
0
2
4
6
8
10
12
14
16 15 15
5
9
6
Chart Title
Figure 1: People opinion on quality of service
Interpretation
Chart given above is reflecting that there are 15 respondents that are strongly agree on
asked statement. Apart from this, there are 15 respondents that are agree and 5 are neutral on
asked line. 9 are disagree and 6 are strongly disagree on asked statement. It can be said that large
number of individuals that give answer to asked question commonly believe on fact that best
quality of service is offered by Murano restaurant to its customers.
3. Dining facilities are excellent at our restaurant in comparison to rivals?
Strongly agree 15
Agree 15
Neutral 5
Disagree 9
Strongly
disagree 6
Total 50
7 | P a g e
Paraphrase This Document
Need a fresh take? Get an instant paraphrase of this document with our AI Paraphraser
Strongly agree Agree Neutral Disagree Strongly
disagree
0
2
4
6
8
10
12
14
16 15 15
5
9
6
Chart Title
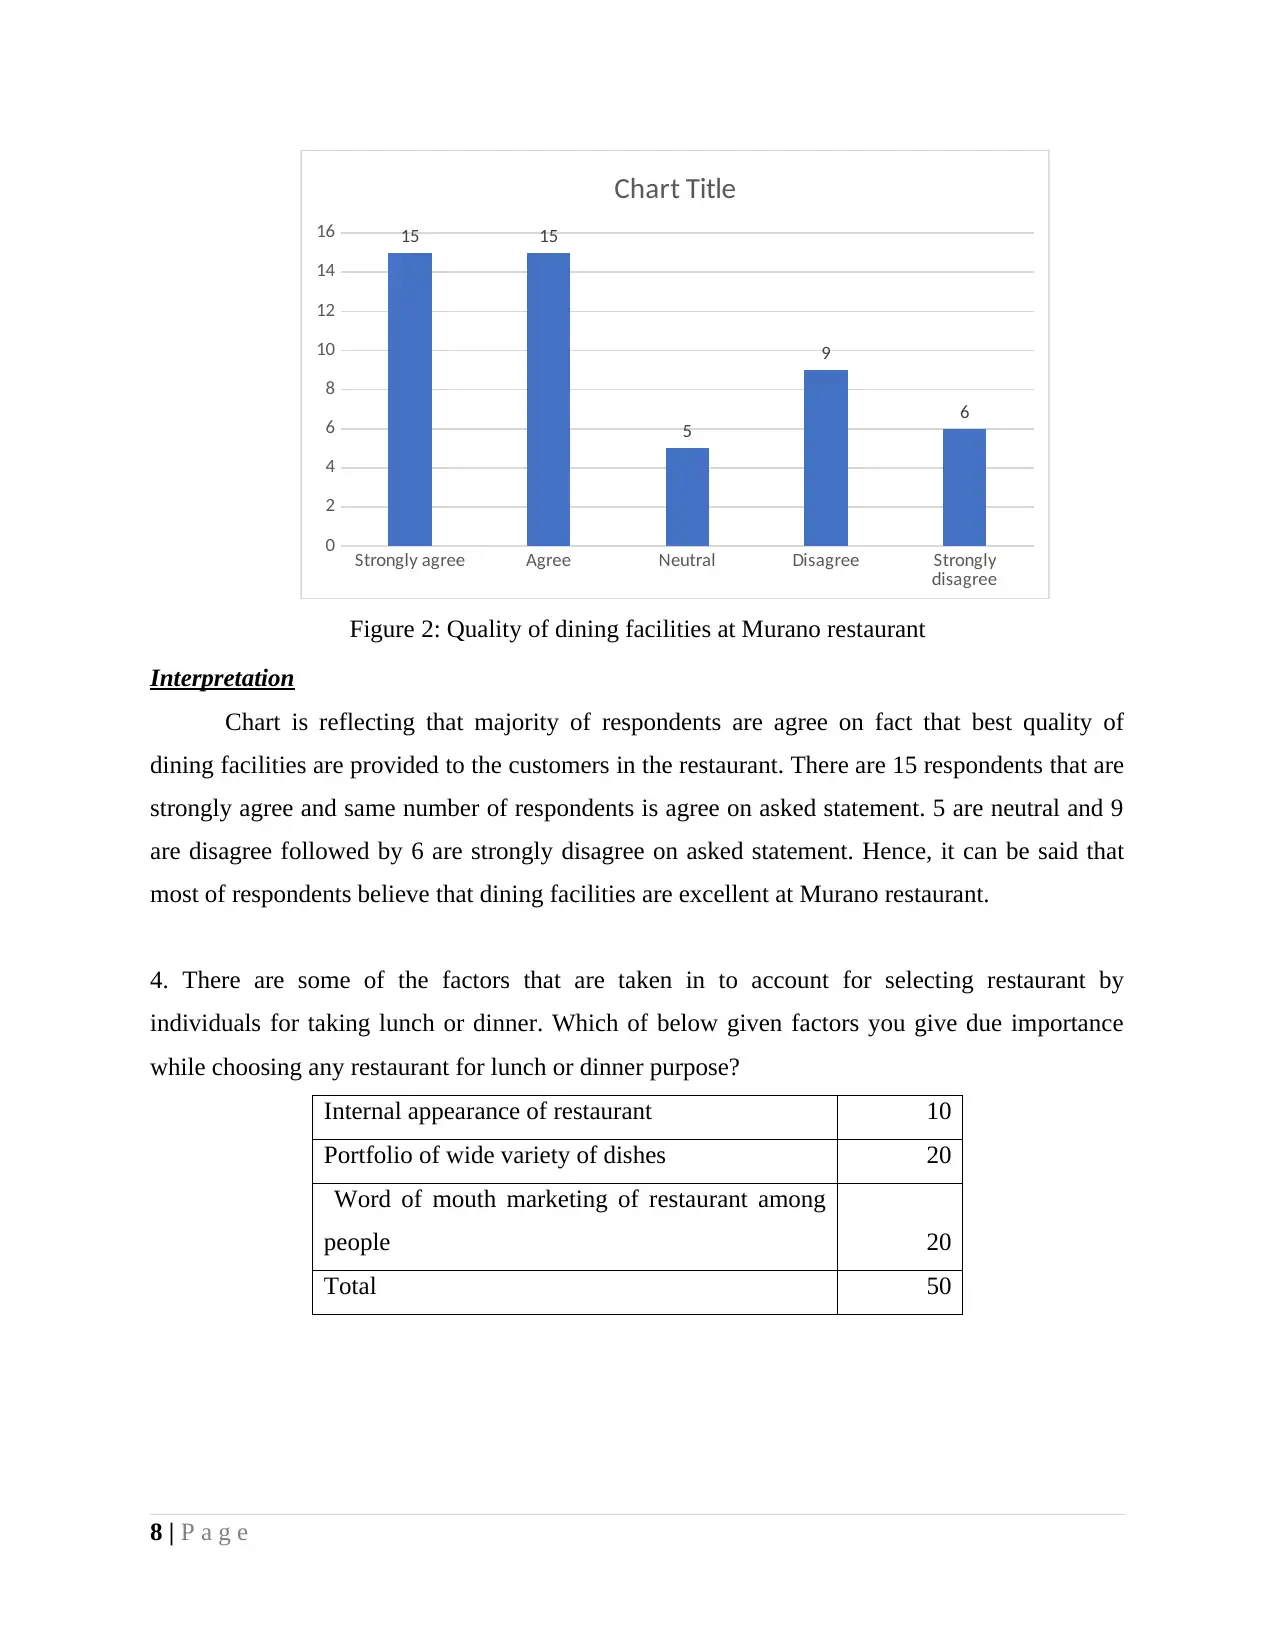
Figure 2: Quality of dining facilities at Murano restaurant
Interpretation
Chart is reflecting that majority of respondents are agree on fact that best quality of
dining facilities are provided to the customers in the restaurant. There are 15 respondents that are
strongly agree and same number of respondents is agree on asked statement. 5 are neutral and 9
are disagree followed by 6 are strongly disagree on asked statement. Hence, it can be said that
most of respondents believe that dining facilities are excellent at Murano restaurant.
4. There are some of the factors that are taken in to account for selecting restaurant by
individuals for taking lunch or dinner. Which of below given factors you give due importance
while choosing any restaurant for lunch or dinner purpose?
Internal appearance of restaurant 10
Portfolio of wide variety of dishes 20
Word of mouth marketing of restaurant among
people 20
Total 50
8 | P a g e
disagree
0
2
4
6
8
10
12
14
16 15 15
5
9
6
Chart Title
Figure 2: Quality of dining facilities at Murano restaurant
Interpretation
Chart is reflecting that majority of respondents are agree on fact that best quality of
dining facilities are provided to the customers in the restaurant. There are 15 respondents that are
strongly agree and same number of respondents is agree on asked statement. 5 are neutral and 9
are disagree followed by 6 are strongly disagree on asked statement. Hence, it can be said that
most of respondents believe that dining facilities are excellent at Murano restaurant.
4. There are some of the factors that are taken in to account for selecting restaurant by
individuals for taking lunch or dinner. Which of below given factors you give due importance
while choosing any restaurant for lunch or dinner purpose?
Internal appearance of restaurant 10
Portfolio of wide variety of dishes 20
Word of mouth marketing of restaurant among
people 20
Total 50
8 | P a g e
10
20
20
Chart Title
Internal appearance of restaurant
Portfolio of wide variety of dishes
Word of mouth marketing of restaurant among people
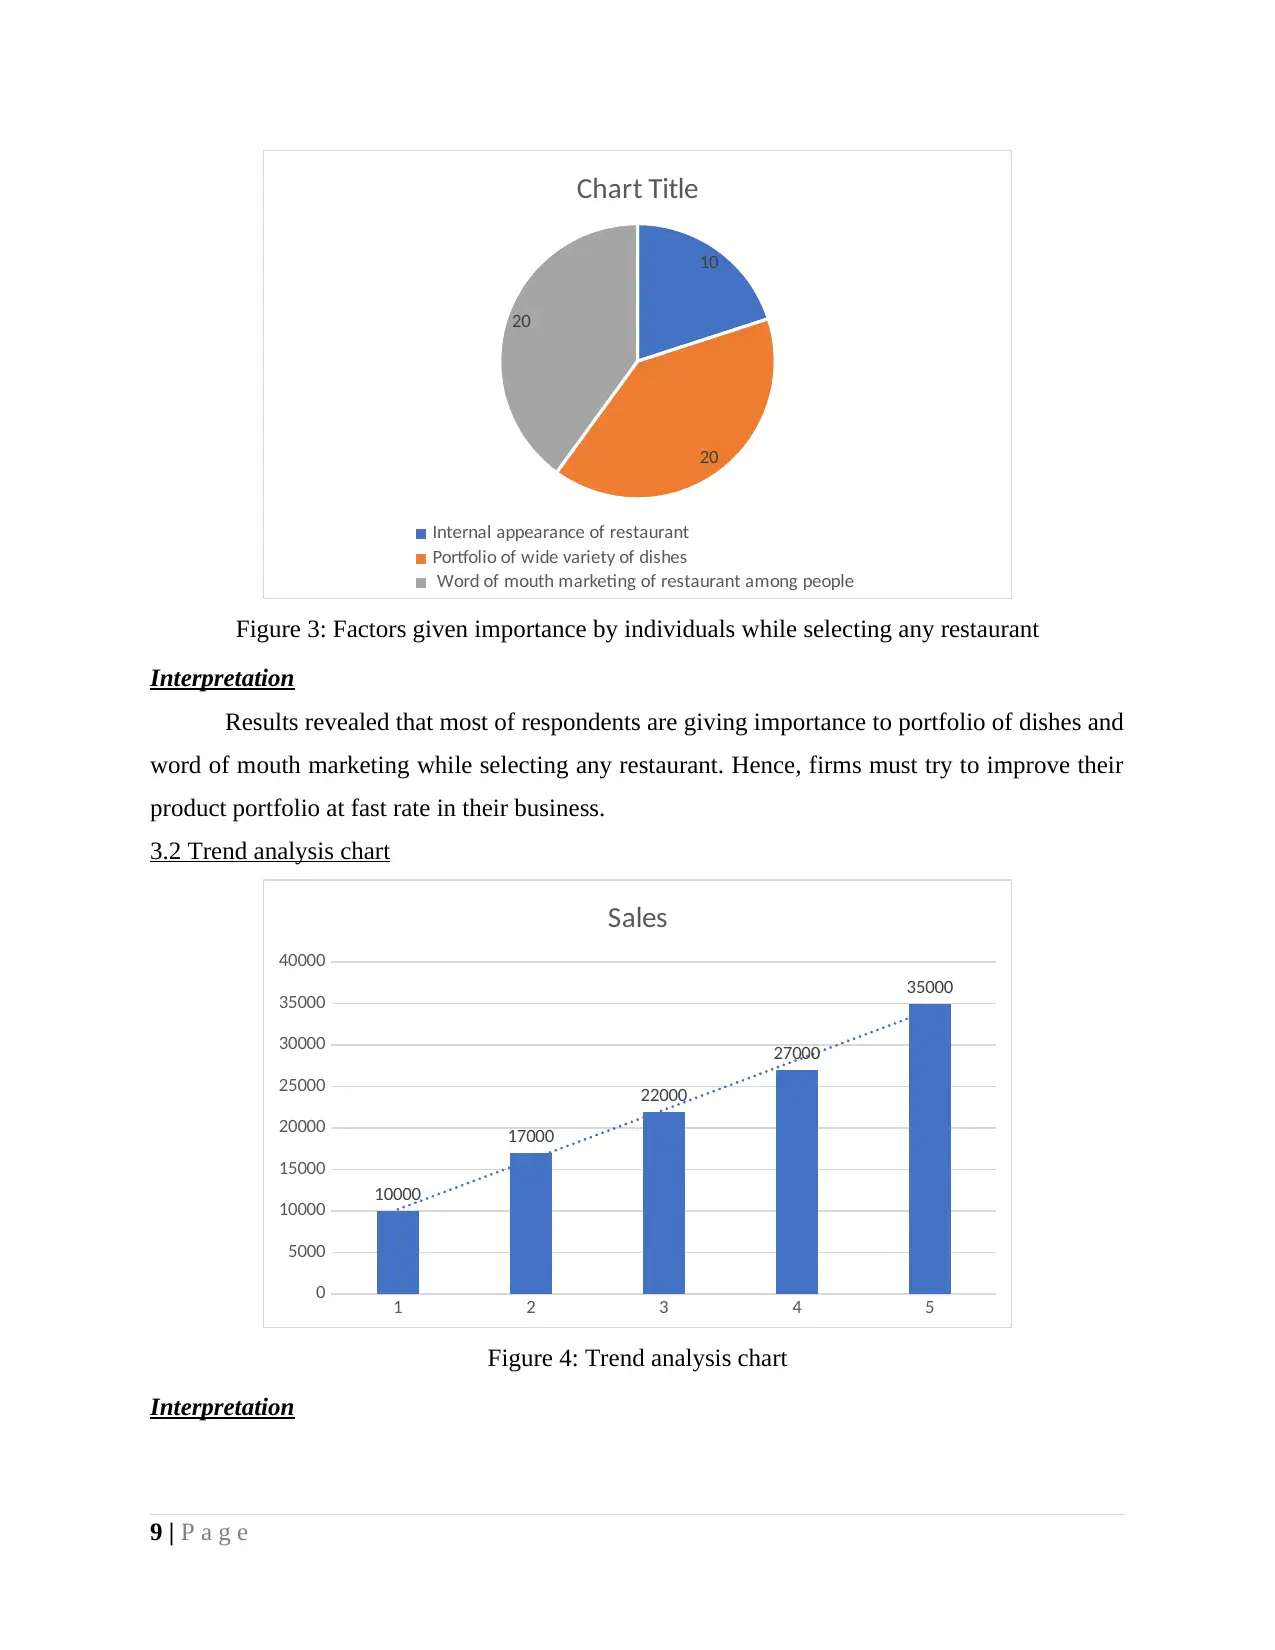
Figure 3: Factors given importance by individuals while selecting any restaurant
Interpretation
Results revealed that most of respondents are giving importance to portfolio of dishes and
word of mouth marketing while selecting any restaurant. Hence, firms must try to improve their
product portfolio at fast rate in their business.
3.2 Trend analysis chart
1 2 3 4 5
0
5000
10000
15000
20000
25000
30000
35000
40000
10000
17000
22000
27000
35000
Sales
Figure 4: Trend analysis chart
Interpretation
9 | P a g e
20
20
Chart Title
Internal appearance of restaurant
Portfolio of wide variety of dishes
Word of mouth marketing of restaurant among people
Figure 3: Factors given importance by individuals while selecting any restaurant
Interpretation
Results revealed that most of respondents are giving importance to portfolio of dishes and
word of mouth marketing while selecting any restaurant. Hence, firms must try to improve their
product portfolio at fast rate in their business.
3.2 Trend analysis chart
1 2 3 4 5
0
5000
10000
15000
20000
25000
30000
35000
40000
10000
17000
22000
27000
35000
Sales
Figure 4: Trend analysis chart
Interpretation
9 | P a g e
⊘ This is a preview!⊘
Do you want full access?
Subscribe today to unlock all pages.
Trusted by 1+ million students worldwide
1 out of 19
Related Documents


Your All-in-One AI-Powered Toolkit for Academic Success.
+13062052269
info@desklib.com
Available 24*7 on WhatsApp / Email
![[object Object]](/_next/static/media/star-bottom.7253800d.svg)
Unlock your academic potential
Copyright © 2020–2026 A2Z Services. All Rights Reserved. Developed and managed by ZUCOL.