Analysis of Customer Behavior Towards Online Shopping Platforms
VerifiedAdded on 2022/12/20
|14
|2367
|43
Report
AI Summary
This report presents an analysis of customer behavior within an online shopping context. The study examines various aspects, including the time customers spend browsing web pages, their attitudes towards the website, their spending habits, and the relationship between age and website usage. Data was collected from a sample of 50 participants, with equal representation of genders. Statistical tests, such as independent sample t-tests and regression analysis, were employed to evaluate the formulated hypotheses. The findings indicate a significant difference in time spent on web pages between high and low spenders, but no significant correlation between attitude and spending, nor any significant spending differences between genders or a correlation between age and time spent. The study utilizes a pilot study sampling strategy and a quantitative data analysis method to test the hypotheses and draw conclusions regarding customer behavior in online retail.
Running head: INVESTING METHOD
Investing Method
Name of the Student
Name of the University
Course ID
Investing Method
Name of the Student
Name of the University
Course ID
Paraphrase This Document
Need a fresh take? Get an instant paraphrase of this document with our AI Paraphraser
1INVESTING METHOD
Table of Contents
Question 1........................................................................................................................................2
Hypothesis a.................................................................................................................................2
Hypothesis b................................................................................................................................2
Hypothesis d................................................................................................................................3
Question 2........................................................................................................................................3
Descriptive statistics....................................................................................................................3
Question 3........................................................................................................................................4
List of statistical test....................................................................................................................4
Question 4........................................................................................................................................5
Result of Hypothesis a.................................................................................................................5
Result of Hypothesis b.................................................................................................................6
Result of Hypothesis c.................................................................................................................7
Result of Hypothesis d.................................................................................................................7
Question 5........................................................................................................................................8
Result Analysis............................................................................................................................8
Title: Evaluation of customers’ behavior towards online shopping..............................................10
Abstract..........................................................................................................................................10
Sampling strategy..........................................................................................................................10
Method of the study.......................................................................................................................11
References......................................................................................................................................13
2INVESTING METHOD
Question 1
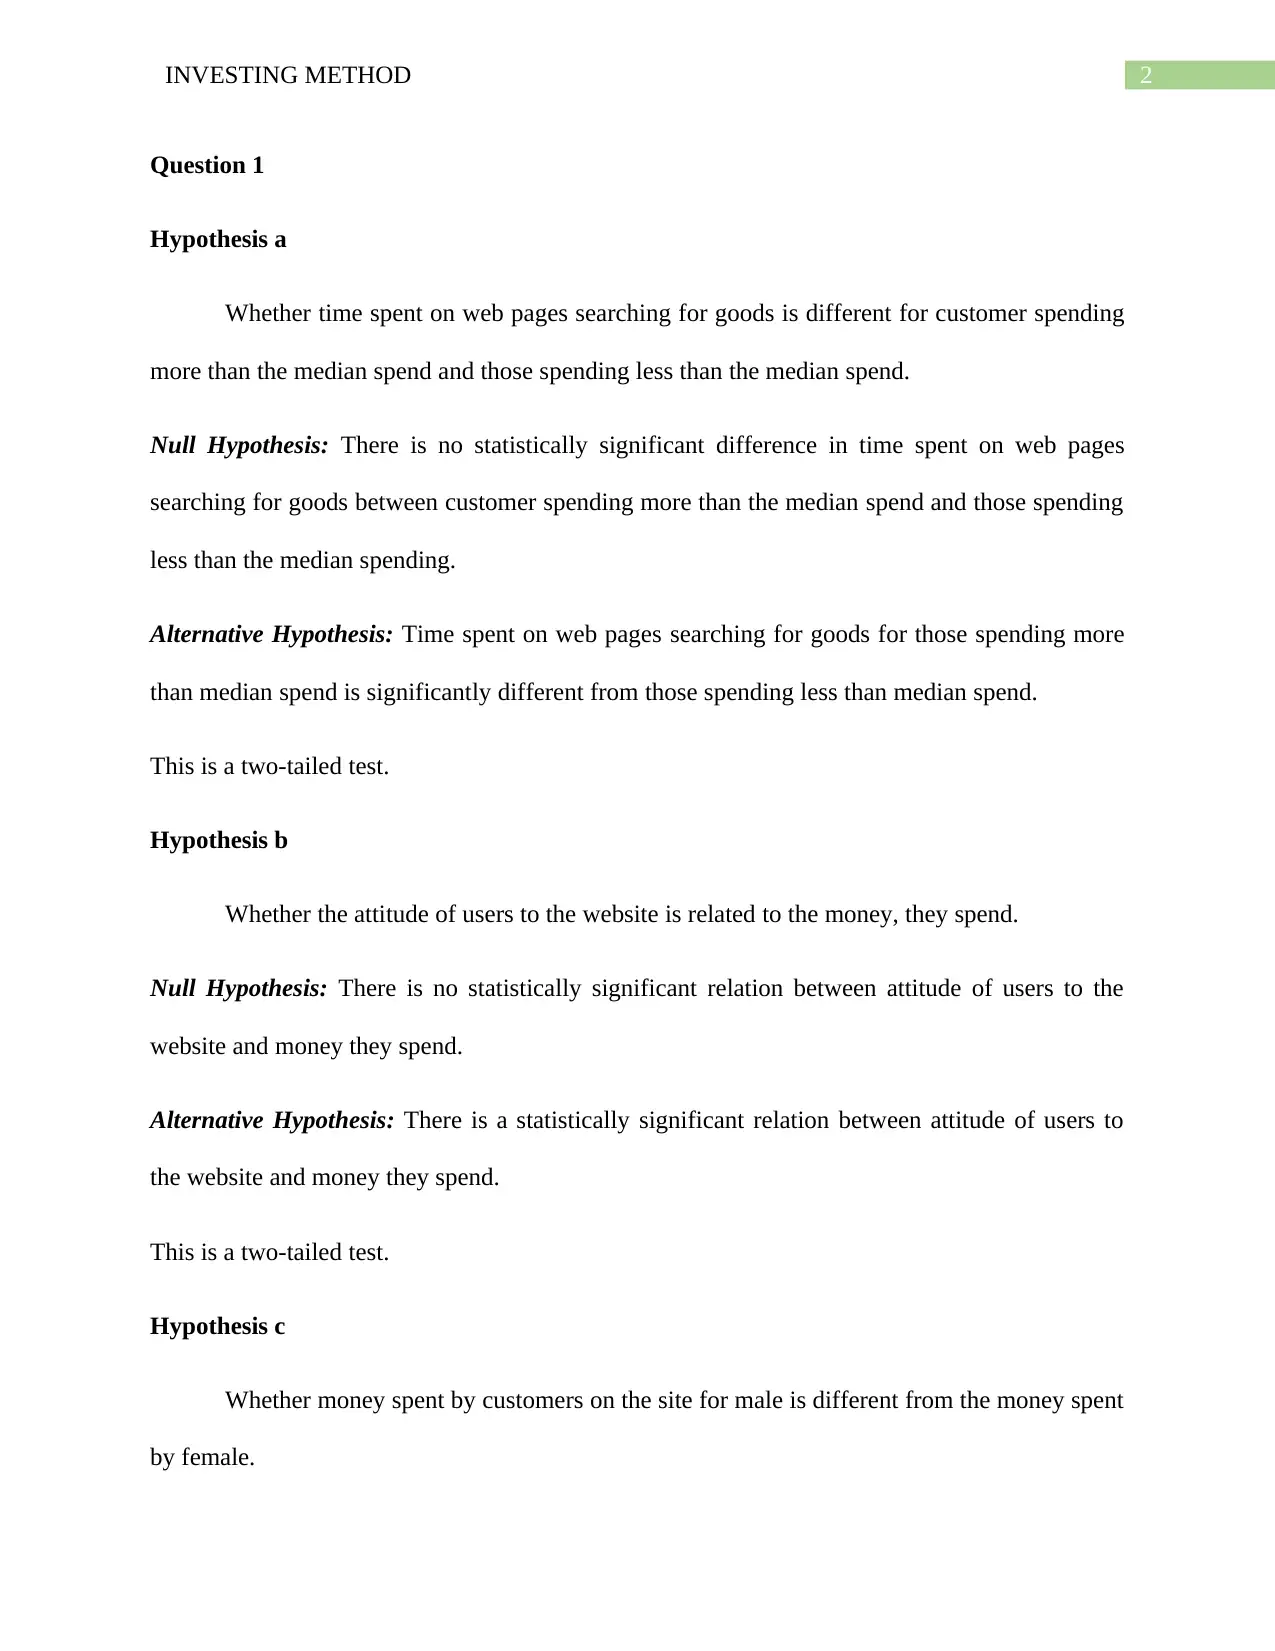
Hypothesis a
Whether time spent on web pages searching for goods is different for customer spending
more than the median spend and those spending less than the median spend.
Null Hypothesis: There is no statistically significant difference in time spent on web pages
searching for goods between customer spending more than the median spend and those spending
less than the median spending.
Alternative Hypothesis: Time spent on web pages searching for goods for those spending more
than median spend is significantly different from those spending less than median spend.
This is a two-tailed test.
Hypothesis b
Whether the attitude of users to the website is related to the money, they spend.
Null Hypothesis: There is no statistically significant relation between attitude of users to the
website and money they spend.
Alternative Hypothesis: There is a statistically significant relation between attitude of users to
the website and money they spend.
This is a two-tailed test.
Hypothesis c
Whether money spent by customers on the site for male is different from the money spent
by female.
Question 1
Hypothesis a
Whether time spent on web pages searching for goods is different for customer spending
more than the median spend and those spending less than the median spend.
Null Hypothesis: There is no statistically significant difference in time spent on web pages
searching for goods between customer spending more than the median spend and those spending
less than the median spending.
Alternative Hypothesis: Time spent on web pages searching for goods for those spending more
than median spend is significantly different from those spending less than median spend.
This is a two-tailed test.
Hypothesis b
Whether the attitude of users to the website is related to the money, they spend.
Null Hypothesis: There is no statistically significant relation between attitude of users to the
website and money they spend.
Alternative Hypothesis: There is a statistically significant relation between attitude of users to
the website and money they spend.
This is a two-tailed test.
Hypothesis c
Whether money spent by customers on the site for male is different from the money spent
by female.
⊘ This is a preview!⊘
Do you want full access?
Subscribe today to unlock all pages.
Trusted by 1+ million students worldwide
3INVESTING METHOD
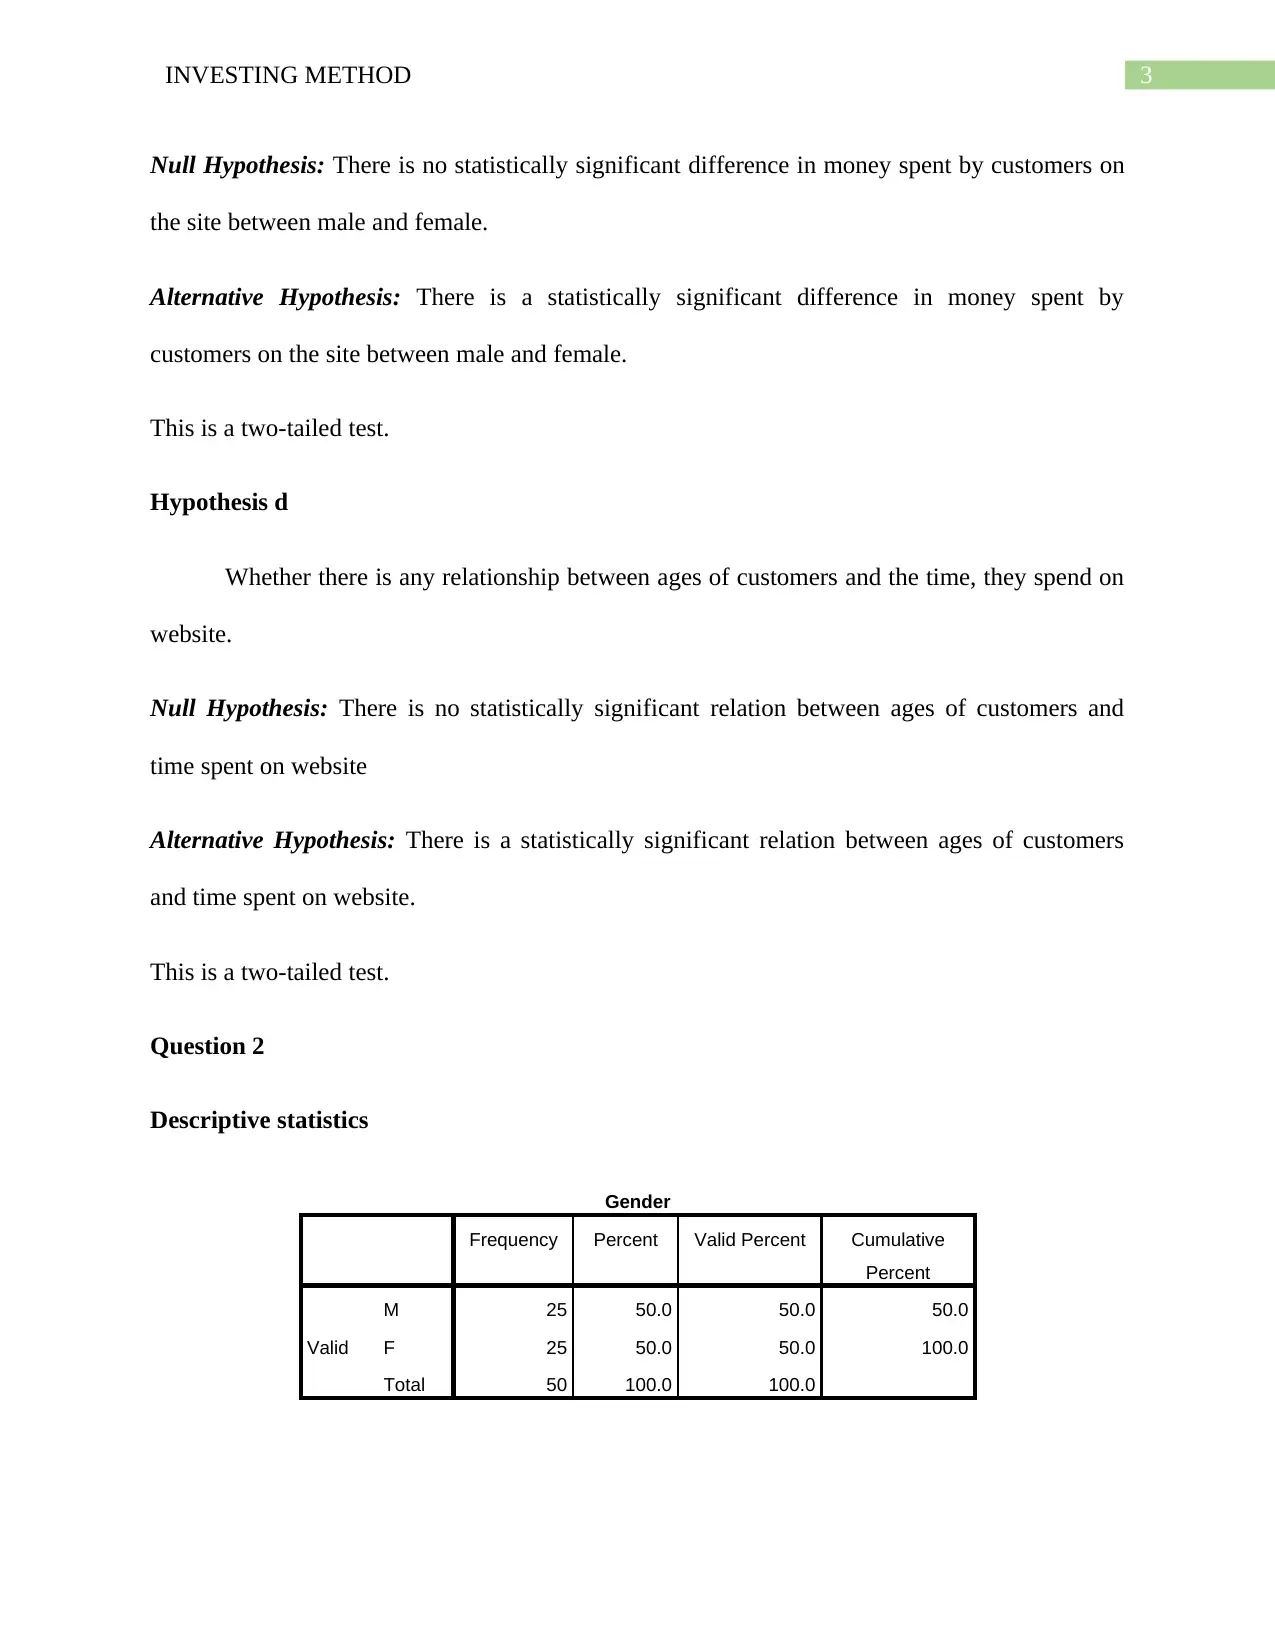
Null Hypothesis: There is no statistically significant difference in money spent by customers on
the site between male and female.
Alternative Hypothesis: There is a statistically significant difference in money spent by
customers on the site between male and female.
This is a two-tailed test.
Hypothesis d
Whether there is any relationship between ages of customers and the time, they spend on
website.
Null Hypothesis: There is no statistically significant relation between ages of customers and
time spent on website
Alternative Hypothesis: There is a statistically significant relation between ages of customers
and time spent on website.
This is a two-tailed test.
Question 2
Descriptive statistics
Gender
Frequency Percent Valid Percent Cumulative
Percent
Valid
M 25 50.0 50.0 50.0
F 25 50.0 50.0 100.0
Total 50 100.0 100.0
Paraphrase This Document
Need a fresh take? Get an instant paraphrase of this document with our AI Paraphraser
4INVESTING METHOD
Attitude
Frequency Percent Valid Percent Cumulative
Percent
Valid
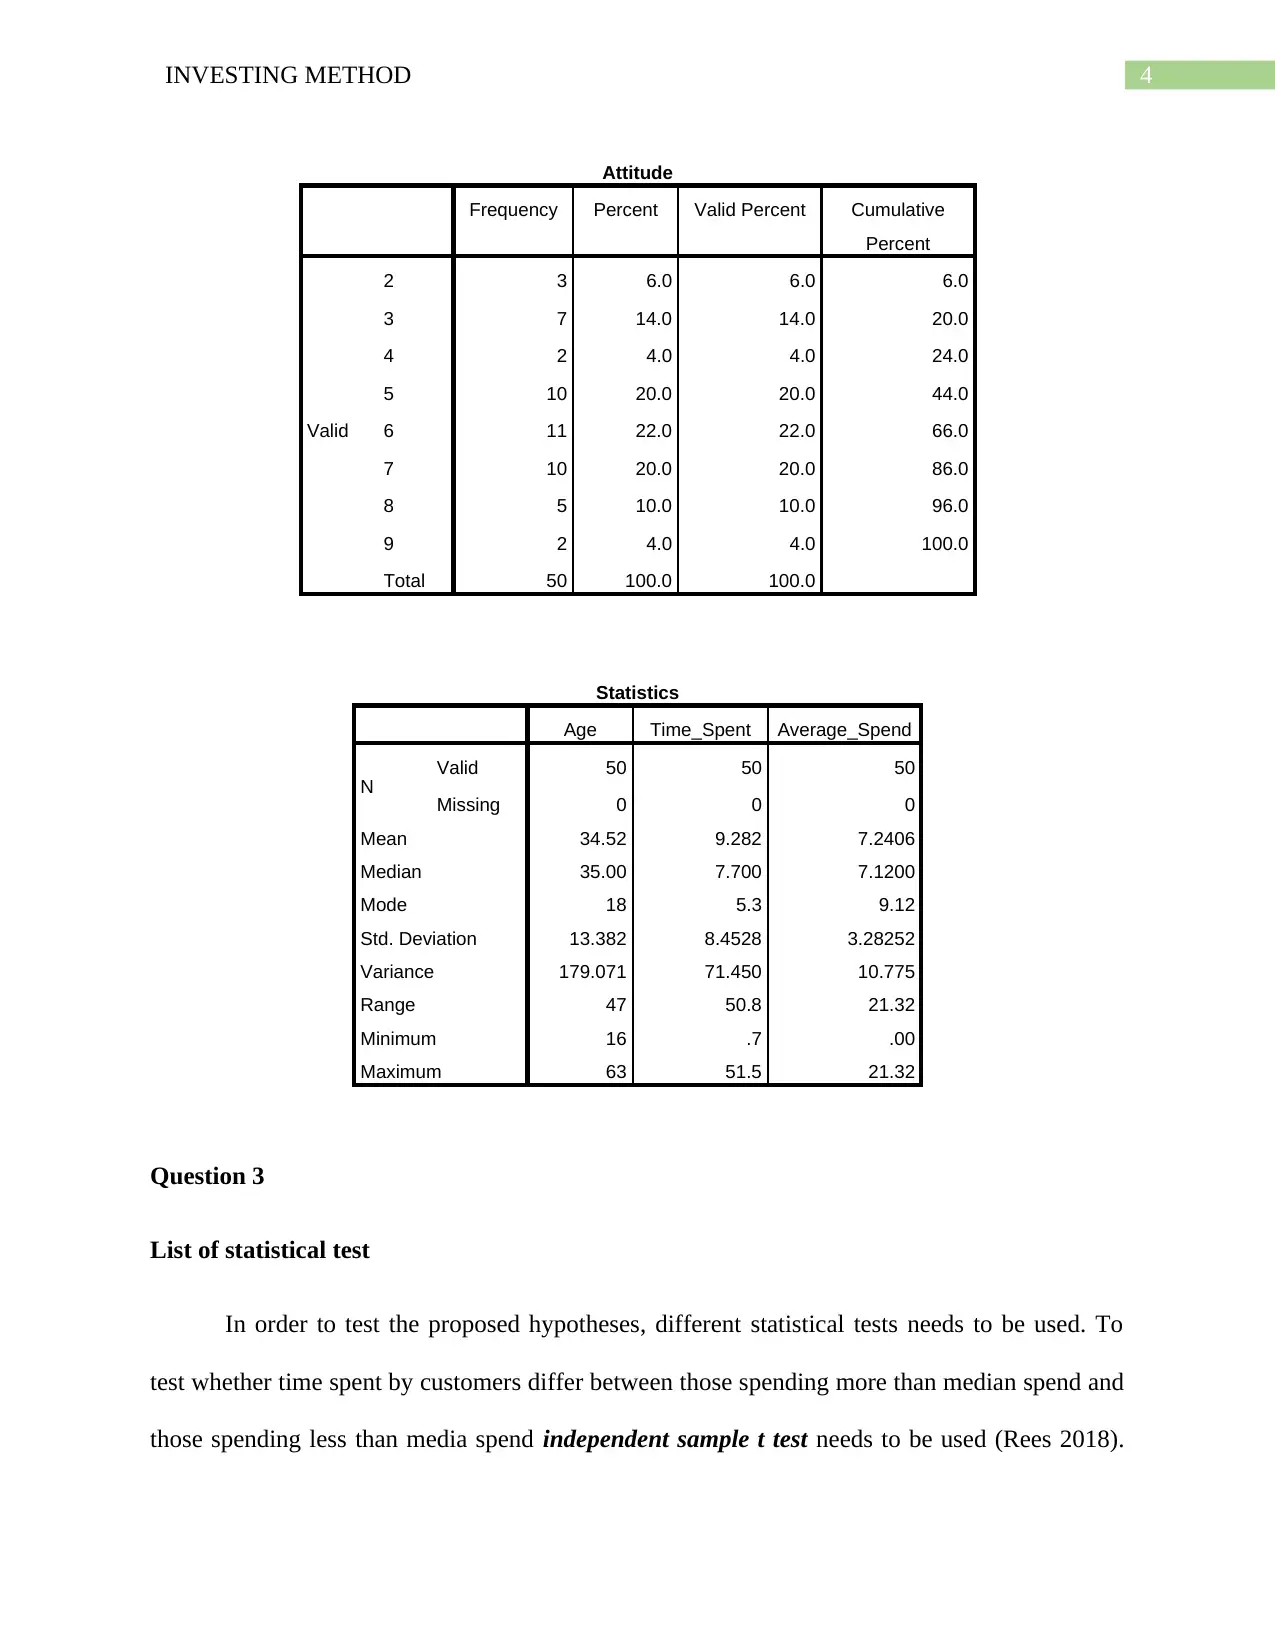
2 3 6.0 6.0 6.0
3 7 14.0 14.0 20.0
4 2 4.0 4.0 24.0
5 10 20.0 20.0 44.0
6 11 22.0 22.0 66.0
7 10 20.0 20.0 86.0
8 5 10.0 10.0 96.0
9 2 4.0 4.0 100.0
Total 50 100.0 100.0
Statistics
Age Time_Spent Average_Spend
N Valid 50 50 50
Missing 0 0 0
Mean 34.52 9.282 7.2406
Median 35.00 7.700 7.1200
Mode 18 5.3 9.12
Std. Deviation 13.382 8.4528 3.28252
Variance 179.071 71.450 10.775
Range 47 50.8 21.32
Minimum 16 .7 .00
Maximum 63 51.5 21.32
Question 3
List of statistical test
In order to test the proposed hypotheses, different statistical tests needs to be used. To
test whether time spent by customers differ between those spending more than median spend and
those spending less than media spend independent sample t test needs to be used (Rees 2018).
Attitude
Frequency Percent Valid Percent Cumulative
Percent
Valid
2 3 6.0 6.0 6.0
3 7 14.0 14.0 20.0
4 2 4.0 4.0 24.0
5 10 20.0 20.0 44.0
6 11 22.0 22.0 66.0
7 10 20.0 20.0 86.0
8 5 10.0 10.0 96.0
9 2 4.0 4.0 100.0
Total 50 100.0 100.0
Statistics
Age Time_Spent Average_Spend
N Valid 50 50 50
Missing 0 0 0
Mean 34.52 9.282 7.2406
Median 35.00 7.700 7.1200
Mode 18 5.3 9.12
Std. Deviation 13.382 8.4528 3.28252
Variance 179.071 71.450 10.775
Range 47 50.8 21.32
Minimum 16 .7 .00
Maximum 63 51.5 21.32
Question 3
List of statistical test
In order to test the proposed hypotheses, different statistical tests needs to be used. To
test whether time spent by customers differ between those spending more than median spend and
those spending less than media spend independent sample t test needs to be used (Rees 2018).
5INVESTING METHOD
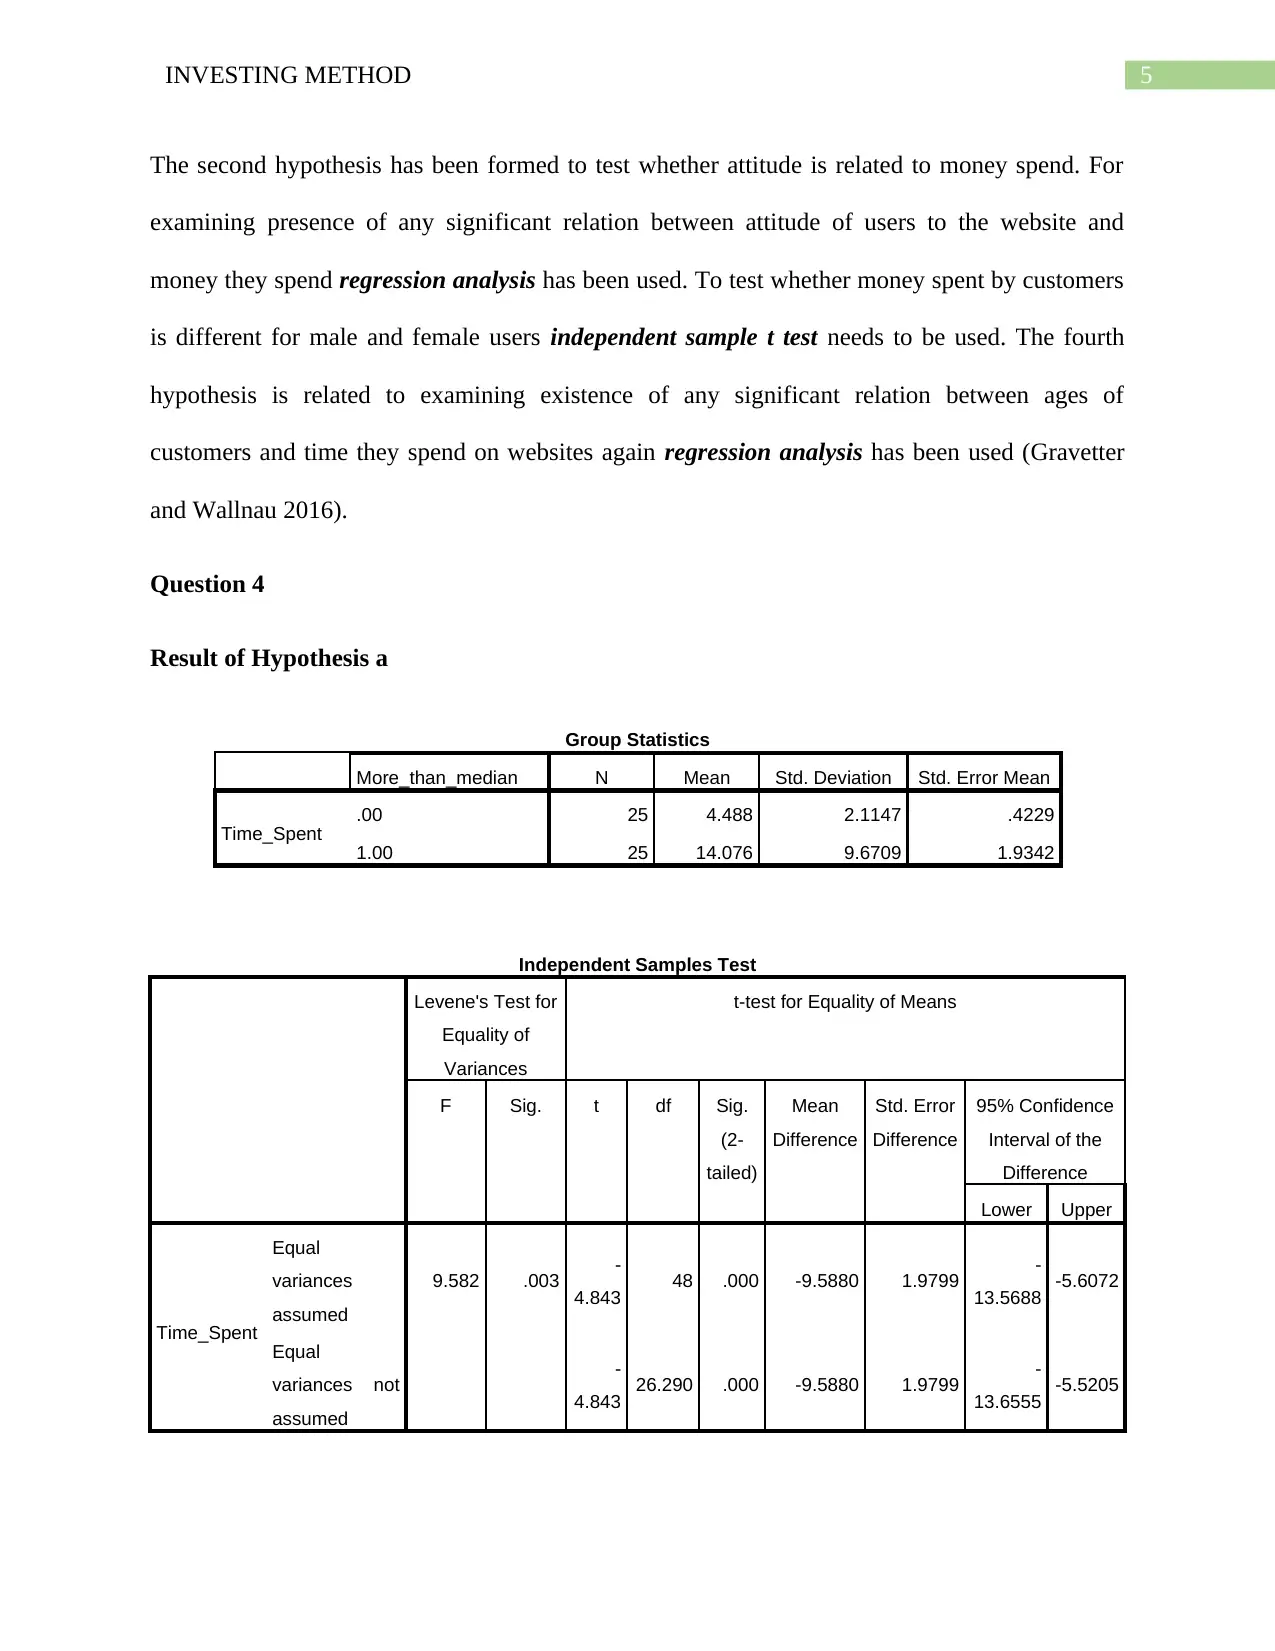
The second hypothesis has been formed to test whether attitude is related to money spend. For
examining presence of any significant relation between attitude of users to the website and
money they spend regression analysis has been used. To test whether money spent by customers
is different for male and female users independent sample t test needs to be used. The fourth
hypothesis is related to examining existence of any significant relation between ages of
customers and time they spend on websites again regression analysis has been used (Gravetter
and Wallnau 2016).
Question 4
Result of Hypothesis a
Group Statistics
More_than_median N Mean Std. Deviation Std. Error Mean
Time_Spent .00 25 4.488 2.1147 .4229
1.00 25 14.076 9.6709 1.9342
Independent Samples Test
Levene's Test for
Equality of
Variances
t-test for Equality of Means
F Sig. t df Sig.
(2-
tailed)
Mean
Difference
Std. Error
Difference
95% Confidence
Interval of the
Difference
Lower Upper
Time_Spent
Equal
variances
assumed
9.582 .003 -
4.843 48 .000 -9.5880 1.9799 -
13.5688 -5.6072
Equal
variances not
assumed
-
4.843 26.290 .000 -9.5880 1.9799 -
13.6555 -5.5205
⊘ This is a preview!⊘
Do you want full access?
Subscribe today to unlock all pages.
Trusted by 1+ million students worldwide
6INVESTING METHOD
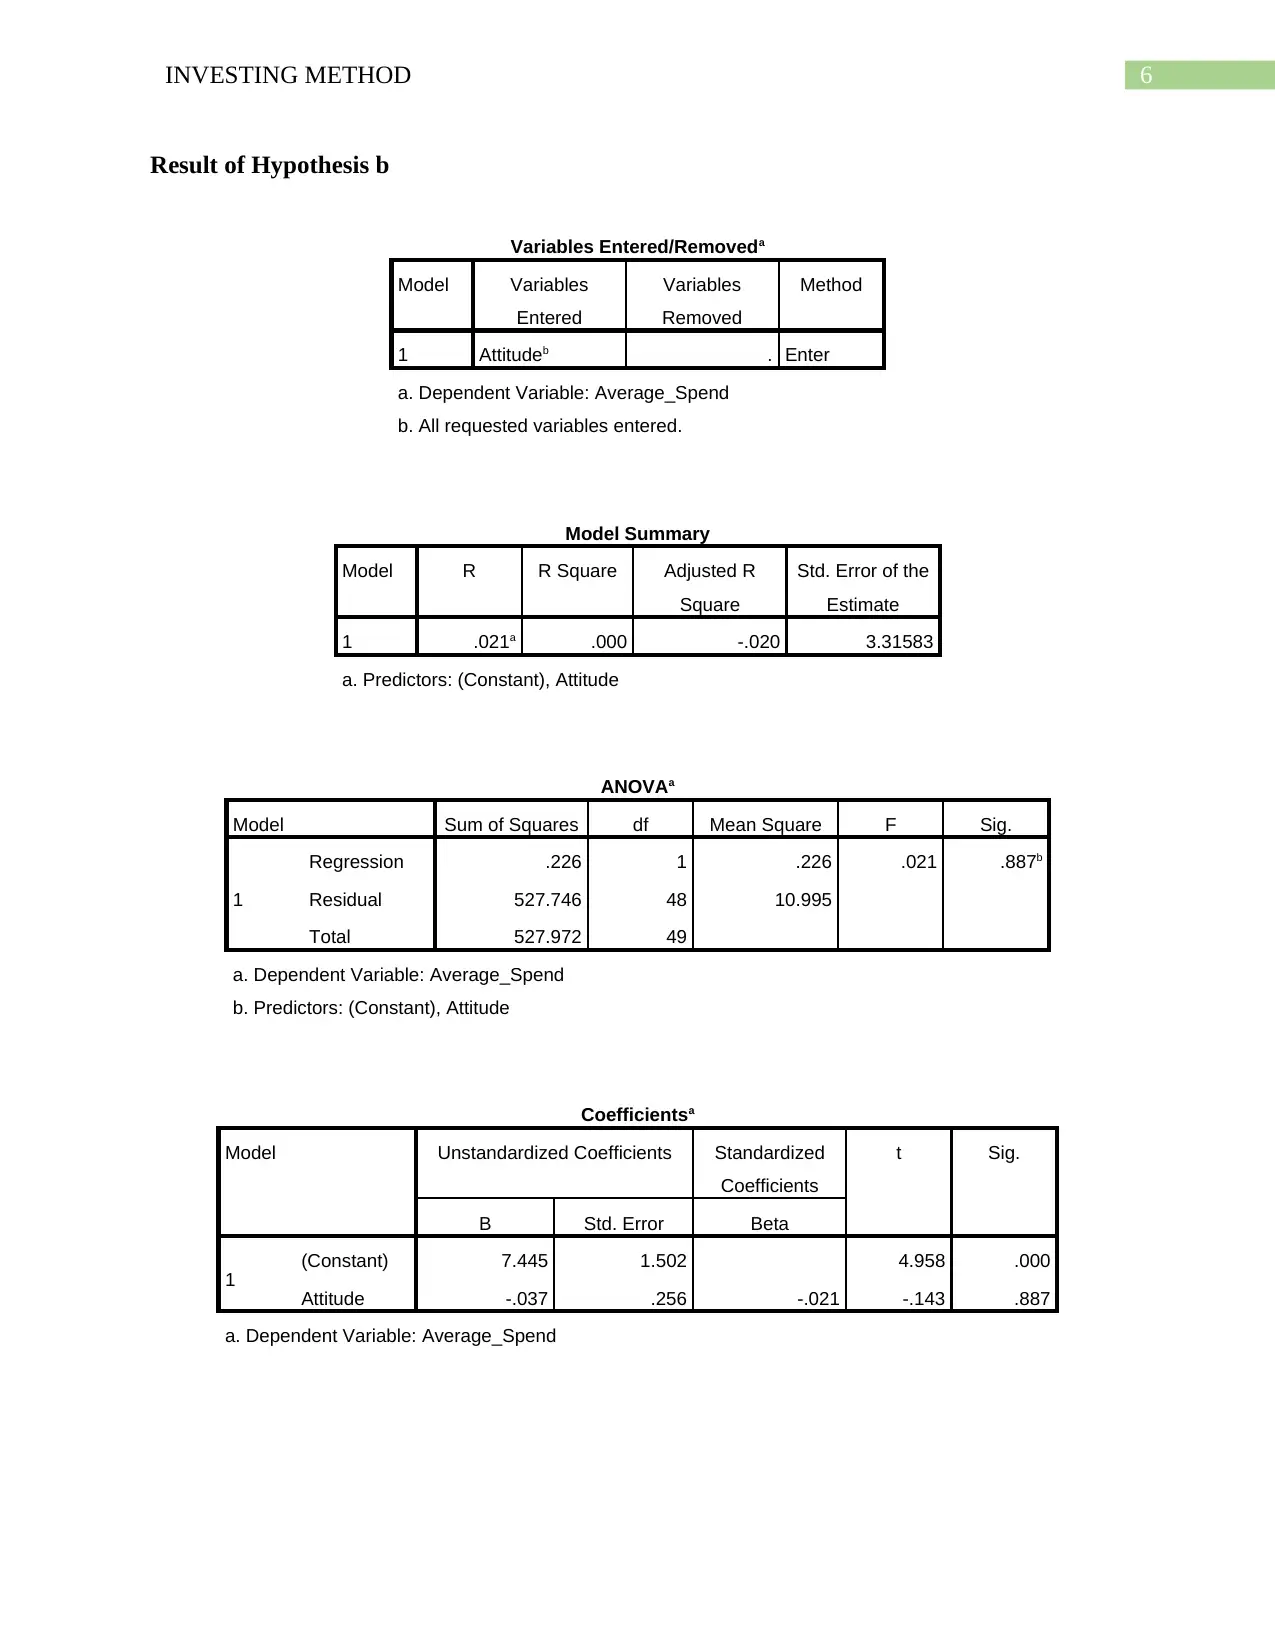
Result of Hypothesis b
Variables Entered/Removeda
Model Variables
Entered
Variables
Removed
Method
1 Attitudeb . Enter
a. Dependent Variable: Average_Spend
b. All requested variables entered.
Model Summary
Model R R Square Adjusted R
Square
Std. Error of the
Estimate
1 .021a .000 -.020 3.31583
a. Predictors: (Constant), Attitude
ANOVAa
Model Sum of Squares df Mean Square F Sig.
1
Regression .226 1 .226 .021 .887b
Residual 527.746 48 10.995
Total 527.972 49
a. Dependent Variable: Average_Spend
b. Predictors: (Constant), Attitude
Coefficientsa
Model Unstandardized Coefficients Standardized
Coefficients
t Sig.
B Std. Error Beta
1 (Constant) 7.445 1.502 4.958 .000
Attitude -.037 .256 -.021 -.143 .887
a. Dependent Variable: Average_Spend
Paraphrase This Document
Need a fresh take? Get an instant paraphrase of this document with our AI Paraphraser
7INVESTING METHOD
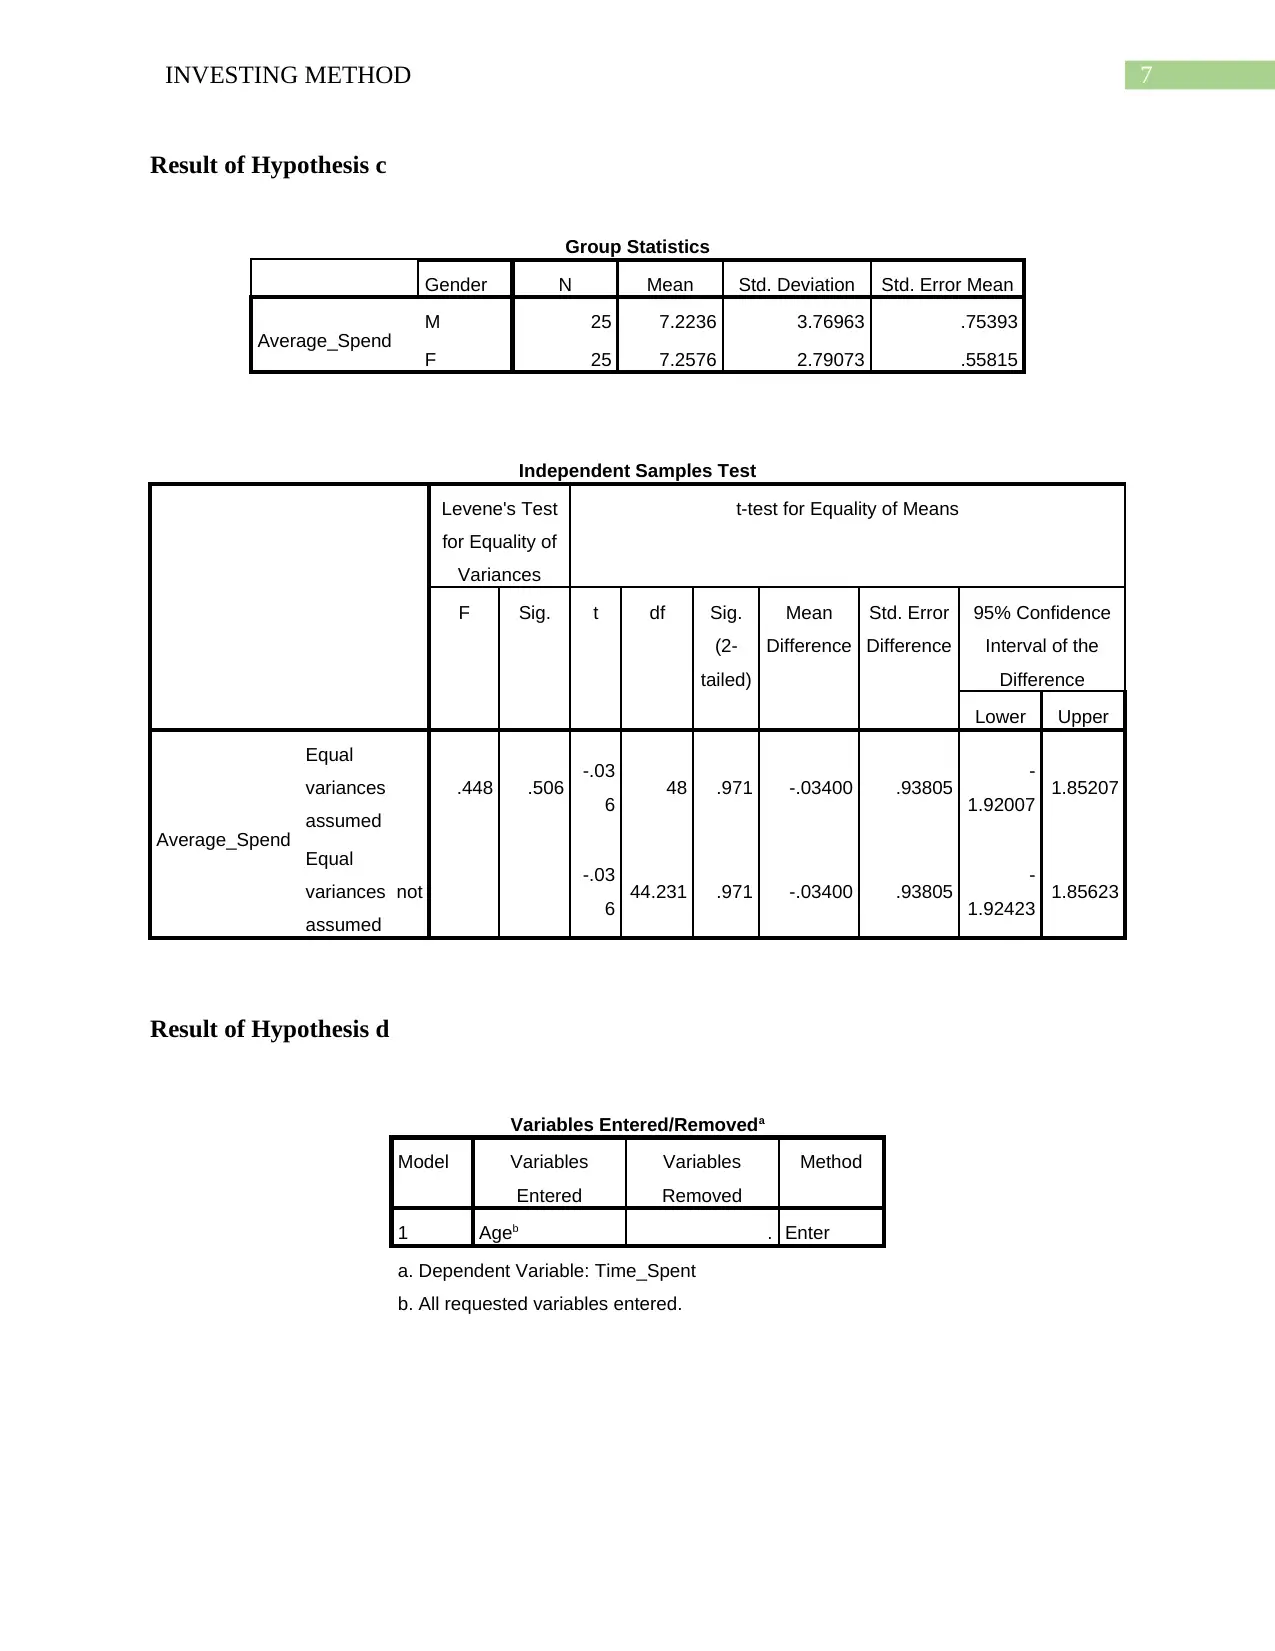
Result of Hypothesis c
Group Statistics
Gender N Mean Std. Deviation Std. Error Mean
Average_Spend M 25 7.2236 3.76963 .75393
F 25 7.2576 2.79073 .55815
Independent Samples Test
Levene's Test
for Equality of
Variances
t-test for Equality of Means
F Sig. t df Sig.
(2-
tailed)
Mean
Difference
Std. Error
Difference
95% Confidence
Interval of the
Difference
Lower Upper
Average_Spend
Equal
variances
assumed
.448 .506 -.03
6 48 .971 -.03400 .93805 -
1.92007 1.85207
Equal
variances not
assumed
-.03
6 44.231 .971 -.03400 .93805 -
1.92423 1.85623
Result of Hypothesis d
Variables Entered/Removeda
Model Variables
Entered
Variables
Removed
Method
1 Ageb . Enter
a. Dependent Variable: Time_Spent
b. All requested variables entered.
8INVESTING METHOD
Model Summary
Model R R Square Adjusted R
Square
Std. Error of the
Estimate
1 .064a .004 -.017 8.5231
a. Predictors: (Constant), Age
ANOVAa
Model Sum of Squares df Mean Square F Sig.
1
Regression 14.220 1 14.220 .196 .660b
Residual 3486.854 48 72.643
Total 3501.074 49
a. Dependent Variable: Time_Spent
b. Predictors: (Constant), Age
Coefficientsa
Model Unstandardized Coefficients Standardized
Coefficients
t Sig.
B Std. Error Beta
1 (Constant) 10.672 3.364 3.172 .003
Age -.040 .091 -.064 -.442 .660
a. Dependent Variable: Time_Spent
Question 5
Result Analysis
Hypothesis a
The hypothesis states that that the time spend on web pages searching for is different for
customers spending more than the median spend and those spending less than the median spend.
⊘ This is a preview!⊘
Do you want full access?
Subscribe today to unlock all pages.
Trusted by 1+ million students worldwide
9INVESTING METHOD
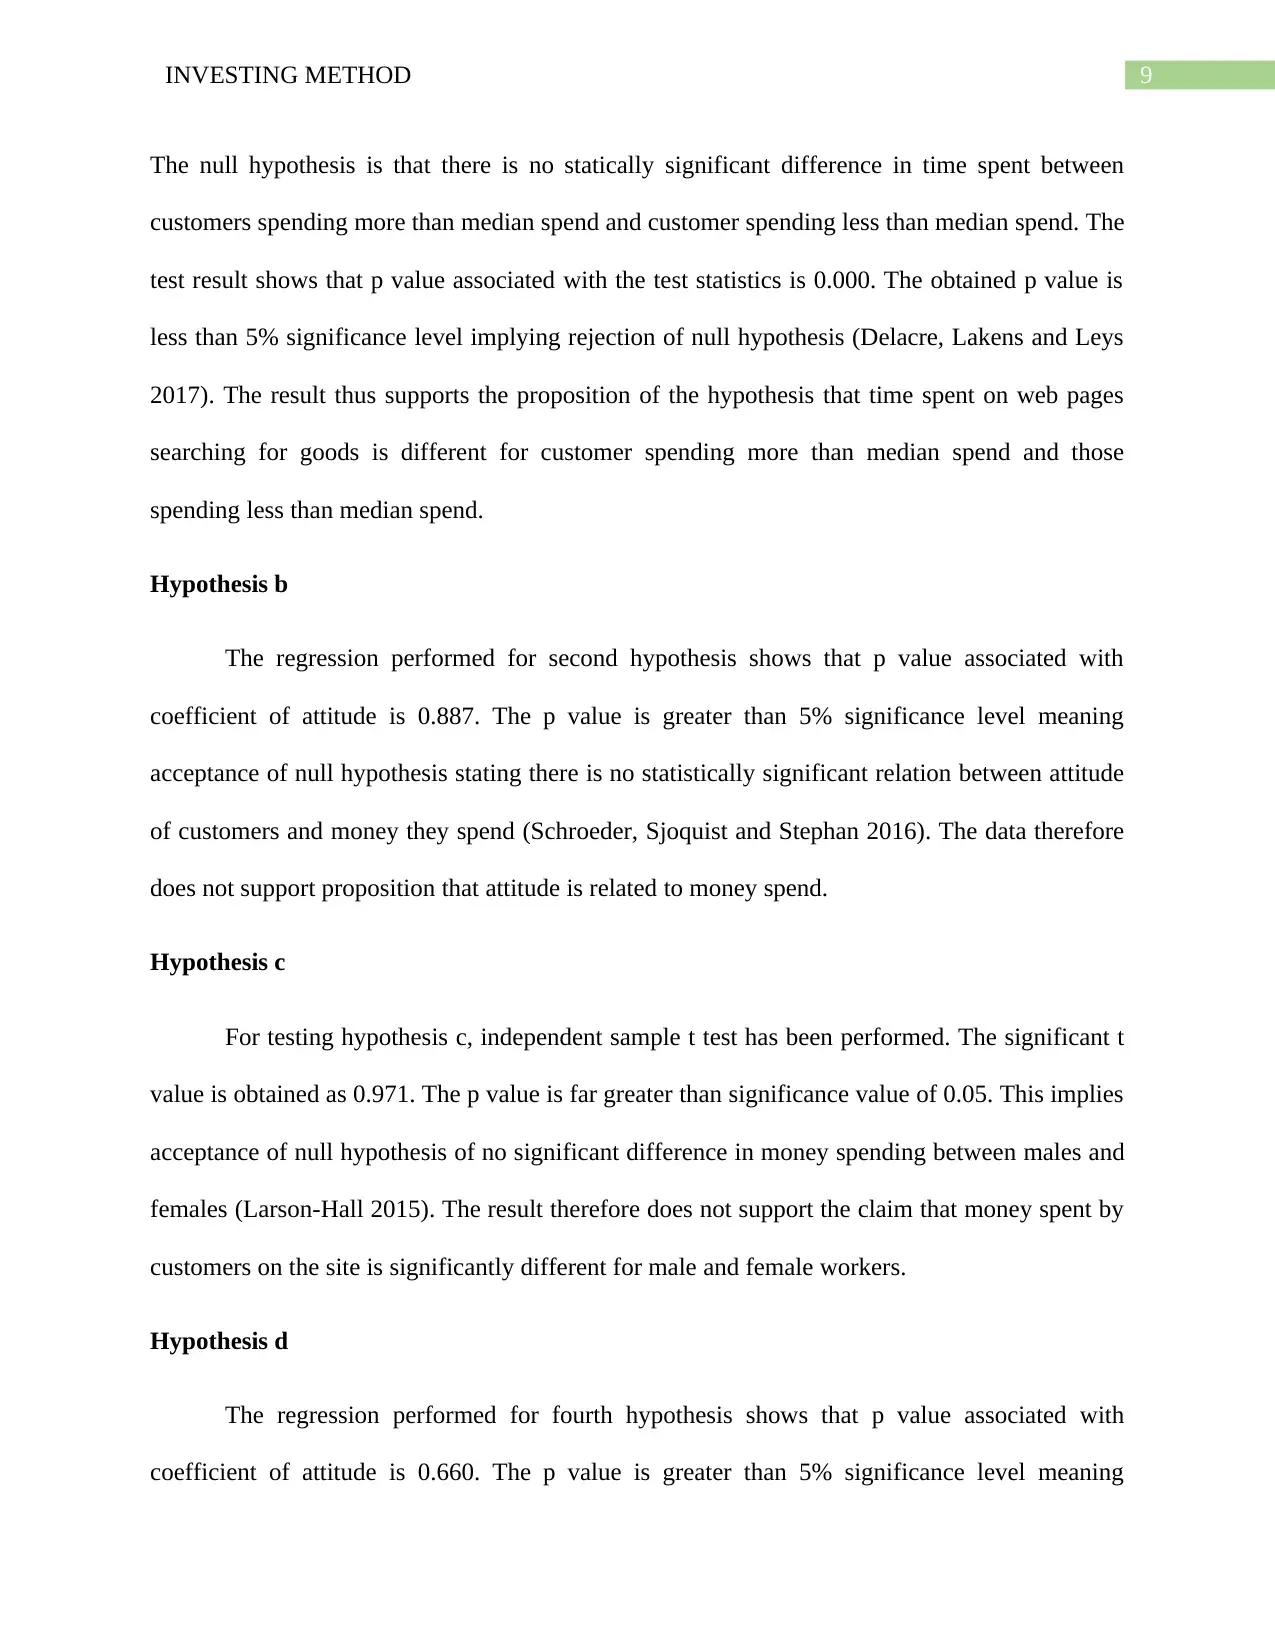
The null hypothesis is that there is no statically significant difference in time spent between
customers spending more than median spend and customer spending less than median spend. The
test result shows that p value associated with the test statistics is 0.000. The obtained p value is
less than 5% significance level implying rejection of null hypothesis (Delacre, Lakens and Leys
2017). The result thus supports the proposition of the hypothesis that time spent on web pages
searching for goods is different for customer spending more than median spend and those
spending less than median spend.
Hypothesis b
The regression performed for second hypothesis shows that p value associated with
coefficient of attitude is 0.887. The p value is greater than 5% significance level meaning
acceptance of null hypothesis stating there is no statistically significant relation between attitude
of customers and money they spend (Schroeder, Sjoquist and Stephan 2016). The data therefore
does not support proposition that attitude is related to money spend.
Hypothesis c
For testing hypothesis c, independent sample t test has been performed. The significant t
value is obtained as 0.971. The p value is far greater than significance value of 0.05. This implies
acceptance of null hypothesis of no significant difference in money spending between males and
females (Larson-Hall 2015). The result therefore does not support the claim that money spent by
customers on the site is significantly different for male and female workers.
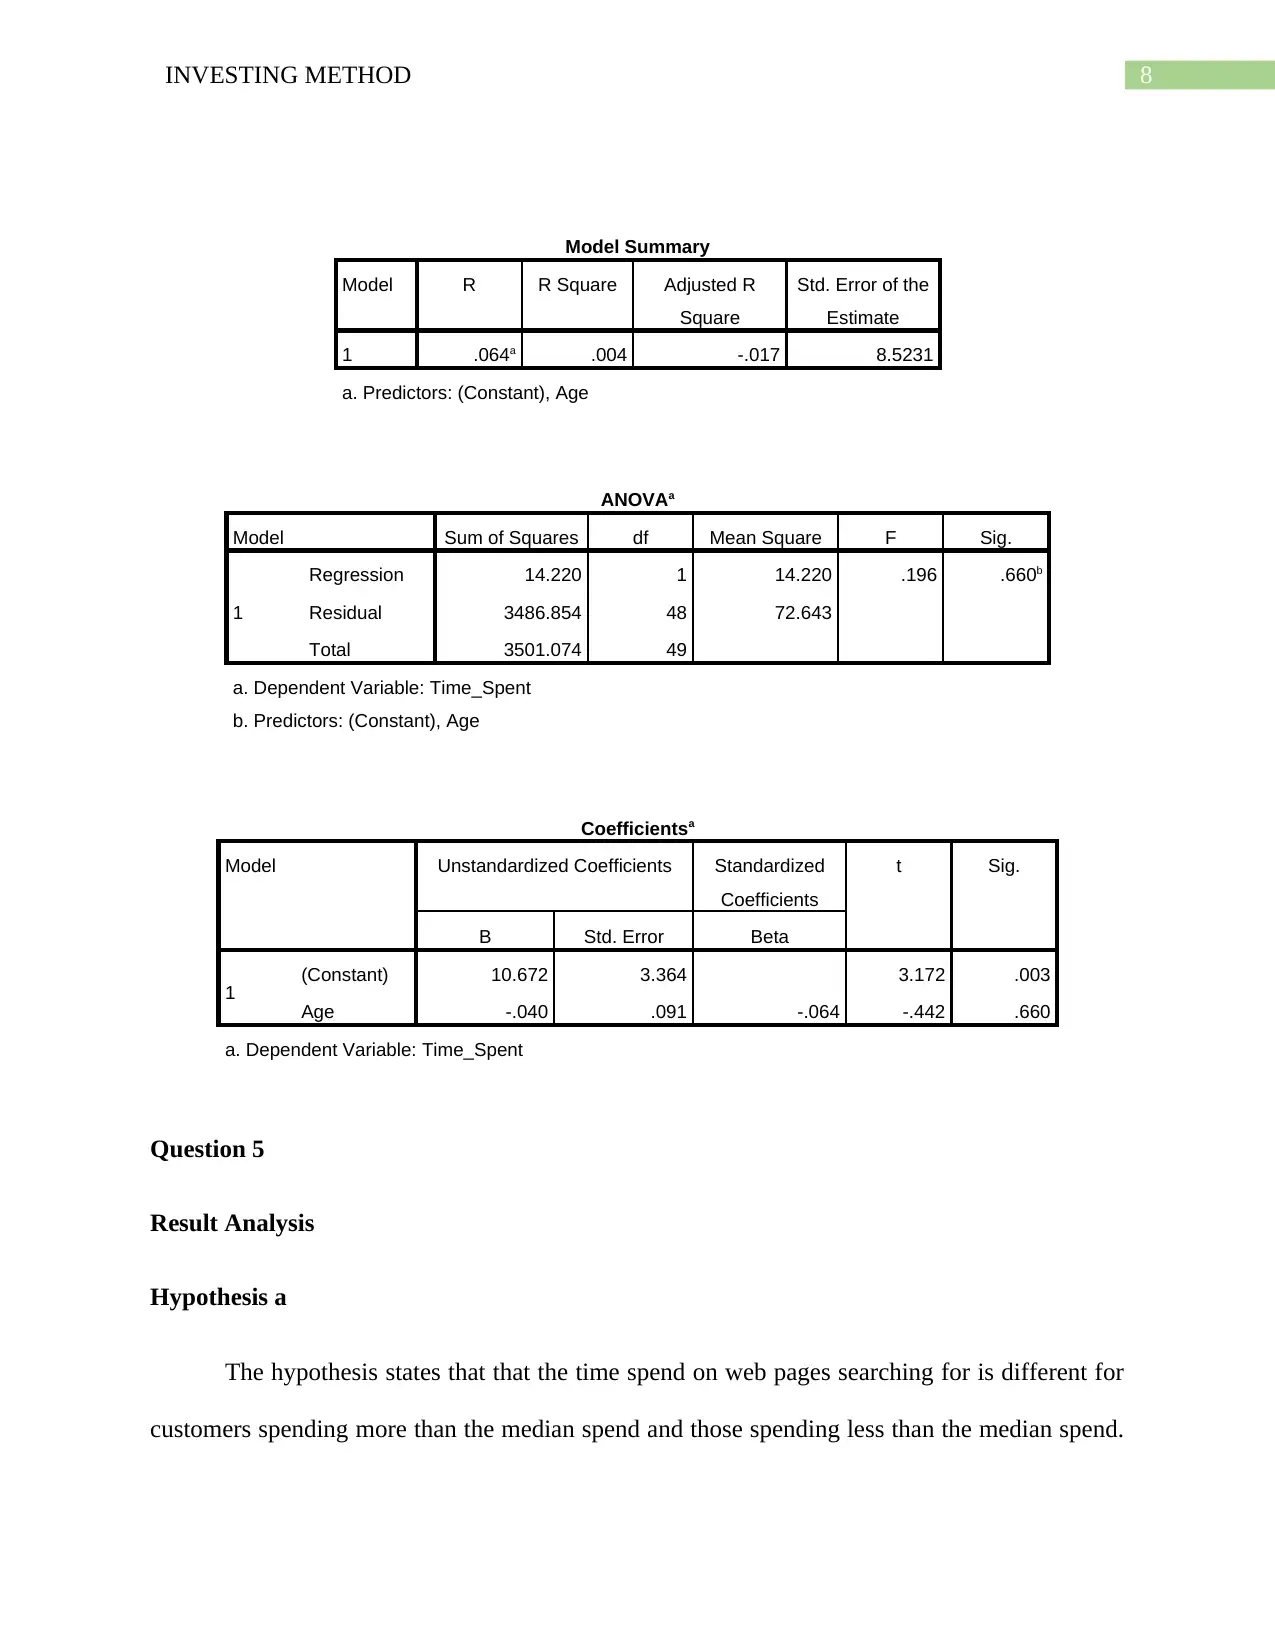
Hypothesis d
The regression performed for fourth hypothesis shows that p value associated with
coefficient of attitude is 0.660. The p value is greater than 5% significance level meaning
The null hypothesis is that there is no statically significant difference in time spent between
customers spending more than median spend and customer spending less than median spend. The
test result shows that p value associated with the test statistics is 0.000. The obtained p value is
less than 5% significance level implying rejection of null hypothesis (Delacre, Lakens and Leys
2017). The result thus supports the proposition of the hypothesis that time spent on web pages
searching for goods is different for customer spending more than median spend and those
spending less than median spend.
Hypothesis b
The regression performed for second hypothesis shows that p value associated with
coefficient of attitude is 0.887. The p value is greater than 5% significance level meaning
acceptance of null hypothesis stating there is no statistically significant relation between attitude
of customers and money they spend (Schroeder, Sjoquist and Stephan 2016). The data therefore
does not support proposition that attitude is related to money spend.
Hypothesis c
For testing hypothesis c, independent sample t test has been performed. The significant t
value is obtained as 0.971. The p value is far greater than significance value of 0.05. This implies
acceptance of null hypothesis of no significant difference in money spending between males and
females (Larson-Hall 2015). The result therefore does not support the claim that money spent by
customers on the site is significantly different for male and female workers.
Hypothesis d
The regression performed for fourth hypothesis shows that p value associated with
coefficient of attitude is 0.660. The p value is greater than 5% significance level meaning
Paraphrase This Document
Need a fresh take? Get an instant paraphrase of this document with our AI Paraphraser
10INVESTING METHOD
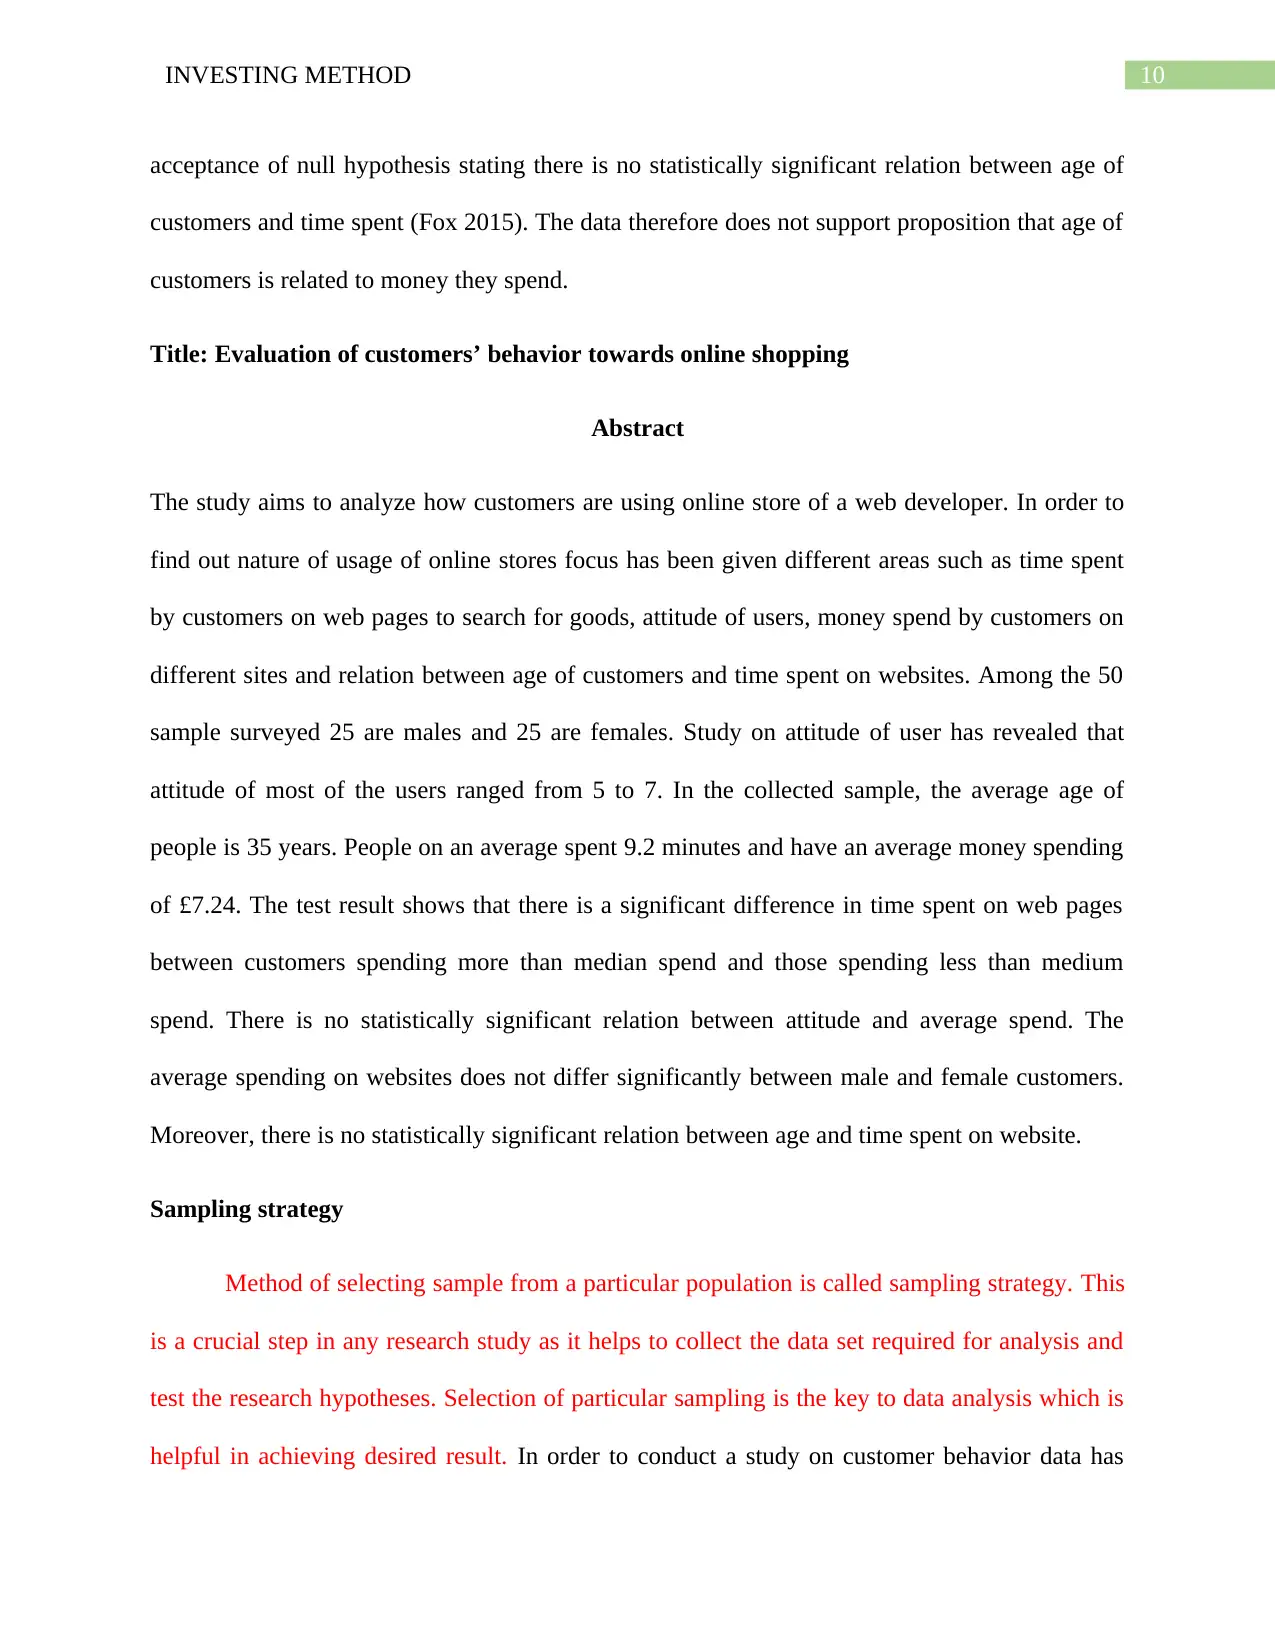
acceptance of null hypothesis stating there is no statistically significant relation between age of
customers and time spent (Fox 2015). The data therefore does not support proposition that age of
customers is related to money they spend.
Title: Evaluation of customers’ behavior towards online shopping
Abstract
The study aims to analyze how customers are using online store of a web developer. In order to
find out nature of usage of online stores focus has been given different areas such as time spent
by customers on web pages to search for goods, attitude of users, money spend by customers on
different sites and relation between age of customers and time spent on websites. Among the 50
sample surveyed 25 are males and 25 are females. Study on attitude of user has revealed that
attitude of most of the users ranged from 5 to 7. In the collected sample, the average age of
people is 35 years. People on an average spent 9.2 minutes and have an average money spending
of £7.24. The test result shows that there is a significant difference in time spent on web pages
between customers spending more than median spend and those spending less than medium
spend. There is no statistically significant relation between attitude and average spend. The
average spending on websites does not differ significantly between male and female customers.
Moreover, there is no statistically significant relation between age and time spent on website.
Sampling strategy
Method of selecting sample from a particular population is called sampling strategy. This
is a crucial step in any research study as it helps to collect the data set required for analysis and
test the research hypotheses. Selection of particular sampling is the key to data analysis which is
helpful in achieving desired result. In order to conduct a study on customer behavior data has
11INVESTING METHOD
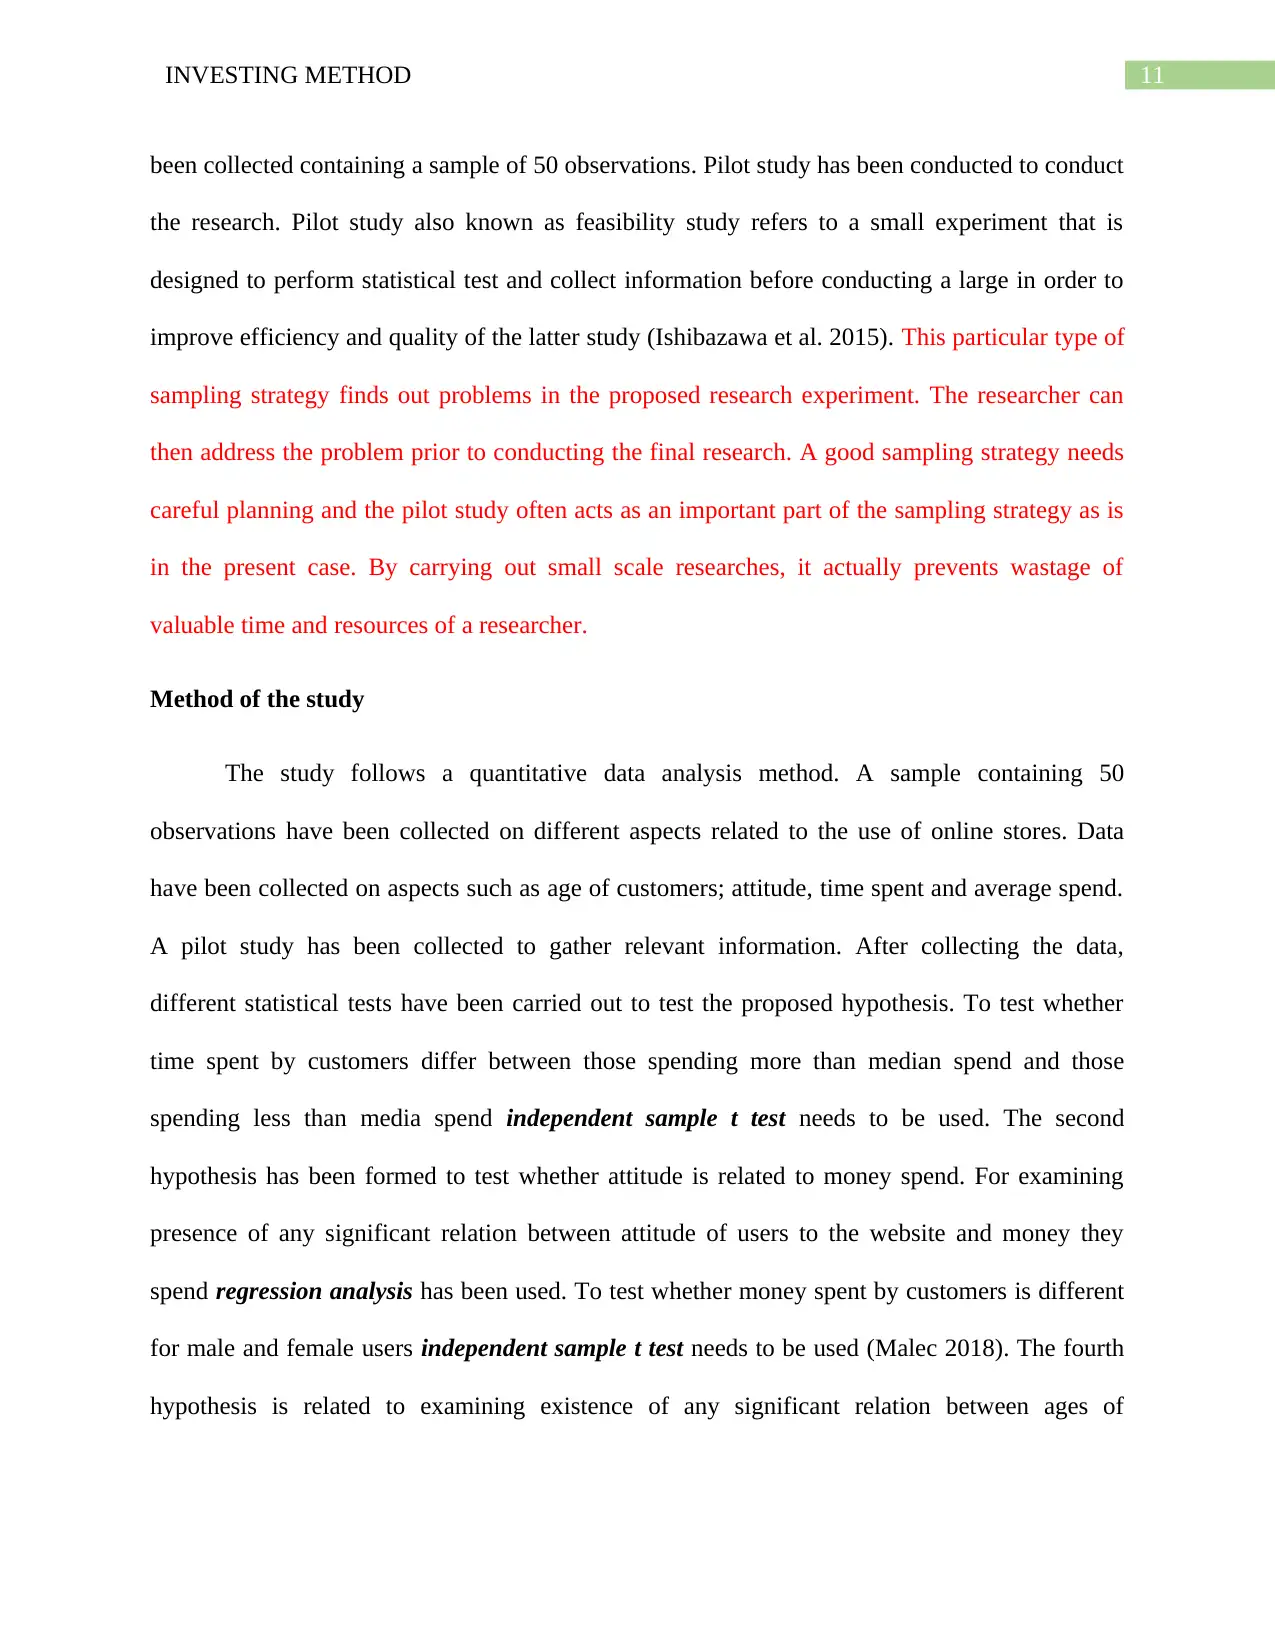
been collected containing a sample of 50 observations. Pilot study has been conducted to conduct
the research. Pilot study also known as feasibility study refers to a small experiment that is
designed to perform statistical test and collect information before conducting a large in order to
improve efficiency and quality of the latter study (Ishibazawa et al. 2015). This particular type of
sampling strategy finds out problems in the proposed research experiment. The researcher can
then address the problem prior to conducting the final research. A good sampling strategy needs
careful planning and the pilot study often acts as an important part of the sampling strategy as is
in the present case. By carrying out small scale researches, it actually prevents wastage of
valuable time and resources of a researcher.
Method of the study
The study follows a quantitative data analysis method. A sample containing 50
observations have been collected on different aspects related to the use of online stores. Data
have been collected on aspects such as age of customers; attitude, time spent and average spend.
A pilot study has been collected to gather relevant information. After collecting the data,
different statistical tests have been carried out to test the proposed hypothesis. To test whether
time spent by customers differ between those spending more than median spend and those
spending less than media spend independent sample t test needs to be used. The second
hypothesis has been formed to test whether attitude is related to money spend. For examining
presence of any significant relation between attitude of users to the website and money they
spend regression analysis has been used. To test whether money spent by customers is different
for male and female users independent sample t test needs to be used (Malec 2018). The fourth
hypothesis is related to examining existence of any significant relation between ages of
⊘ This is a preview!⊘
Do you want full access?
Subscribe today to unlock all pages.
Trusted by 1+ million students worldwide
1 out of 14
Related Documents


Your All-in-One AI-Powered Toolkit for Academic Success.
+13062052269
info@desklib.com
Available 24*7 on WhatsApp / Email
![[object Object]](/_next/static/media/star-bottom.7253800d.svg)
Unlock your academic potential
Copyright © 2020–2026 A2Z Services. All Rights Reserved. Developed and managed by ZUCOL.