Data Analysis and Visualization Report: COVID-19 Infection Rates in UK
VerifiedAdded on  2023/01/04
|16
|2302
|76
Report
AI Summary
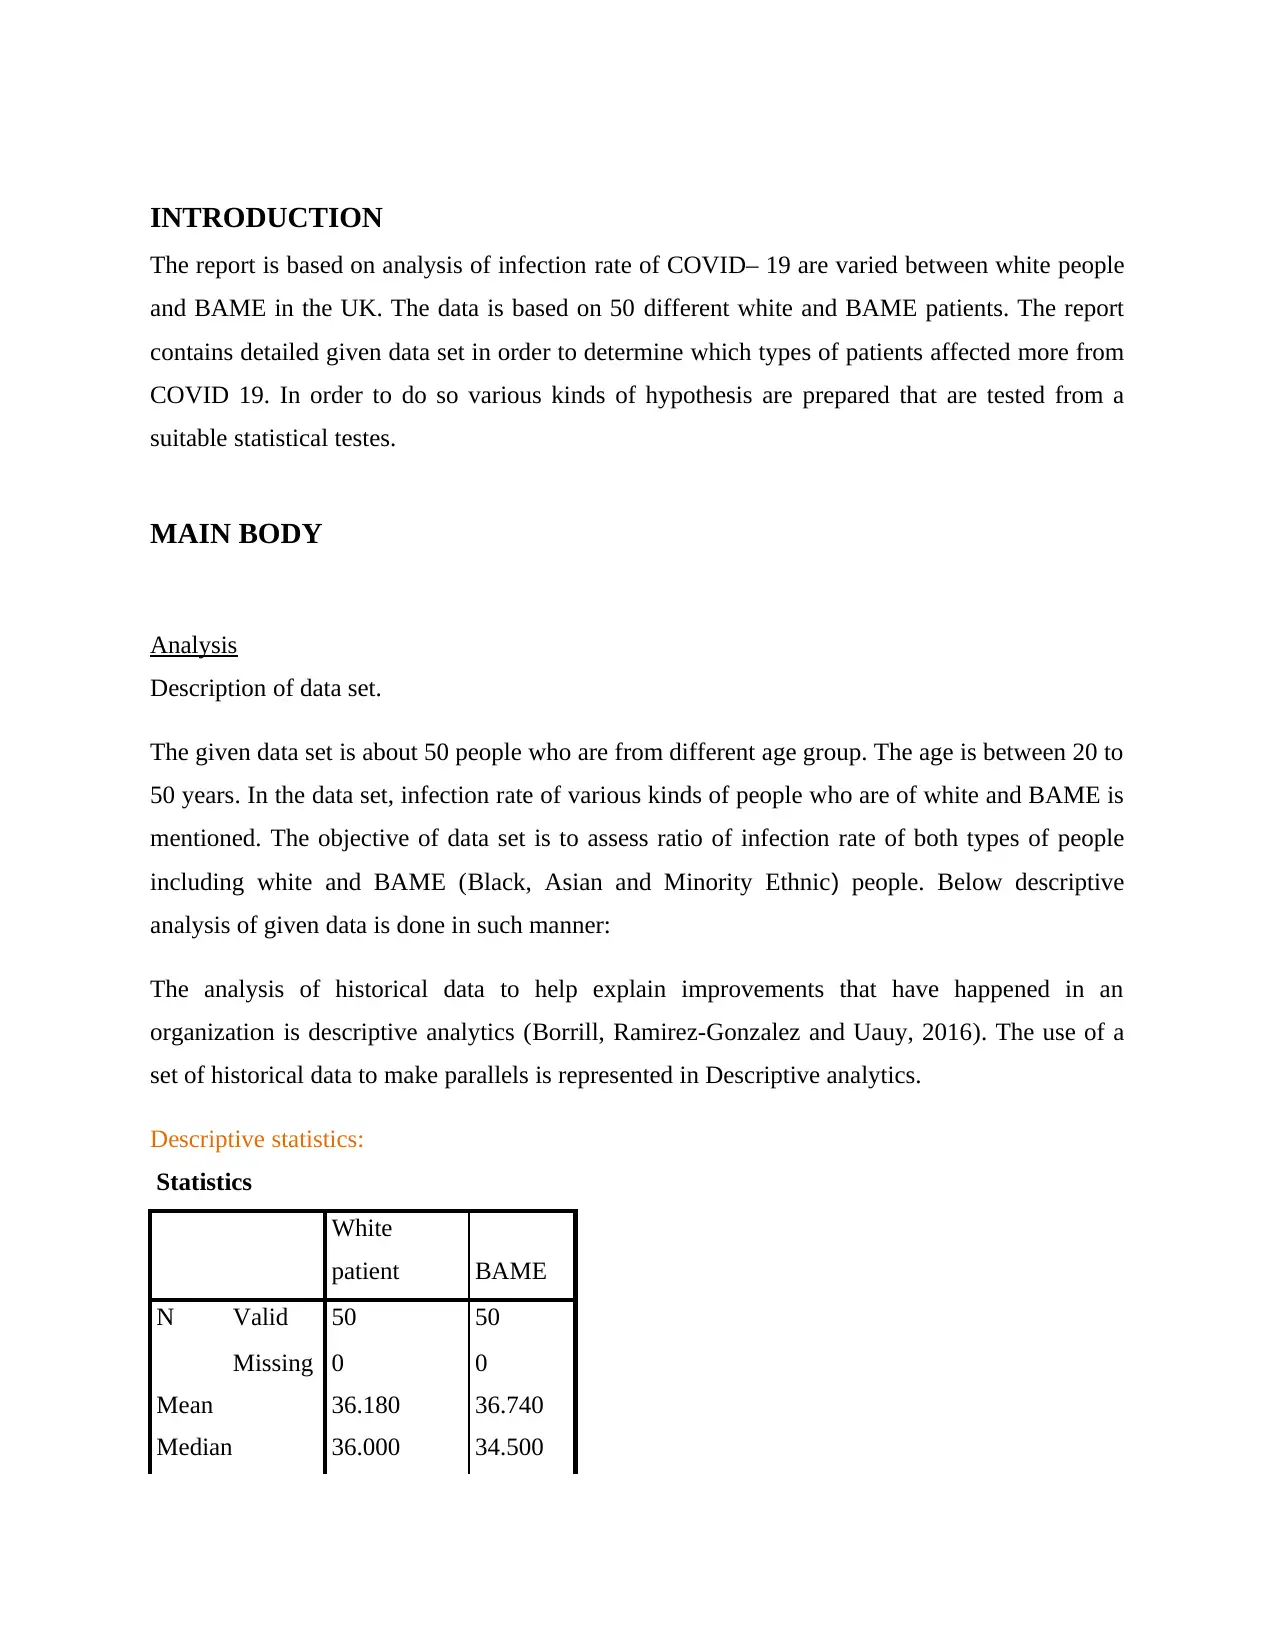
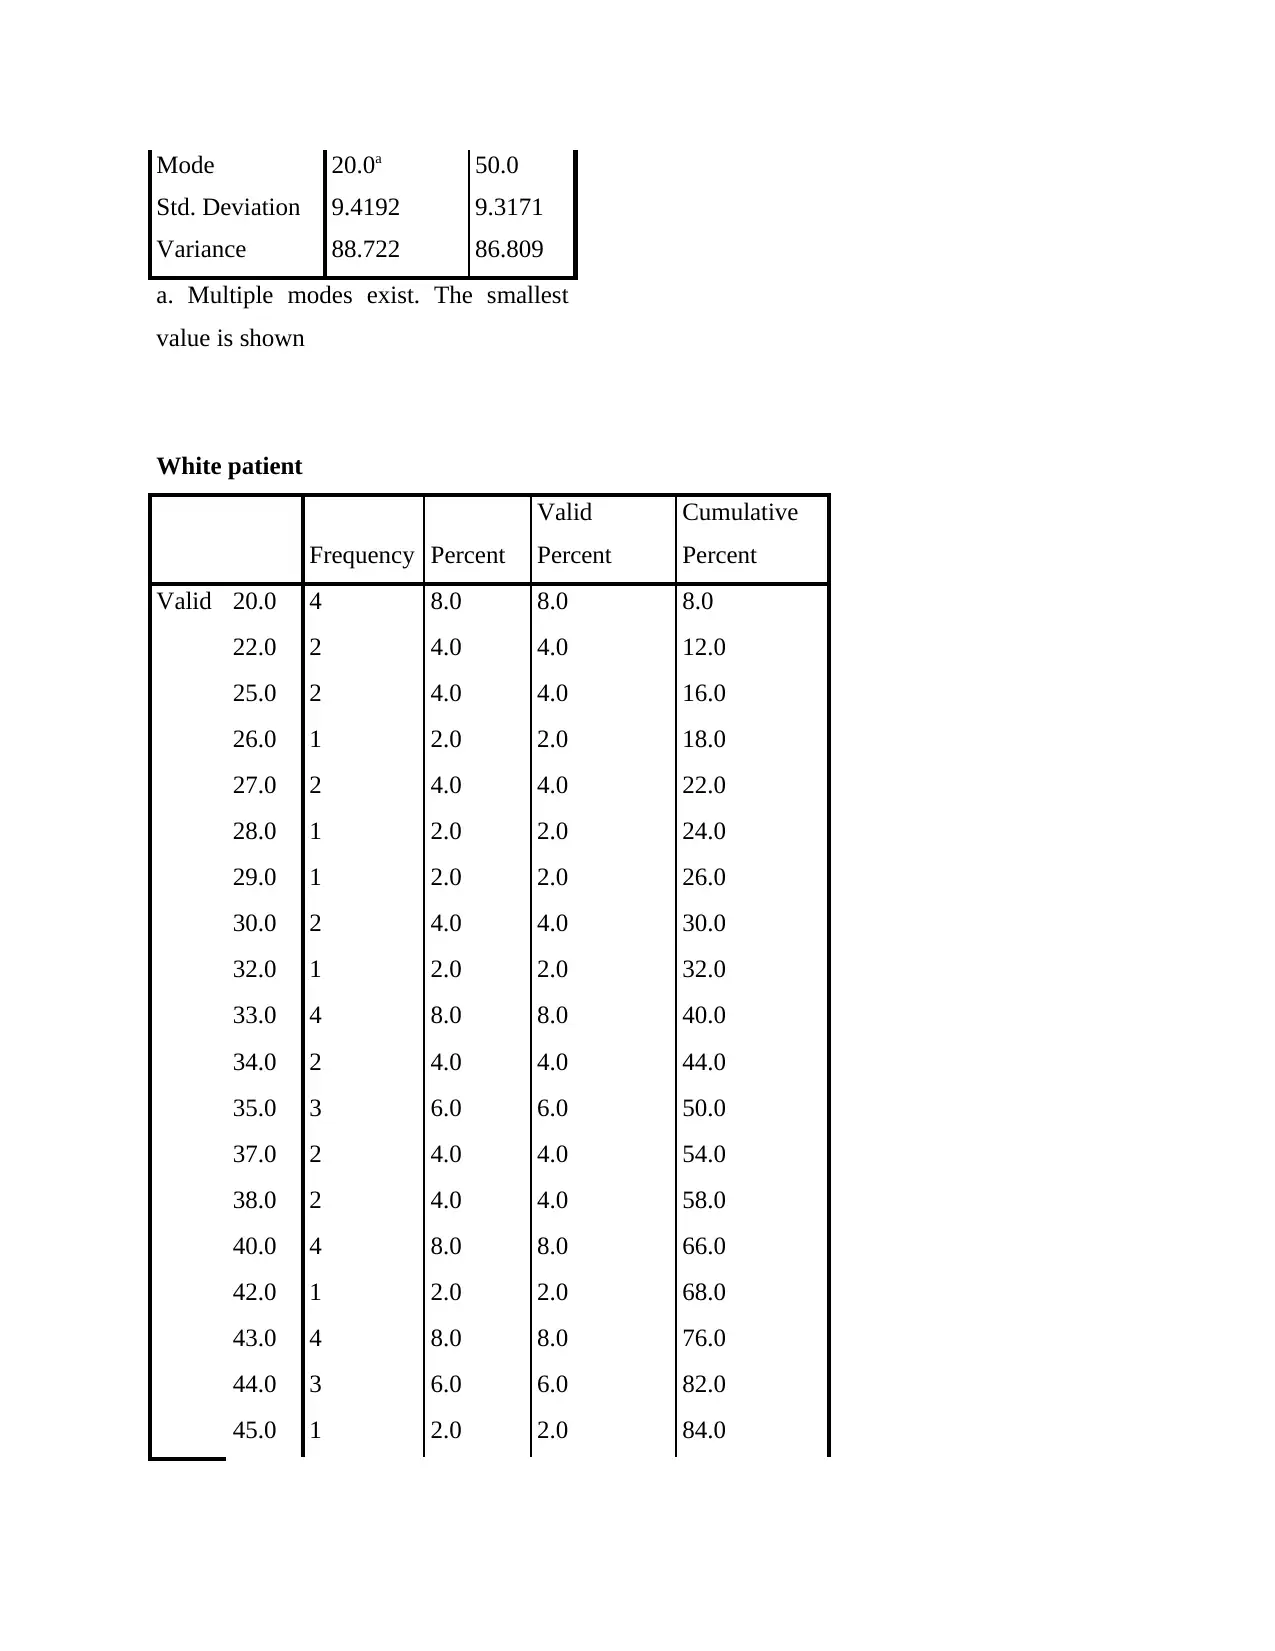
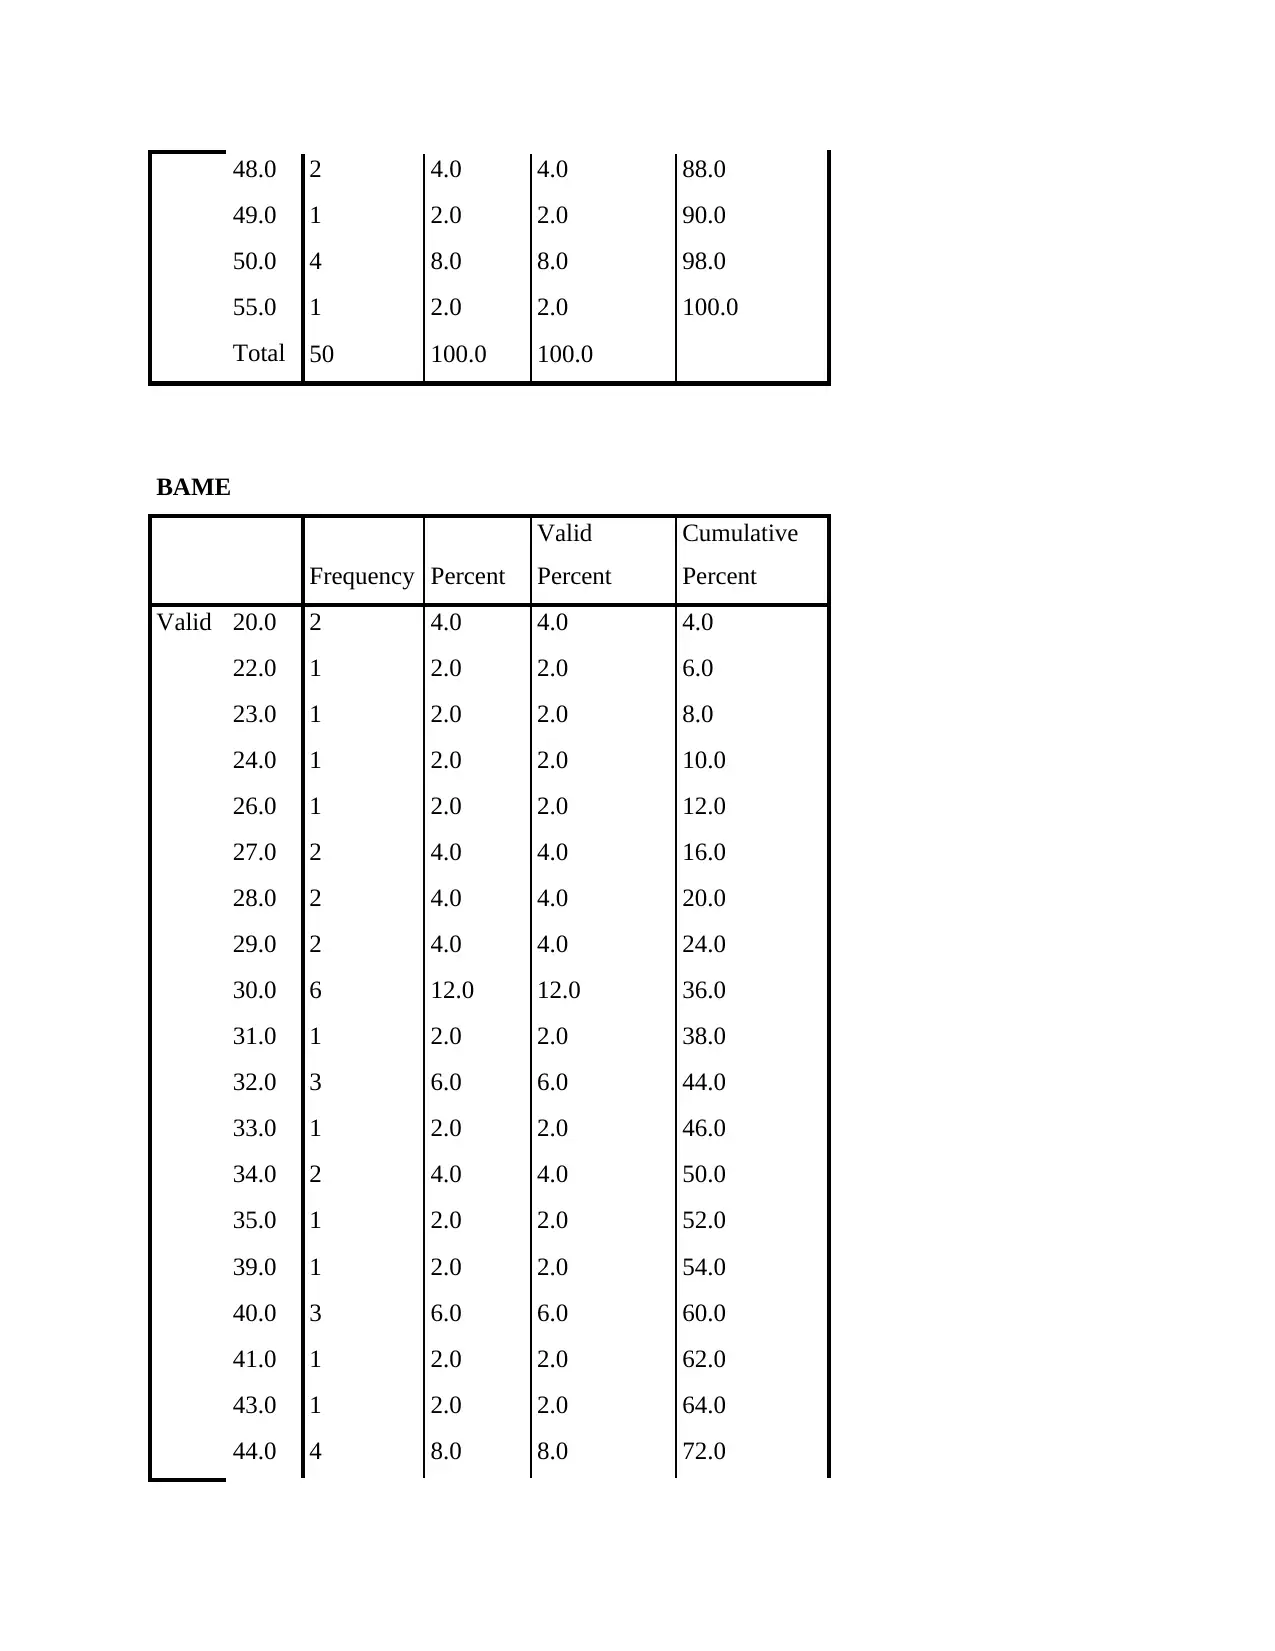
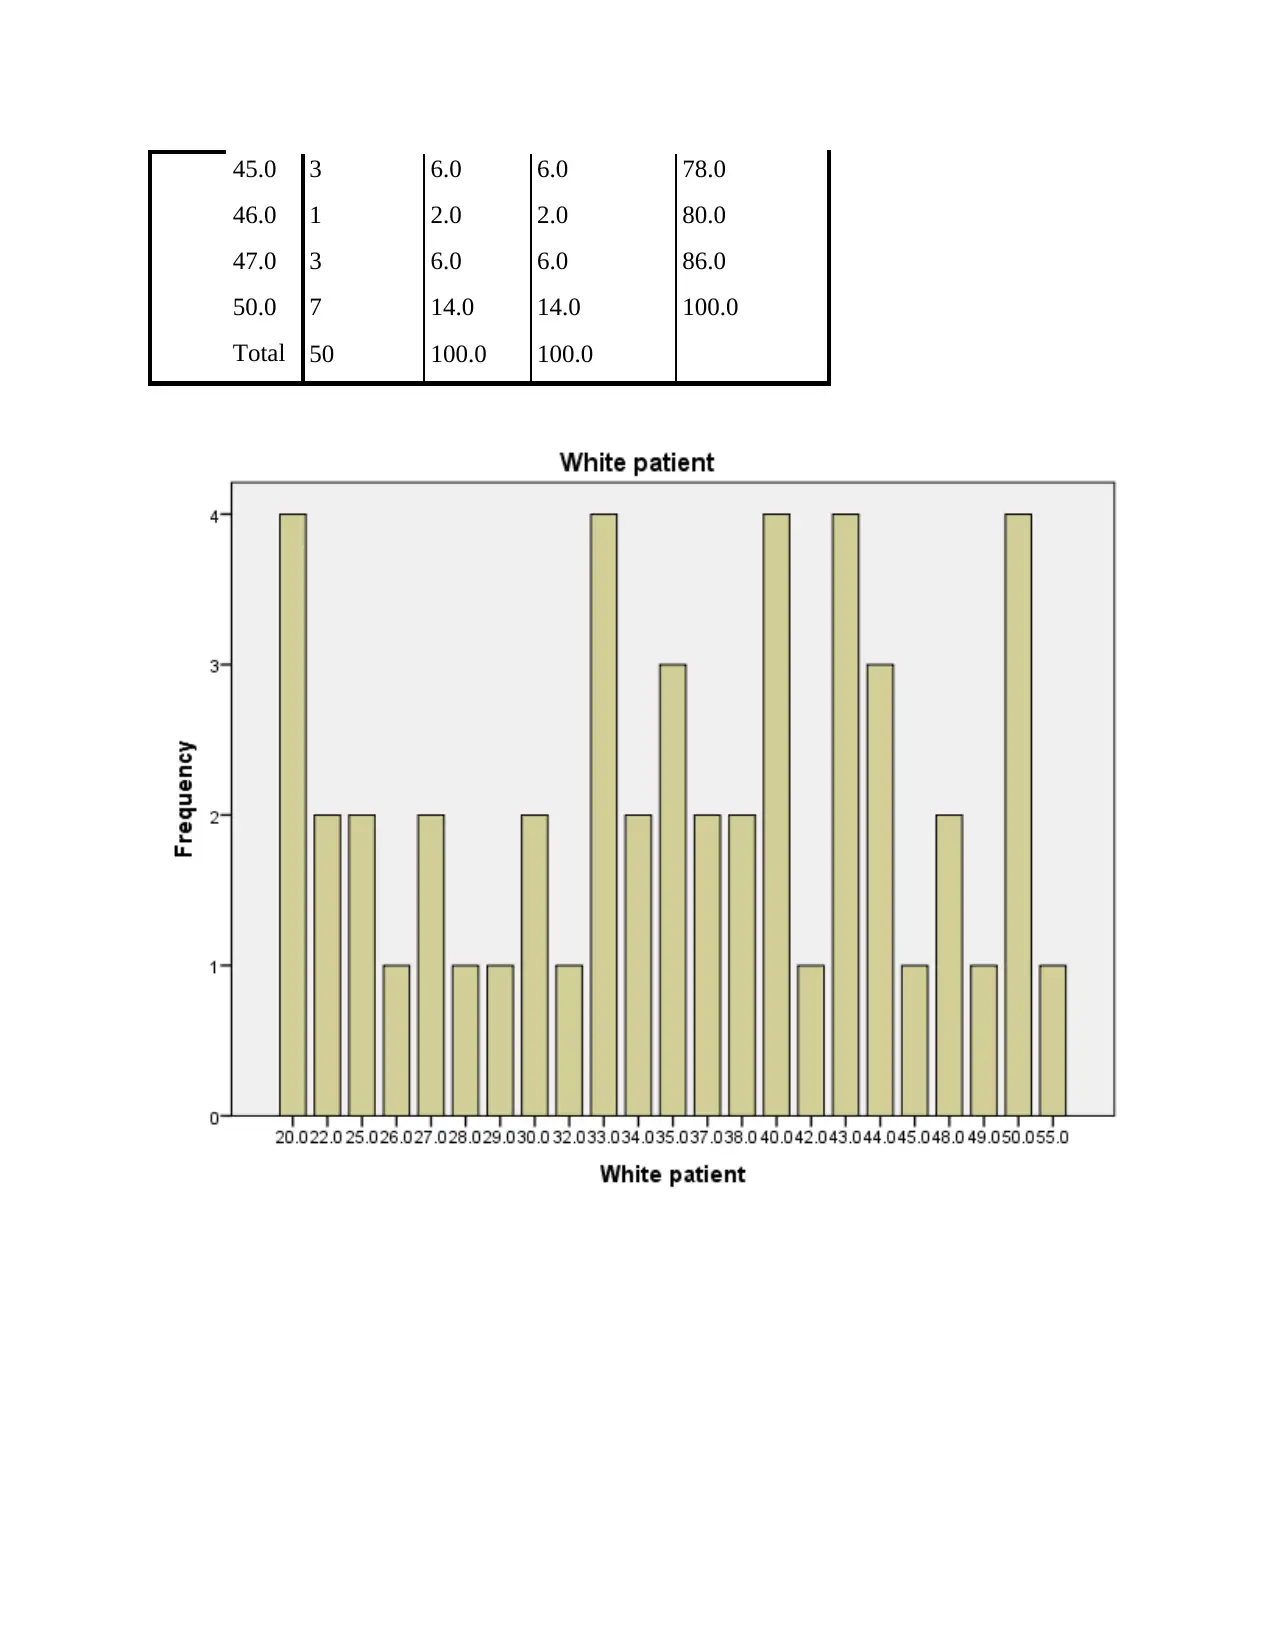
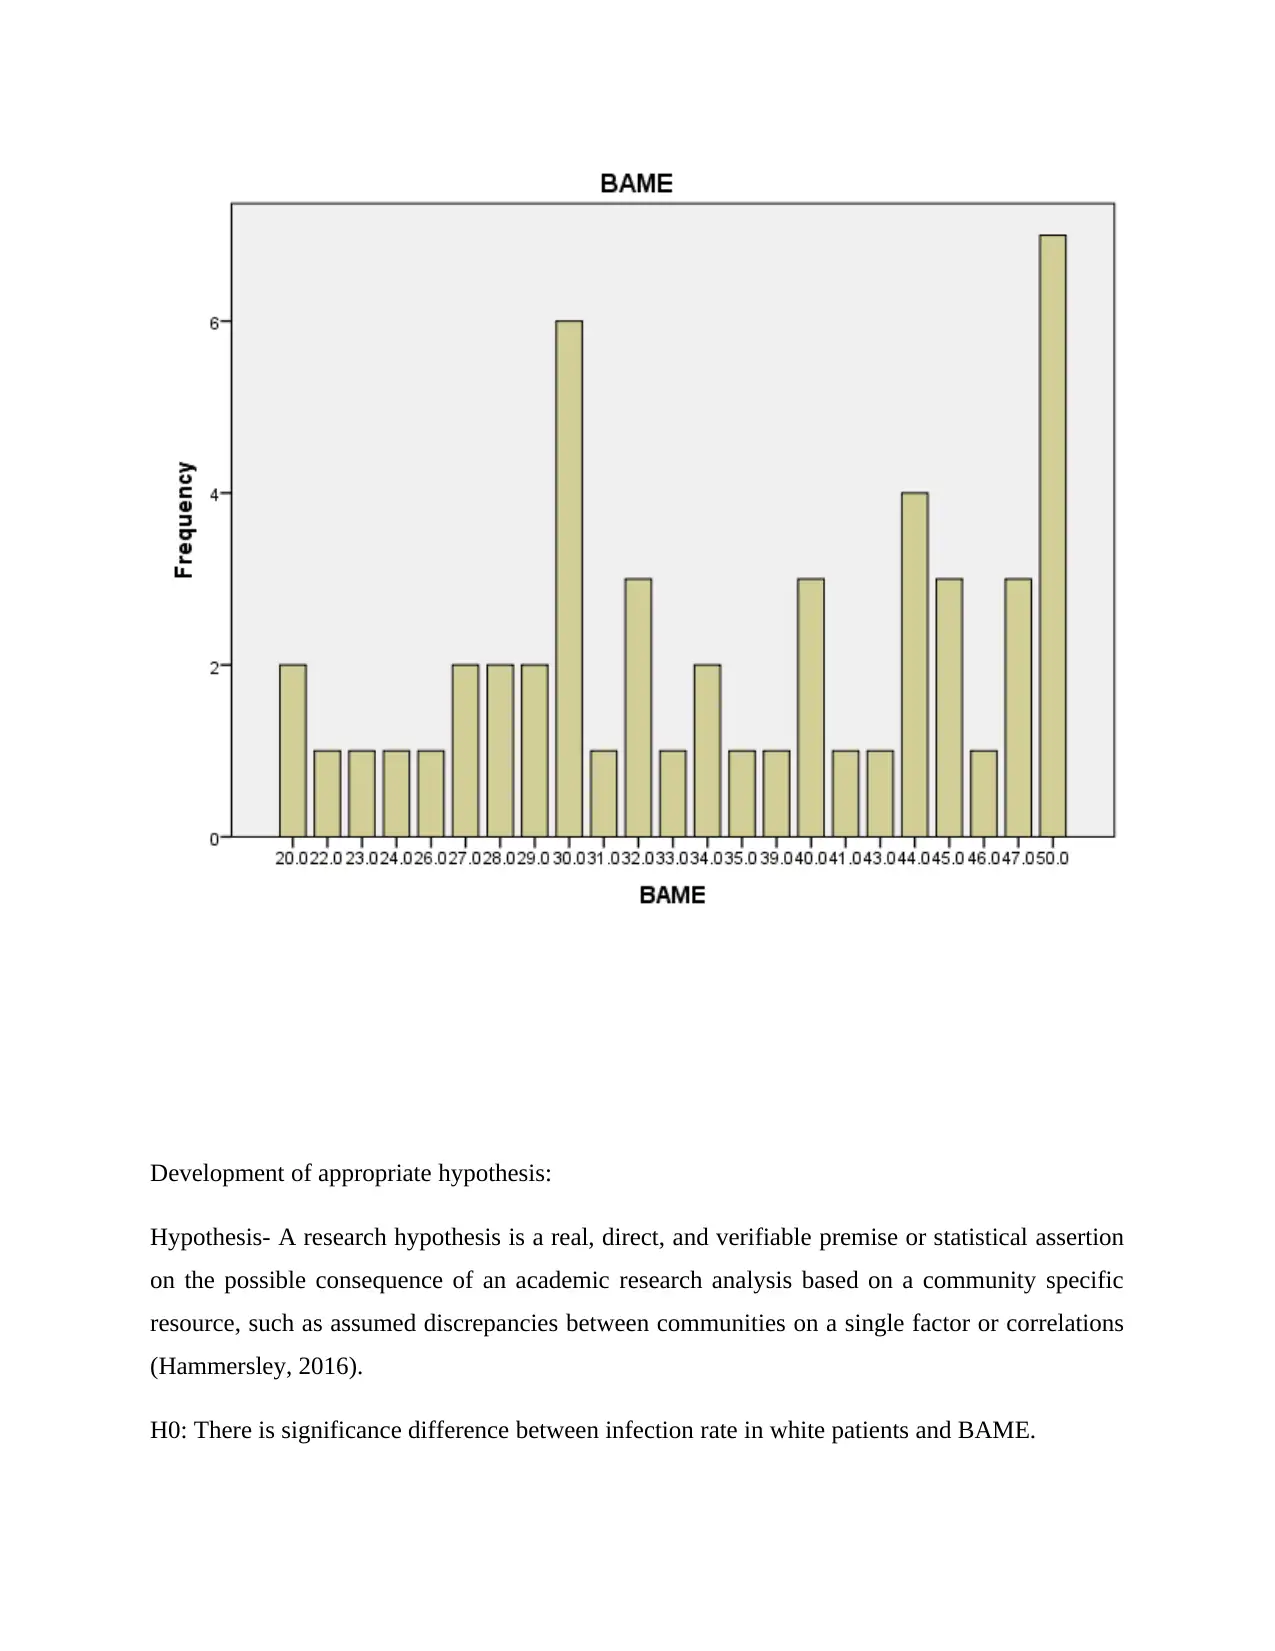
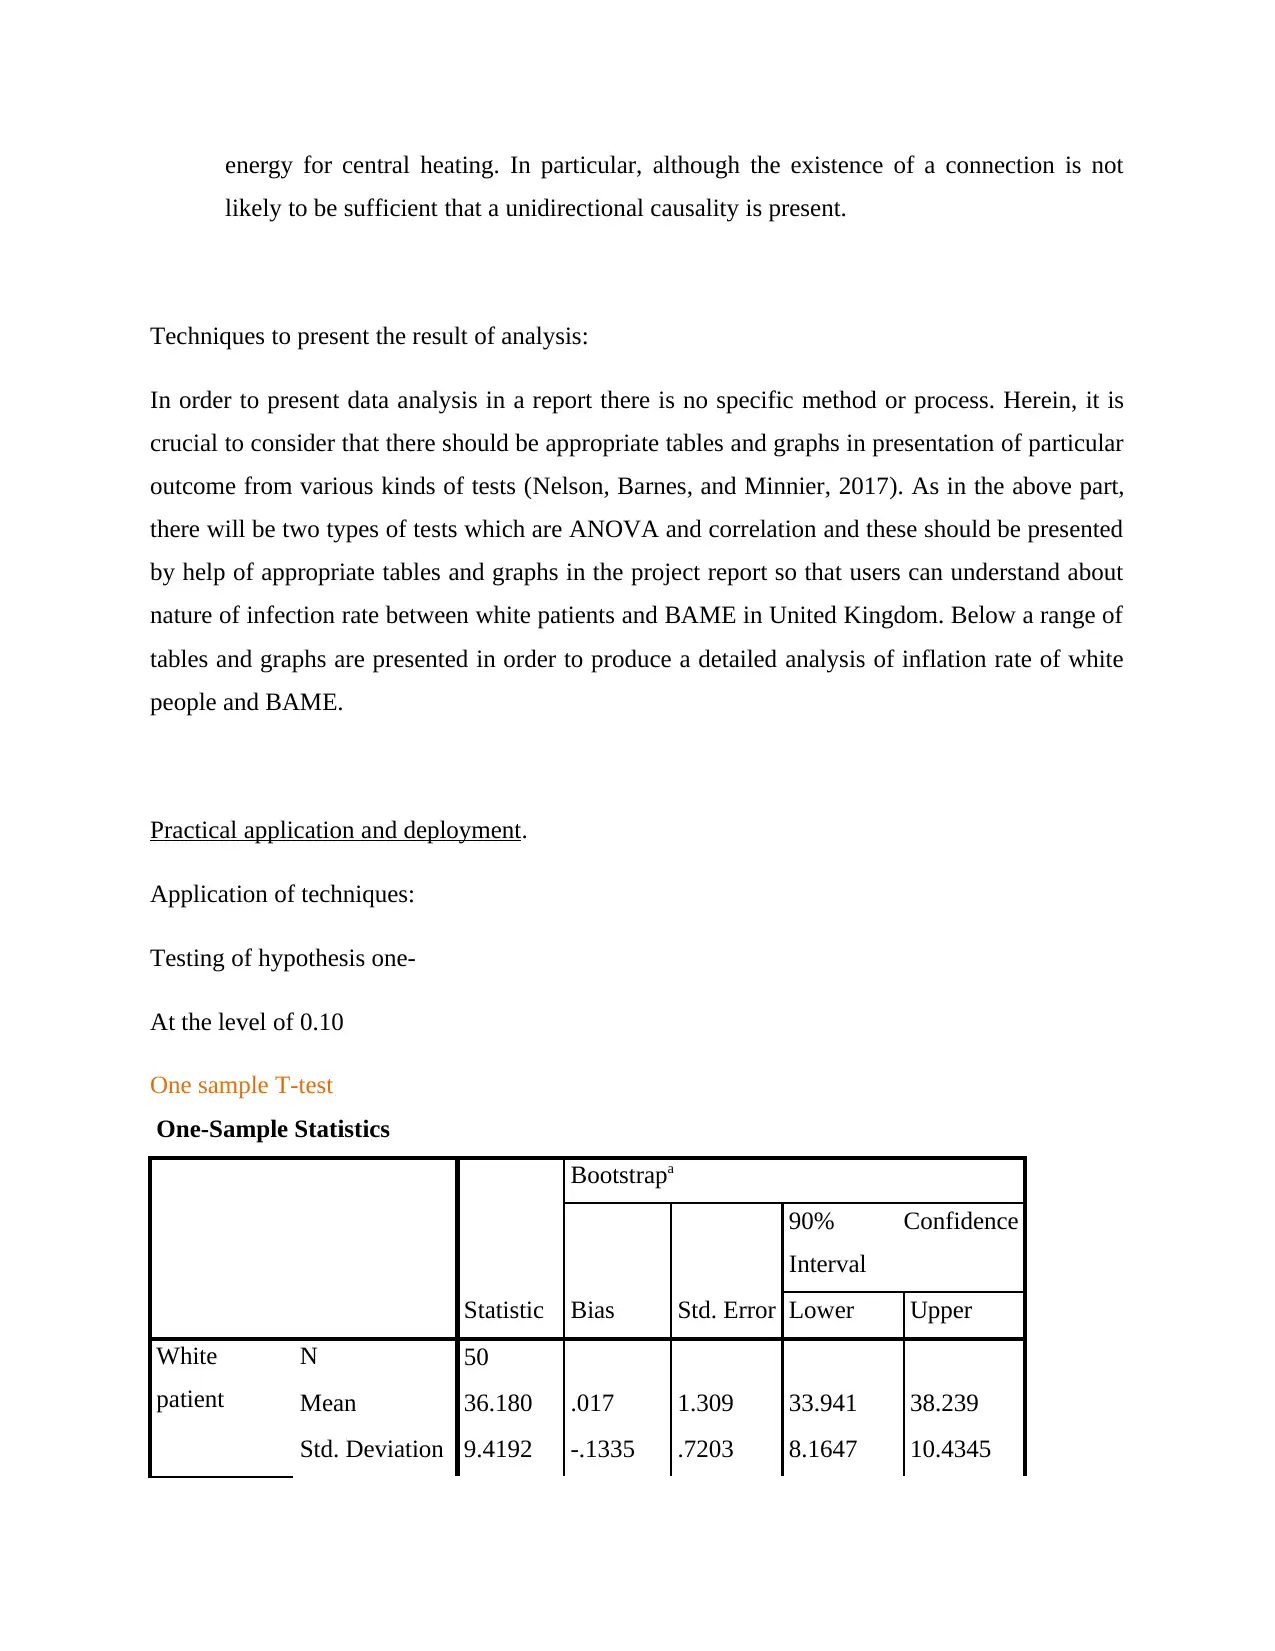
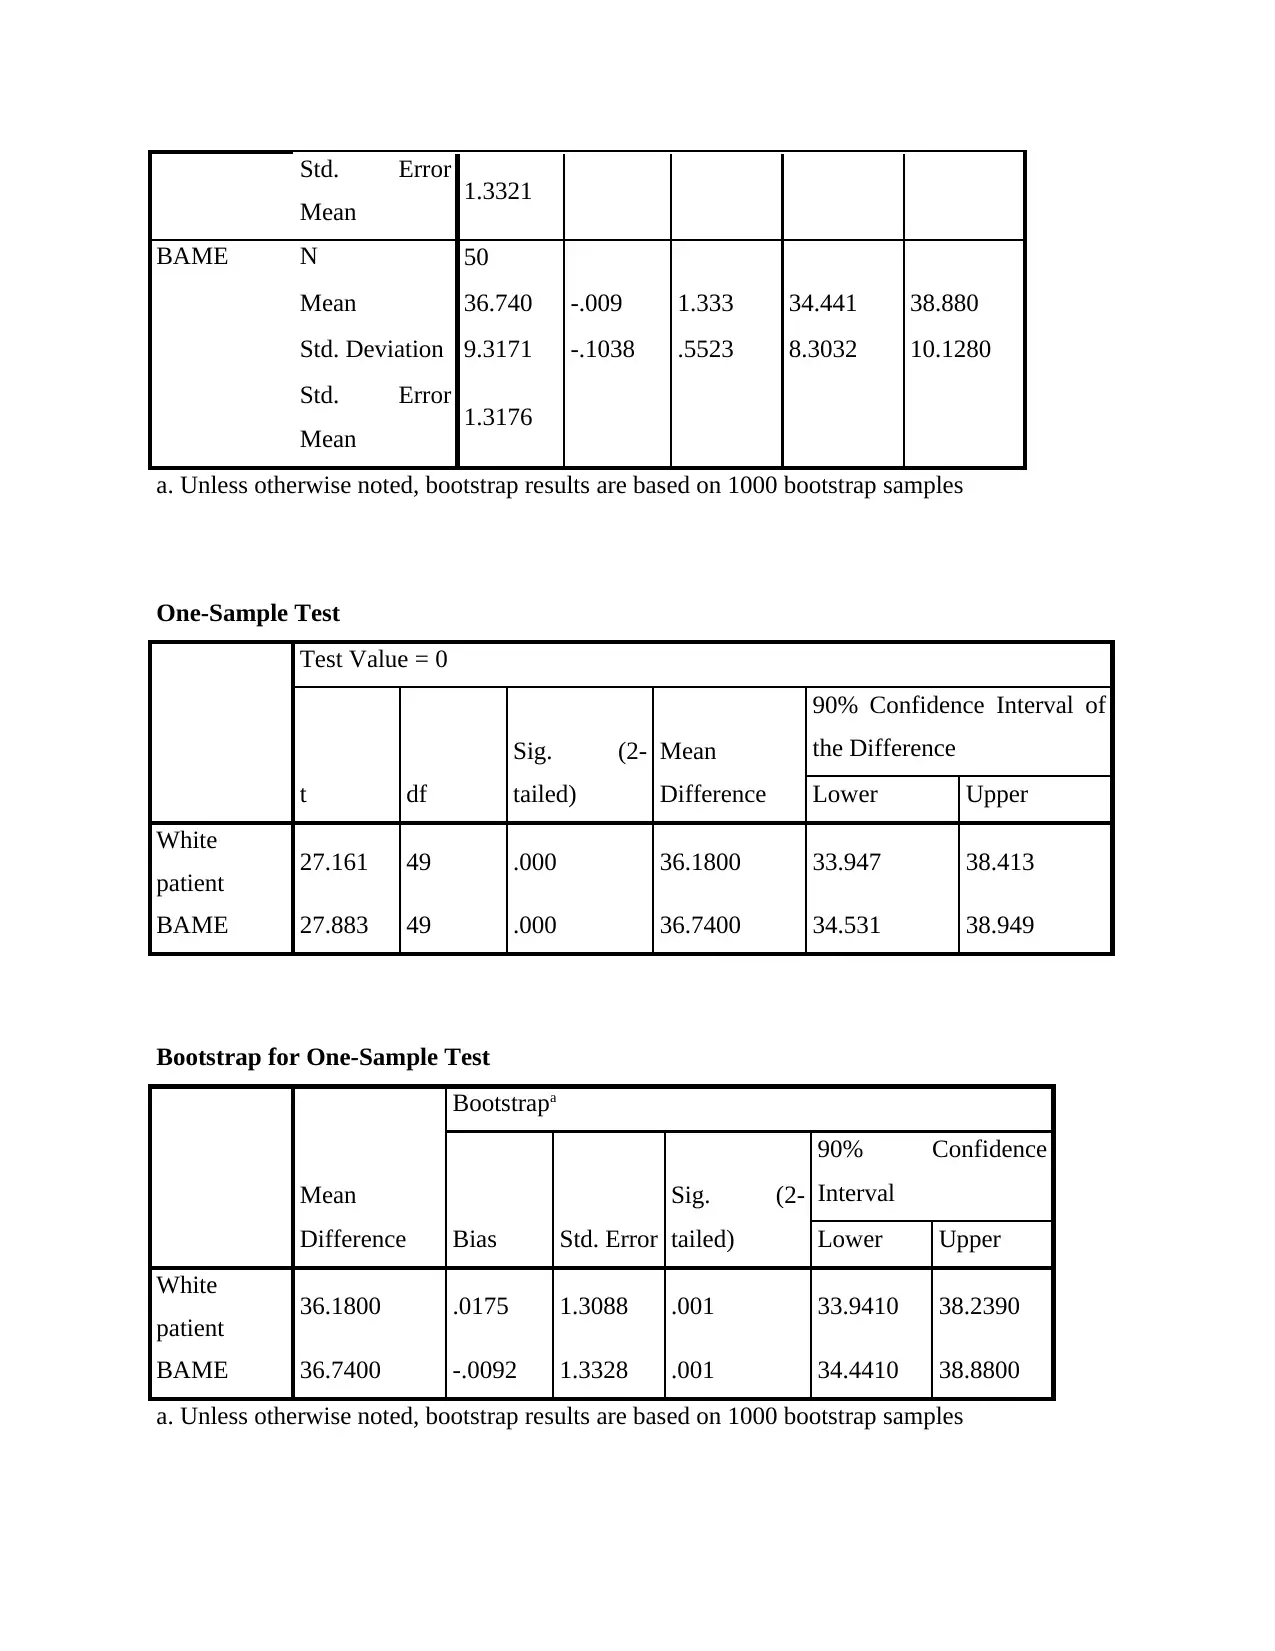
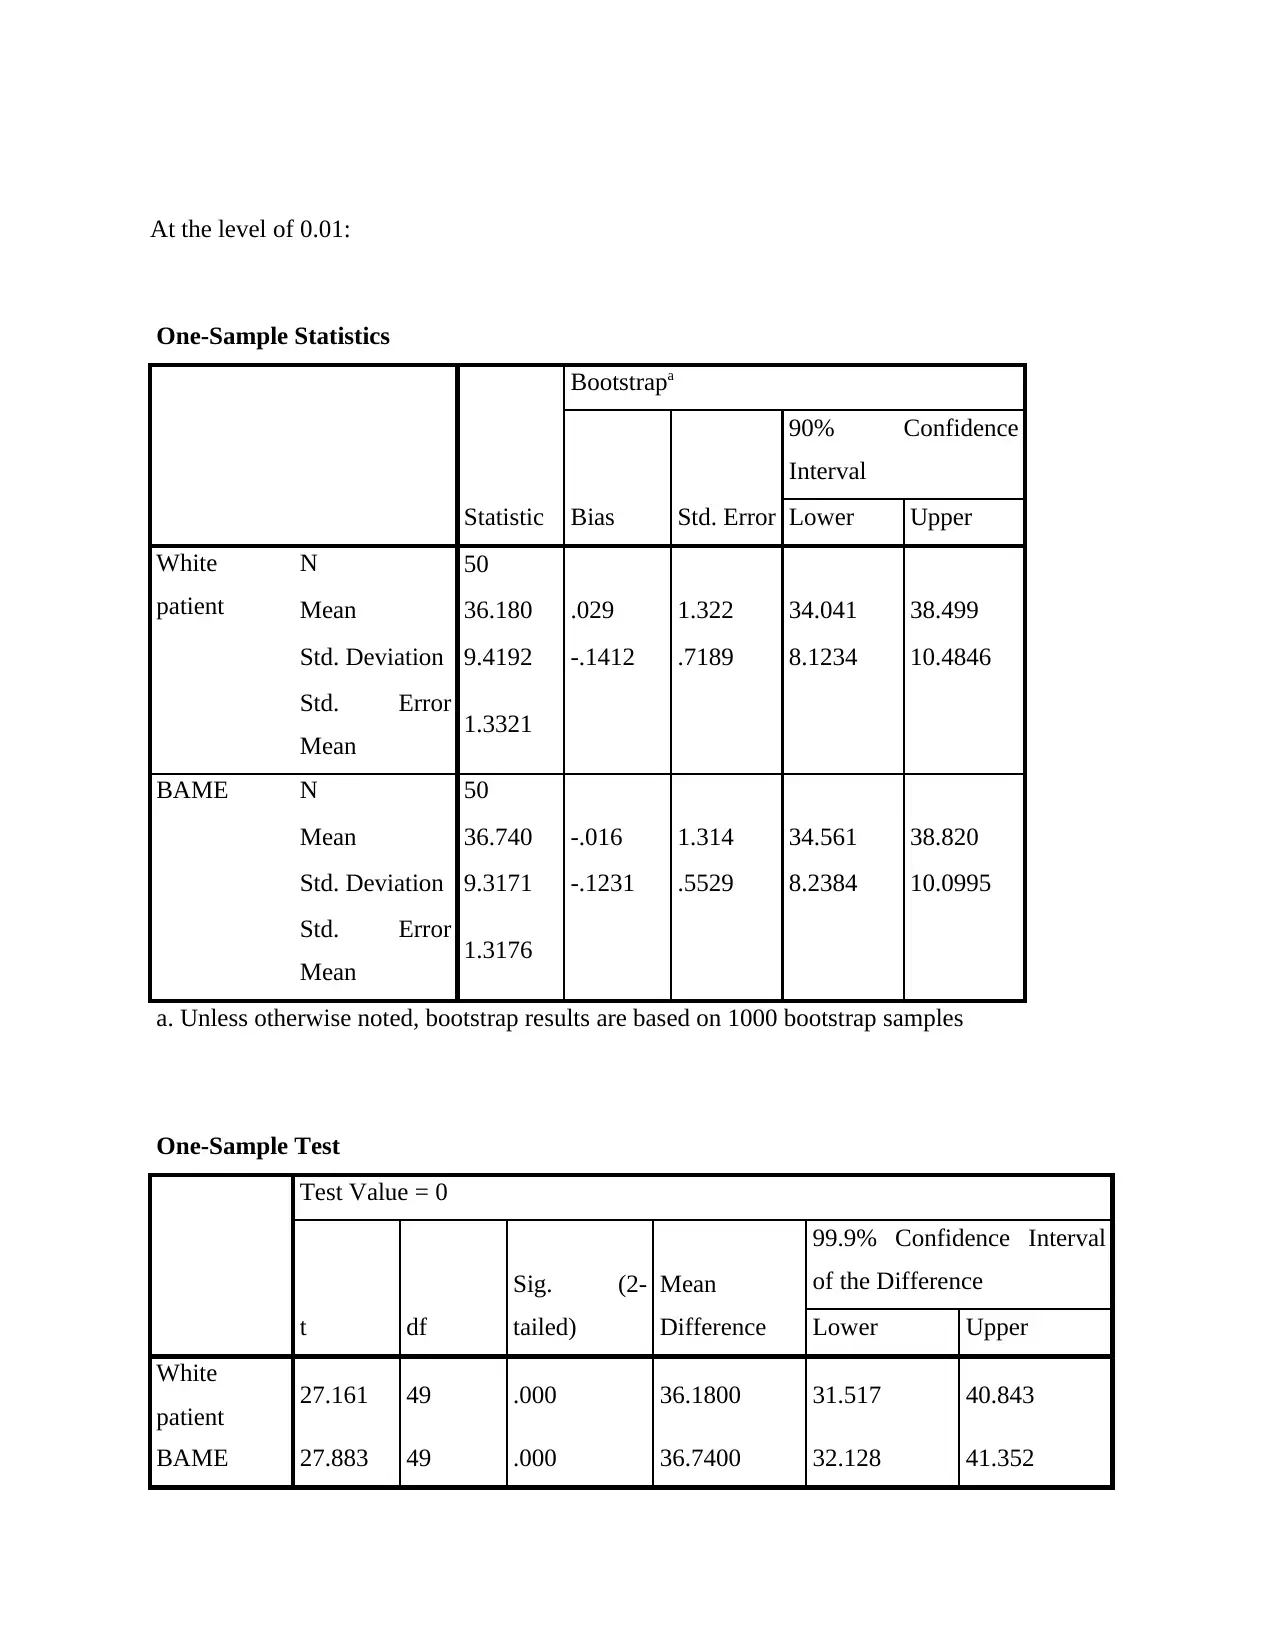
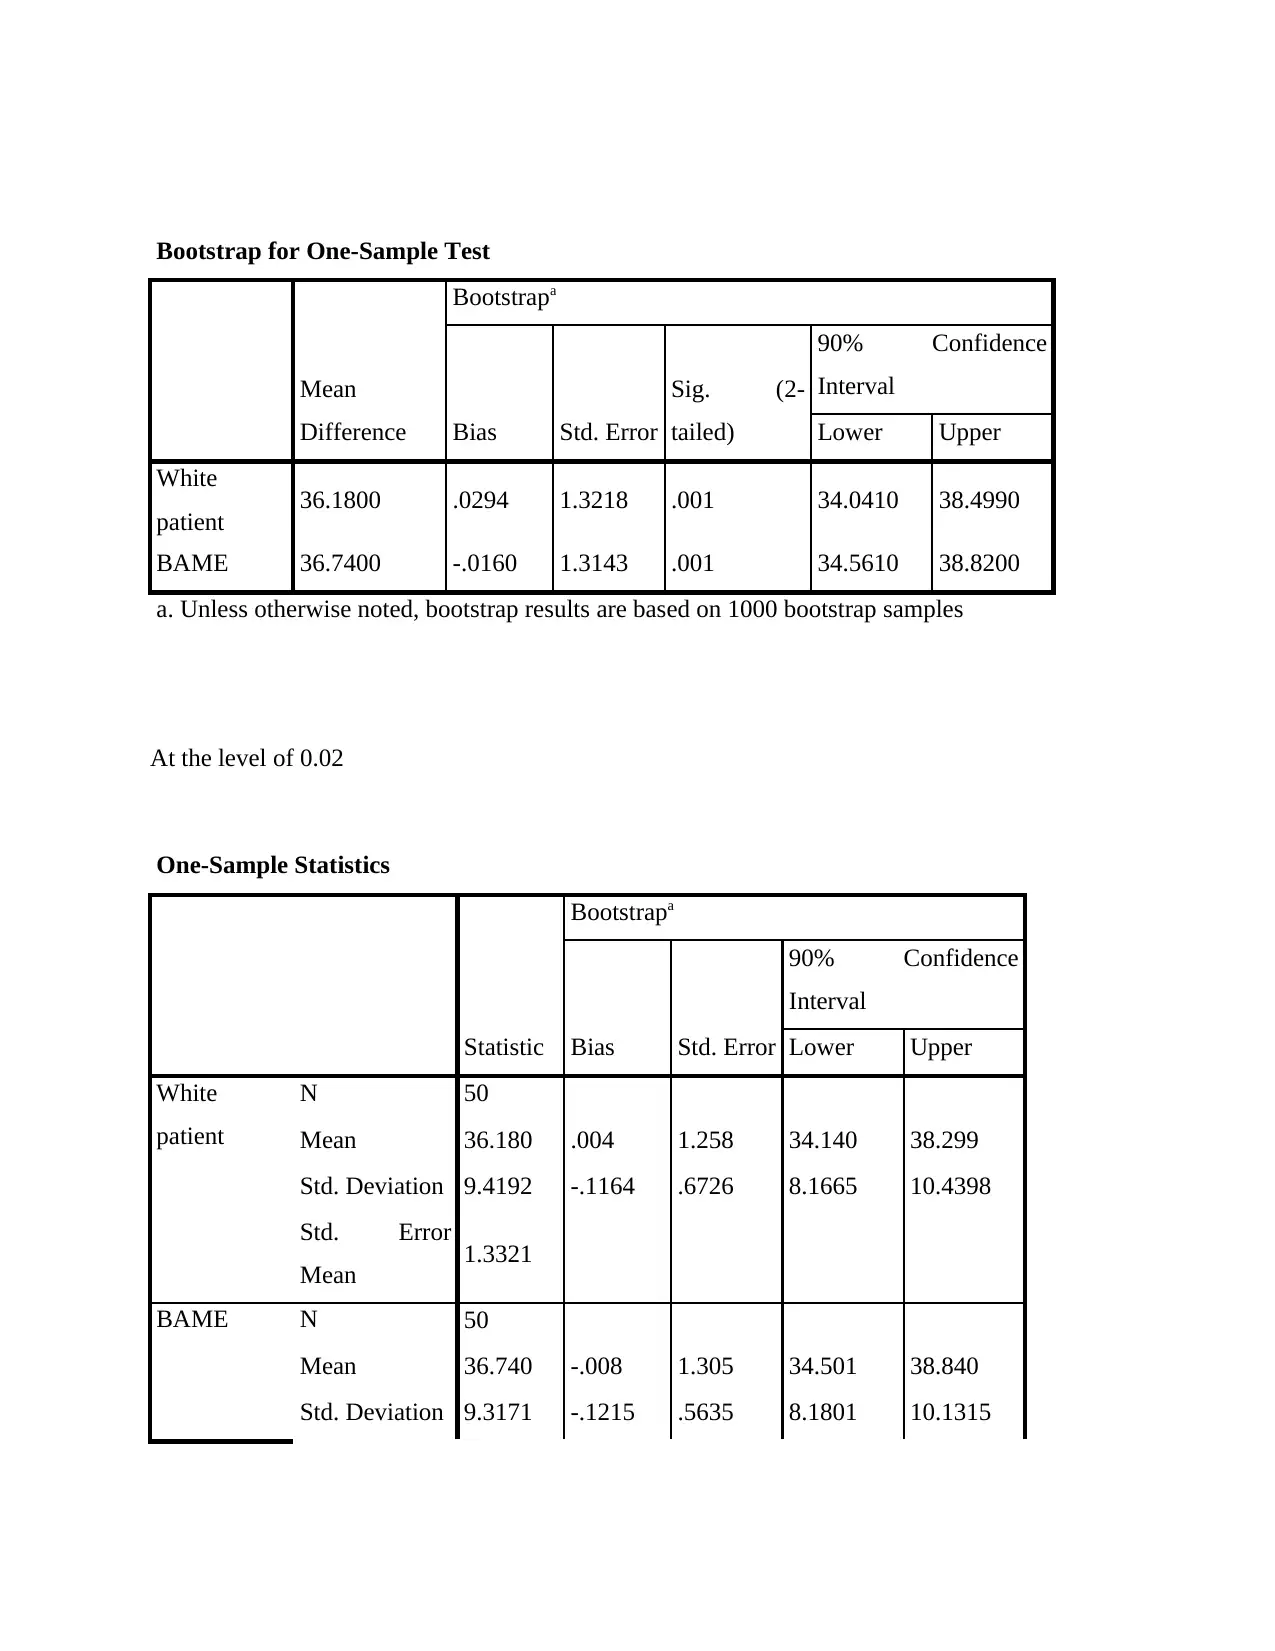
This report presents an analysis of COVID-19 infection rates among white and BAME (Black, Asian, and Minority Ethnic) patients in the UK, based on a dataset of 50 individuals. The analysis begins with descriptive statistics, including mean, median, mode, standard deviation, and frequency distributions for both patient groups. The report formulates and tests hypotheses to determine if there are significant differences in infection rates between the two groups. Statistical methods employed include one-sample t-tests and correlation analysis. The results are presented using tables and graphs, providing insights into the relationship between patient ethnicity and COVID-19 infection rates. The findings suggest a significant difference in infection rates and a correlation between the groups, offering valuable insights into the impact of COVID-19 on different populations.

ACCB4002 Data Analysis and Visualization
Paraphrase This Document
Need a fresh take? Get an instant paraphrase of this document with our AI Paraphraser

Contents
INTRODUCTION.......................................................................................................................................3
MAIN BODY..............................................................................................................................................3
Analysis...................................................................................................................................................3
Practical application and deployment......................................................................................................9
CONCLUSION.........................................................................................................................................15
REFERENCES..........................................................................................................................................16

INTRODUCTION
The report is based on analysis of infection rate of COVID– 19 are varied between white people
and BAME in the UK. The data is based on 50 different white and BAME patients. The report
contains detailed given data set in order to determine which types of patients affected more from
COVID 19. In order to do so various kinds of hypothesis are prepared that are tested from a
suitable statistical testes.
MAIN BODY
Analysis
Description of data set.
The given data set is about 50 people who are from different age group. The age is between 20 to
50 years. In the data set, infection rate of various kinds of people who are of white and BAME is
mentioned. The objective of data set is to assess ratio of infection rate of both types of people
including white and BAME (Black, Asian and Minority Ethnic) people. Below descriptive
analysis of given data is done in such manner:
The analysis of historical data to help explain improvements that have happened in an
organization is descriptive analytics (Borrill, Ramirez-Gonzalez and Uauy, 2016). The use of a
set of historical data to make parallels is represented in Descriptive analytics.
Descriptive statistics:
Statistics
White
patient BAME
N Valid 50 50
Missing 0 0
Mean 36.180 36.740
Median 36.000 34.500
⊘ This is a preview!⊘
Do you want full access?
Subscribe today to unlock all pages.

Trusted by 1+ million students worldwide

Mode 20.0a 50.0
Std. Deviation 9.4192 9.3171
Variance 88.722 86.809
a. Multiple modes exist. The smallest
value is shown
White patient
Frequency Percent
Valid
Percent
Cumulative
Percent
Valid 20.0 4 8.0 8.0 8.0
22.0 2 4.0 4.0 12.0
25.0 2 4.0 4.0 16.0
26.0 1 2.0 2.0 18.0
27.0 2 4.0 4.0 22.0
28.0 1 2.0 2.0 24.0
29.0 1 2.0 2.0 26.0
30.0 2 4.0 4.0 30.0
32.0 1 2.0 2.0 32.0
33.0 4 8.0 8.0 40.0
34.0 2 4.0 4.0 44.0
35.0 3 6.0 6.0 50.0
37.0 2 4.0 4.0 54.0
38.0 2 4.0 4.0 58.0
40.0 4 8.0 8.0 66.0
42.0 1 2.0 2.0 68.0
43.0 4 8.0 8.0 76.0
44.0 3 6.0 6.0 82.0
45.0 1 2.0 2.0 84.0
Paraphrase This Document
Need a fresh take? Get an instant paraphrase of this document with our AI Paraphraser

48.0 2 4.0 4.0 88.0
49.0 1 2.0 2.0 90.0
50.0 4 8.0 8.0 98.0
55.0 1 2.0 2.0 100.0
Total 50 100.0 100.0
BAME
Frequency Percent
Valid
Percent
Cumulative
Percent
Valid 20.0 2 4.0 4.0 4.0
22.0 1 2.0 2.0 6.0
23.0 1 2.0 2.0 8.0
24.0 1 2.0 2.0 10.0
26.0 1 2.0 2.0 12.0
27.0 2 4.0 4.0 16.0
28.0 2 4.0 4.0 20.0
29.0 2 4.0 4.0 24.0
30.0 6 12.0 12.0 36.0
31.0 1 2.0 2.0 38.0
32.0 3 6.0 6.0 44.0
33.0 1 2.0 2.0 46.0
34.0 2 4.0 4.0 50.0
35.0 1 2.0 2.0 52.0
39.0 1 2.0 2.0 54.0
40.0 3 6.0 6.0 60.0
41.0 1 2.0 2.0 62.0
43.0 1 2.0 2.0 64.0
44.0 4 8.0 8.0 72.0

45.0 3 6.0 6.0 78.0
46.0 1 2.0 2.0 80.0
47.0 3 6.0 6.0 86.0
50.0 7 14.0 14.0 100.0
Total 50 100.0 100.0
46.0 1 2.0 2.0 80.0
47.0 3 6.0 6.0 86.0
50.0 7 14.0 14.0 100.0
Total 50 100.0 100.0
⊘ This is a preview!⊘
Do you want full access?
Subscribe today to unlock all pages.

Trusted by 1+ million students worldwide

Development of appropriate hypothesis:
Hypothesis- A research hypothesis is a real, direct, and verifiable premise or statistical assertion
on the possible consequence of an academic research analysis based on a community specific
resource, such as assumed discrepancies between communities on a single factor or correlations
(Hammersley, 2016).
H0: There is significance difference between infection rate in white patients and BAME.
Paraphrase This Document
Need a fresh take? Get an instant paraphrase of this document with our AI Paraphraser

H1: There is no significance difference between infection rate in white patients and BAME.
H0: There is relation between infection rate in white patients and BAME.
H1: There is no relation between infection rate in white patients and BAME.
Techniques to perform the analysis:
There are range of methods and techniques to perform the analysis and ANOVA test is one of
the useful methods to measure significant difference in a particular data set. Apart from this,
correlation analysis is also an essential method to assess relation between given data set of white
patients and BAME.
ï‚· One sample T-test-A one-sample t-test is being used to check if a data obtained is
considerably different from any significance level. Every makes statements on how the
confidence interval meaning μ is linked to some significance level M. A t-test is a type of
descriptive analysis that is used to assess whether there is a substantial contrast between
the different measures that can be attributed to certain characteristics (McCormick and
Salcedo, 2017). It is used if the data sets live up to expectations and may have unexpected
differences, such as the sample group recorded as a consequence of 100 times spinning
the dice. A t-test was used as a principle assessment tool, which enables testing of even
an assumption unique to a community.
ï‚· Correlation- In statistics, any statistical association, whether reciprocal or not, between
two or more variables or multivariate data is association or dependency. Correlation is
any clear relationship in the broadest terms, although it generally refers to the extent with
which a set of parameters are linearly connected (Zuo, Carranza and Wang, 2016).
Correlations are useful since a statistical association that can be manipulated in action can
be suggested. For instance, show the correlation between generation capacity and
weather, an electricity utility could generate less capacity on a mild day. There is indeed
a causal correlation in this case, since severe weather induces individuals to use more

energy for central heating. In particular, although the existence of a connection is not
likely to be sufficient that a unidirectional causality is present.
Techniques to present the result of analysis:
In order to present data analysis in a report there is no specific method or process. Herein, it is
crucial to consider that there should be appropriate tables and graphs in presentation of particular
outcome from various kinds of tests (Nelson, Barnes, and Minnier, 2017). As in the above part,
there will be two types of tests which are ANOVA and correlation and these should be presented
by help of appropriate tables and graphs in the project report so that users can understand about
nature of infection rate between white patients and BAME in United Kingdom. Below a range of
tables and graphs are presented in order to produce a detailed analysis of inflation rate of white
people and BAME.
Practical application and deployment.
Application of techniques:
Testing of hypothesis one-
At the level of 0.10
One sample T-test
One-Sample Statistics
Statistic
Bootstrapa
Bias Std. Error
90% Confidence
Interval
Lower Upper
White
patient
N 50
Mean 36.180 .017 1.309 33.941 38.239
Std. Deviation 9.4192 -.1335 .7203 8.1647 10.4345
⊘ This is a preview!⊘
Do you want full access?
Subscribe today to unlock all pages.

Trusted by 1+ million students worldwide

Std. Error
Mean 1.3321
BAME N 50
Mean 36.740 -.009 1.333 34.441 38.880
Std. Deviation 9.3171 -.1038 .5523 8.3032 10.1280
Std. Error
Mean 1.3176
a. Unless otherwise noted, bootstrap results are based on 1000 bootstrap samples
One-Sample Test
Test Value = 0
t df
Sig. (2-
tailed)
Mean
Difference
90% Confidence Interval of
the Difference
Lower Upper
White
patient 27.161 49 .000 36.1800 33.947 38.413
BAME 27.883 49 .000 36.7400 34.531 38.949
Bootstrap for One-Sample Test
Mean
Difference
Bootstrapa
Bias Std. Error
Sig. (2-
tailed)
90% Confidence
Interval
Lower Upper
White
patient 36.1800 .0175 1.3088 .001 33.9410 38.2390
BAME 36.7400 -.0092 1.3328 .001 34.4410 38.8800
a. Unless otherwise noted, bootstrap results are based on 1000 bootstrap samples
Paraphrase This Document
Need a fresh take? Get an instant paraphrase of this document with our AI Paraphraser

At the level of 0.01:
One-Sample Statistics
Statistic
Bootstrapa
Bias Std. Error
90% Confidence
Interval
Lower Upper
White
patient
N 50
Mean 36.180 .029 1.322 34.041 38.499
Std. Deviation 9.4192 -.1412 .7189 8.1234 10.4846
Std. Error
Mean 1.3321
BAME N 50
Mean 36.740 -.016 1.314 34.561 38.820
Std. Deviation 9.3171 -.1231 .5529 8.2384 10.0995
Std. Error
Mean 1.3176
a. Unless otherwise noted, bootstrap results are based on 1000 bootstrap samples
One-Sample Test
Test Value = 0
t df
Sig. (2-
tailed)
Mean
Difference
99.9% Confidence Interval
of the Difference
Lower Upper
White
patient 27.161 49 .000 36.1800 31.517 40.843
BAME 27.883 49 .000 36.7400 32.128 41.352

Bootstrap for One-Sample Test
Mean
Difference
Bootstrapa
Bias Std. Error
Sig. (2-
tailed)
90% Confidence
Interval
Lower Upper
White
patient 36.1800 .0294 1.3218 .001 34.0410 38.4990
BAME 36.7400 -.0160 1.3143 .001 34.5610 38.8200
a. Unless otherwise noted, bootstrap results are based on 1000 bootstrap samples
At the level of 0.02
One-Sample Statistics
Statistic
Bootstrapa
Bias Std. Error
90% Confidence
Interval
Lower Upper
White
patient
N 50
Mean 36.180 .004 1.258 34.140 38.299
Std. Deviation 9.4192 -.1164 .6726 8.1665 10.4398
Std. Error
Mean 1.3321
BAME N 50
Mean 36.740 -.008 1.305 34.501 38.840
Std. Deviation 9.3171 -.1215 .5635 8.1801 10.1315
⊘ This is a preview!⊘
Do you want full access?
Subscribe today to unlock all pages.

Trusted by 1+ million students worldwide
1 out of 16
Related Documents

Your All-in-One AI-Powered Toolkit for Academic Success.
 +13062052269
info@desklib.com
Available 24*7 on WhatsApp / Email
Unlock your academic potential
© 2024  |  Zucol Services PVT LTD  |  All rights reserved.