Thomas Cook: Business Decision Making and New Tour Product Launch
VerifiedAdded on 2023/04/04
|22
|3550
|397
Report
AI Summary
This report examines business decision-making within Thomas Cook, focusing on the development of a new tour product. It details the plan for data collection, including primary and secondary sources, survey methodology using random sampling with a questionnaire administered to 90 London customers, and the sampling framework. The analysis includes measures of central tendency (mean, median, mode) and dispersion (interquartile range, standard deviation) to understand consumer preferences and budget considerations. Charts and interpretations are provided to visualize and explain the data. The report also touches on project planning aspects for launching the new tour product, including information processing tools, critical path analysis, and project evaluation methods, to guide strategic decision-making and product development for Thomas Cook. The study highlights the importance of understanding consumer behavior and market trends for successful product development.
Business Decision Making
Paraphrase This Document
Need a fresh take? Get an instant paraphrase of this document with our AI Paraphraser
TABLE OF CONTENTS
Introduction.................................................................................................................................................3
Task 1..........................................................................................................................................................3
1.1 Plan for data collection......................................................................................................................3
1.2 Survey methodology and sampling framework.................................................................................4
1.3 Questionnaire....................................................................................................................................4
Task 2..........................................................................................................................................................6
2.1 Measures of central tendency..........................................................................................................6
2.2 Analysis of results.............................................................................................................................7
2.3 Measures of dispersion.....................................................................................................................7
2.4 Quartile, percentile and correlation coefficient...............................................................................8
TASK3...........................................................................................................................................................9
3.2 trend line.........................................................................................................................................13
3.3 Business presentation......................................................................................................................14
3.4 Business report for new product development...............................................................................14
Task 4........................................................................................................................................................15
4.1 Information processing tool for the launch of a new tour product.................................................15
4.2 Project plan and critical path...........................................................................................................15
1. 4.3 Project evaluation method.....................................................................................................19
Conclusion.................................................................................................................................................20
References.................................................................................................................................................21
Introduction
Future of an organization completely depends upon the business decisions. It can be
related to assets, liability, investment etc. For accomplishing the objective entity has to opt the
best option through which it can meet with its target. Present report is based on the Thomas cook
which is an international tour operator and working tremendous in the travel and tourism
industry. Survey methodology and sampling frame related to business will be described in this
assignment (Bharadwaj and et.al, 2013). Current assignment will discuss the sources of primary
and secondary data collection for the new tour products. In order to gather information related to
consumer profile, preferences, buying behavior questionnaire will be prepared by the researcher.
Data will be collected from 90 customers and this information will be analyzed in this study.
Mean, mode, median, standard deviation, investment tools will be calculated in this report for
making the sound business decision so that company can make its new tour product more
successful and can achieve its target significantly (Cao, Duan and Li 2015).
Task 1
1.1 Plan for data collection
In the modern life, people have high interest in the holidays and travel. They like to visit
new places and attractive points etc. In technological era most of the tour operators are offering
them attractive tour packages. So it is essential for the Thomas cook that to know consumers
behavior, their needs, market trends in order to provide them satisfactory tour packages. For that
data will be collected by two sources; primary and secondary (Merigó. and Gil-Lafuente, 2012).
Primary sources
These are first hand information which are collected for specific subject matter by
researcher own. This is very important tool and can give real detail about market trends and
needs of travelers. Several methods of primary sources are such as interview, survey, observation
etc. For developing the new tour product Thomas cook is required to gather information related
to major needs of consumers and what they expected to get. On the bases of this cited firm can
design its products and services. For collecting details survey is the great way and can help in
achieving goal of the company. Researcher can communicate with the customers via email,
⊘ This is a preview!⊘
Do you want full access?
Subscribe today to unlock all pages.
Trusted by 1+ million students worldwide
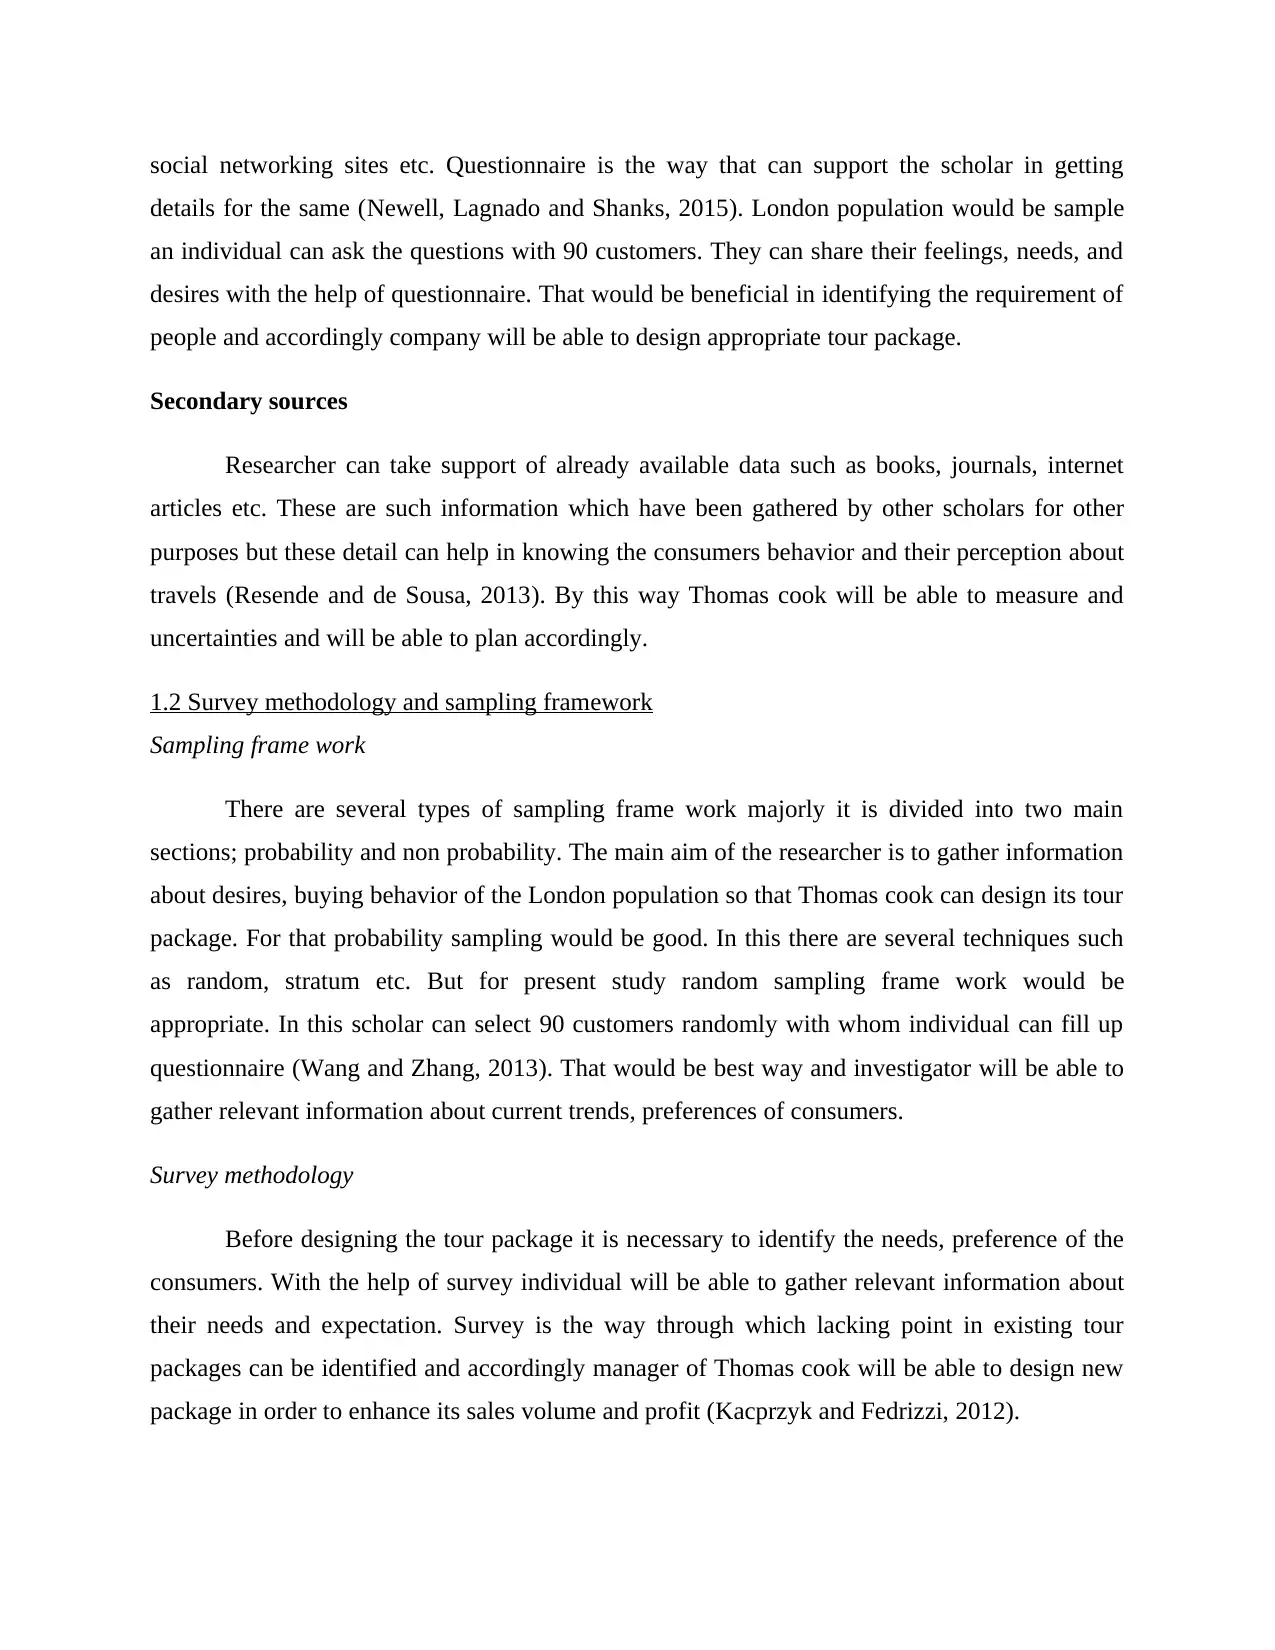
social networking sites etc. Questionnaire is the way that can support the scholar in getting
details for the same (Newell, Lagnado and Shanks, 2015). London population would be sample
an individual can ask the questions with 90 customers. They can share their feelings, needs, and
desires with the help of questionnaire. That would be beneficial in identifying the requirement of
people and accordingly company will be able to design appropriate tour package.
Secondary sources
Researcher can take support of already available data such as books, journals, internet
articles etc. These are such information which have been gathered by other scholars for other
purposes but these detail can help in knowing the consumers behavior and their perception about
travels (Resende and de Sousa, 2013). By this way Thomas cook will be able to measure and
uncertainties and will be able to plan accordingly.
1.2 Survey methodology and sampling framework
Sampling frame work
There are several types of sampling frame work majorly it is divided into two main
sections; probability and non probability. The main aim of the researcher is to gather information
about desires, buying behavior of the London population so that Thomas cook can design its tour
package. For that probability sampling would be good. In this there are several techniques such
as random, stratum etc. But for present study random sampling frame work would be
appropriate. In this scholar can select 90 customers randomly with whom individual can fill up
questionnaire (Wang and Zhang, 2013). That would be best way and investigator will be able to
gather relevant information about current trends, preferences of consumers.
Survey methodology
Before designing the tour package it is necessary to identify the needs, preference of the
consumers. With the help of survey individual will be able to gather relevant information about
their needs and expectation. Survey is the way through which lacking point in existing tour
packages can be identified and accordingly manager of Thomas cook will be able to design new
package in order to enhance its sales volume and profit (Kacprzyk and Fedrizzi, 2012).
Paraphrase This Document
Need a fresh take? Get an instant paraphrase of this document with our AI Paraphraser
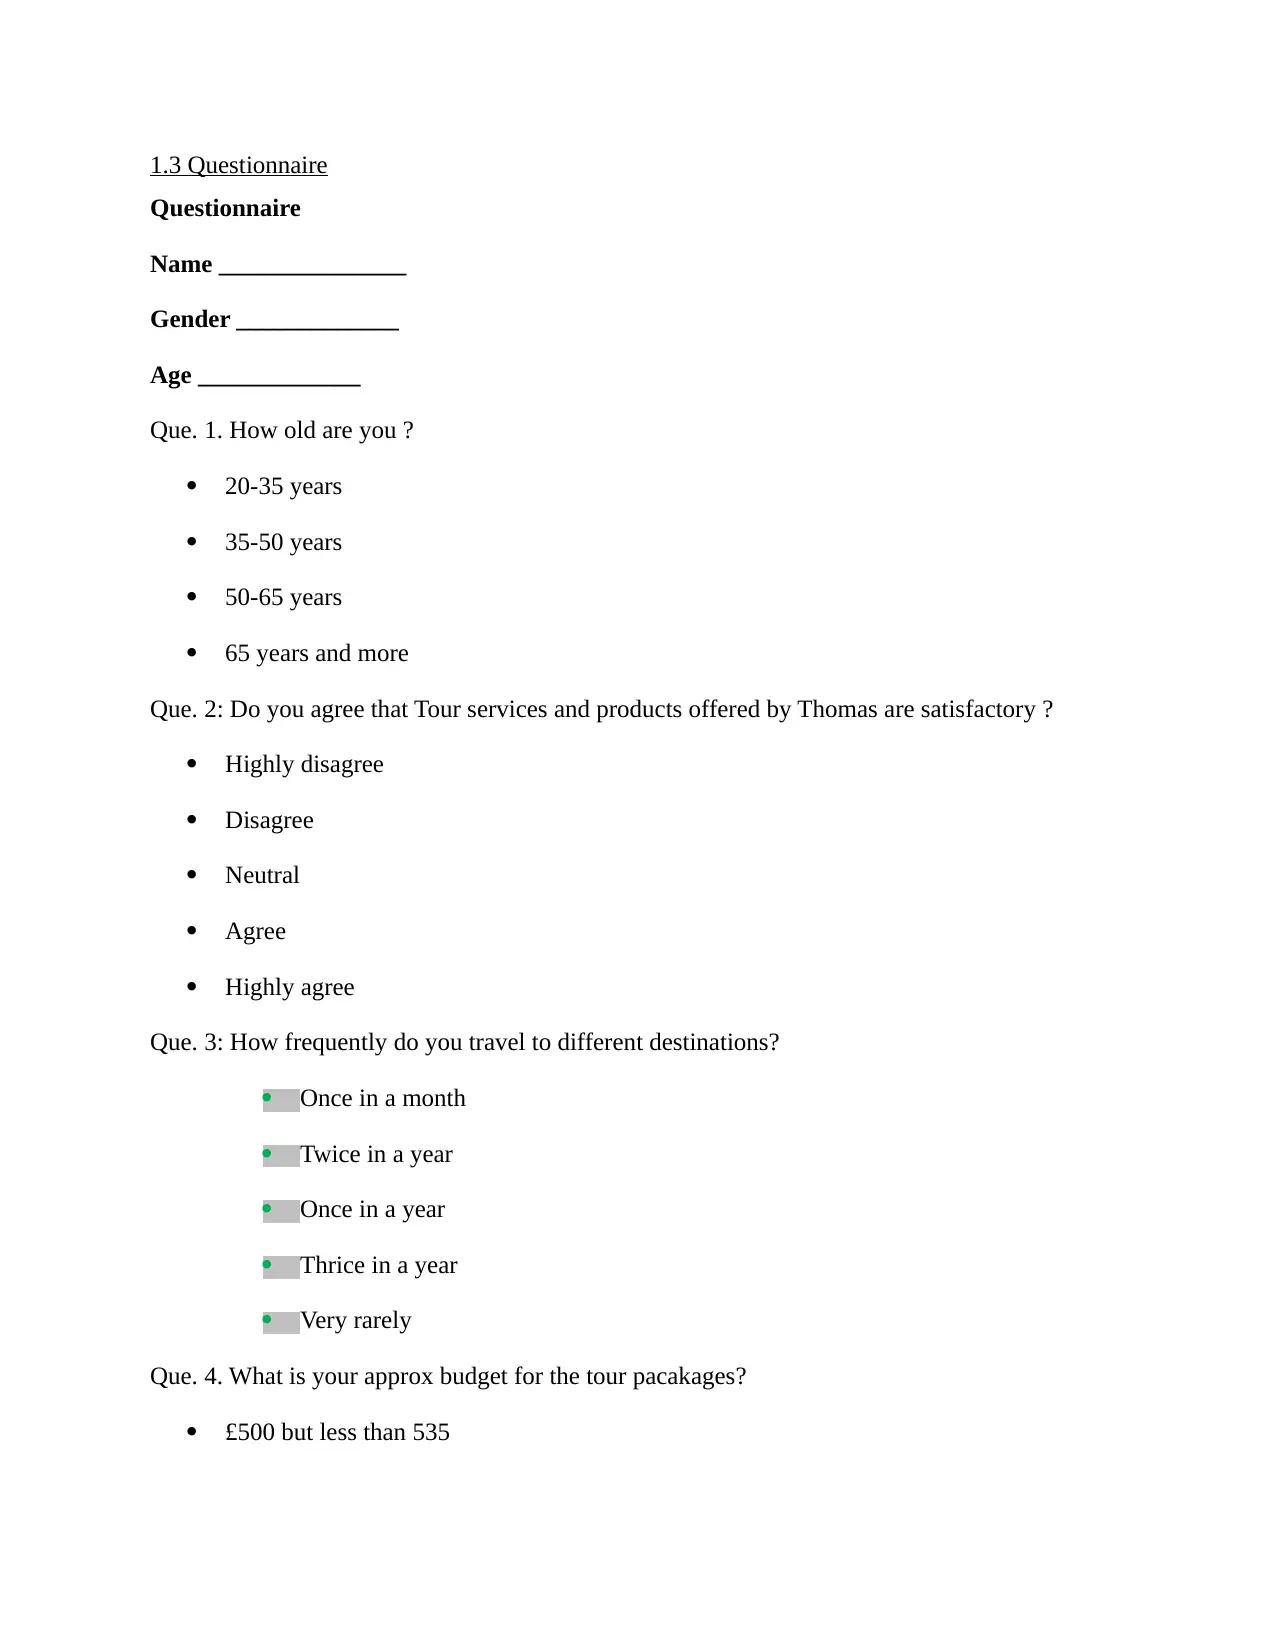
1.3 Questionnaire
Questionnaire
Name _______________
Gender _____________
Age _____________
Que. 1. How old are you ?
20-35 years
35-50 years
50-65 years
65 years and more
Que. 2: Do you agree that Tour services and products offered by Thomas are satisfactory ?
Highly disagree
Disagree
Neutral
Agree
Highly agree
Que. 3: How frequently do you travel to different destinations?
Once in a month
Twice in a year
Once in a year
Thrice in a year
Very rarely
Que. 4. What is your approx budget for the tour pacakages?
£500 but less than 535
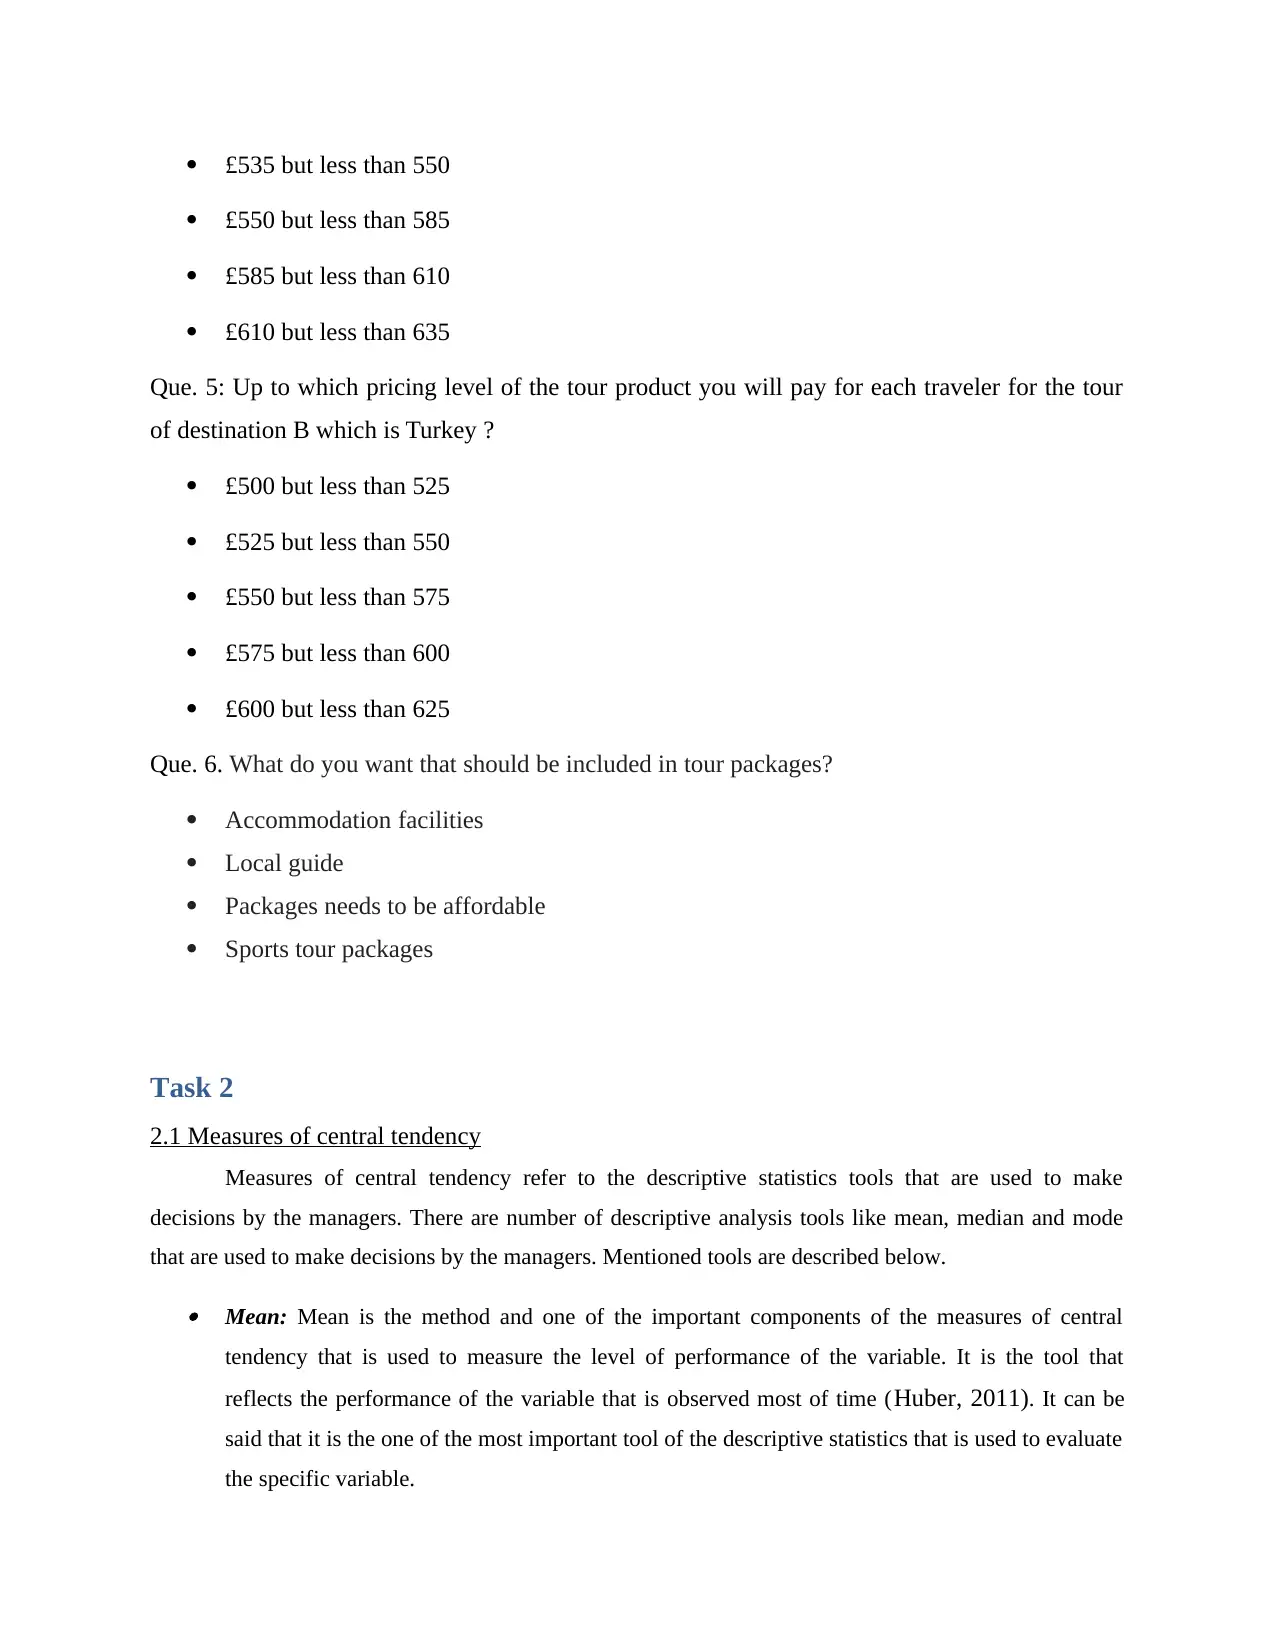
£535 but less than 550
£550 but less than 585
£585 but less than 610
£610 but less than 635
Que. 5: Up to which pricing level of the tour product you will pay for each traveler for the tour
of destination B which is Turkey ?
£500 but less than 525
£525 but less than 550
£550 but less than 575
£575 but less than 600
£600 but less than 625
Que. 6. What do you want that should be included in tour packages?
Accommodation facilities
Local guide
Packages needs to be affordable
Sports tour packages
Task 2
2.1 Measures of central tendency
Measures of central tendency refer to the descriptive statistics tools that are used to make
decisions by the managers. There are number of descriptive analysis tools like mean, median and mode
that are used to make decisions by the managers. Mentioned tools are described below. Mean: Mean is the method and one of the important components of the measures of central
tendency that is used to measure the level of performance of the variable. It is the tool that
reflects the performance of the variable that is observed most of time (Huber, 2011). It can be
said that it is the one of the most important tool of the descriptive statistics that is used to evaluate
the specific variable.
⊘ This is a preview!⊘
Do you want full access?
Subscribe today to unlock all pages.
Trusted by 1+ million students worldwide
Median: Median is tool that is used for division of the entire data set. In the specific set of
figures there are many different information’s that cannot be identified by an individual by taking
a single look on the data set. Mode: Mode is the tool that is used to find out pattern that is coming in existence multiple times
in the data set. It can be said that there is huge importance of the mode for the data scientists.
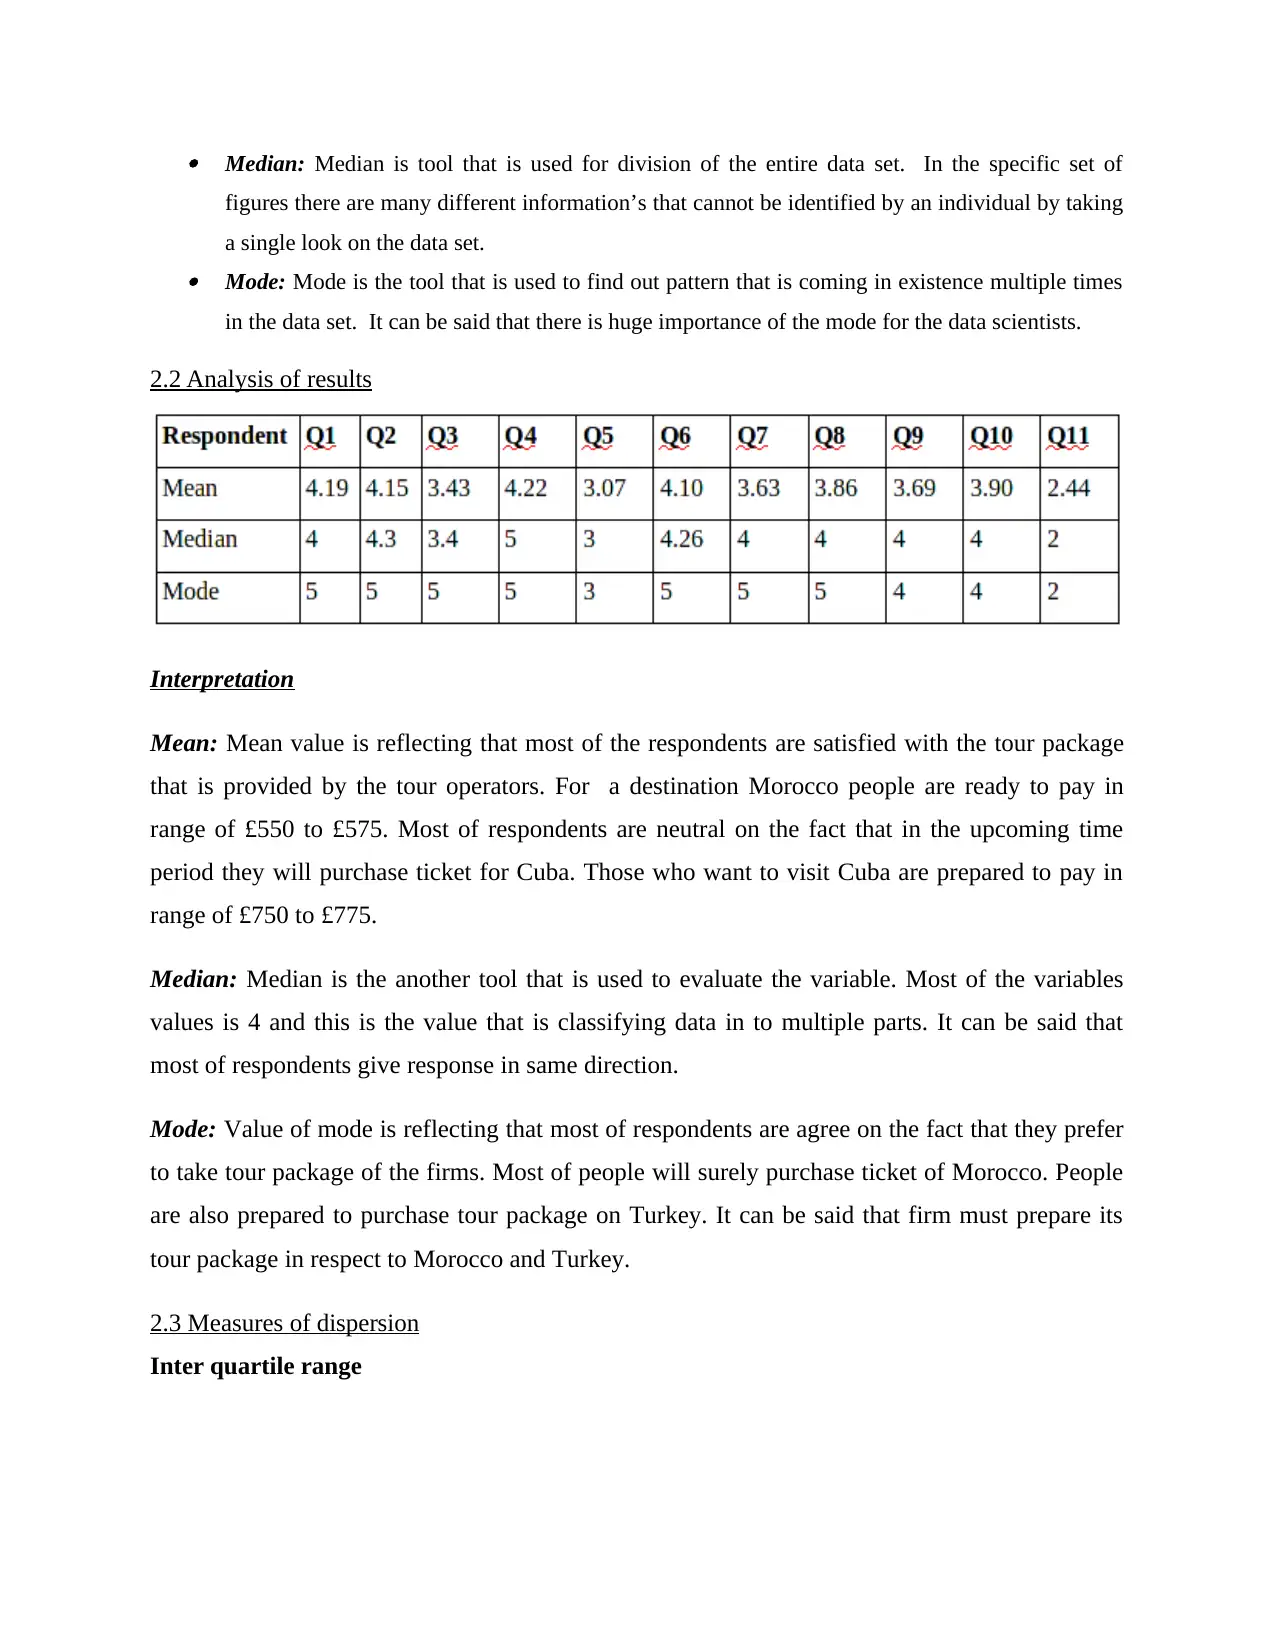
2.2 Analysis of results
Interpretation
Mean: Mean value is reflecting that most of the respondents are satisfied with the tour package
that is provided by the tour operators. For a destination Morocco people are ready to pay in
range of £550 to £575. Most of respondents are neutral on the fact that in the upcoming time
period they will purchase ticket for Cuba. Those who want to visit Cuba are prepared to pay in
range of £750 to £775.
Median: Median is the another tool that is used to evaluate the variable. Most of the variables
values is 4 and this is the value that is classifying data in to multiple parts. It can be said that
most of respondents give response in same direction.
Mode: Value of mode is reflecting that most of respondents are agree on the fact that they prefer
to take tour package of the firms. Most of people will surely purchase ticket of Morocco. People
are also prepared to purchase tour package on Turkey. It can be said that firm must prepare its
tour package in respect to Morocco and Turkey.
2.3 Measures of dispersion
Inter quartile range
figures there are many different information’s that cannot be identified by an individual by taking
a single look on the data set. Mode: Mode is the tool that is used to find out pattern that is coming in existence multiple times
in the data set. It can be said that there is huge importance of the mode for the data scientists.
2.2 Analysis of results
Interpretation
Mean: Mean value is reflecting that most of the respondents are satisfied with the tour package
that is provided by the tour operators. For a destination Morocco people are ready to pay in
range of £550 to £575. Most of respondents are neutral on the fact that in the upcoming time
period they will purchase ticket for Cuba. Those who want to visit Cuba are prepared to pay in
range of £750 to £775.
Median: Median is the another tool that is used to evaluate the variable. Most of the variables
values is 4 and this is the value that is classifying data in to multiple parts. It can be said that
most of respondents give response in same direction.
Mode: Value of mode is reflecting that most of respondents are agree on the fact that they prefer
to take tour package of the firms. Most of people will surely purchase ticket of Morocco. People
are also prepared to purchase tour package on Turkey. It can be said that firm must prepare its
tour package in respect to Morocco and Turkey.
2.3 Measures of dispersion
Inter quartile range
Paraphrase This Document
Need a fresh take? Get an instant paraphrase of this document with our AI Paraphraser
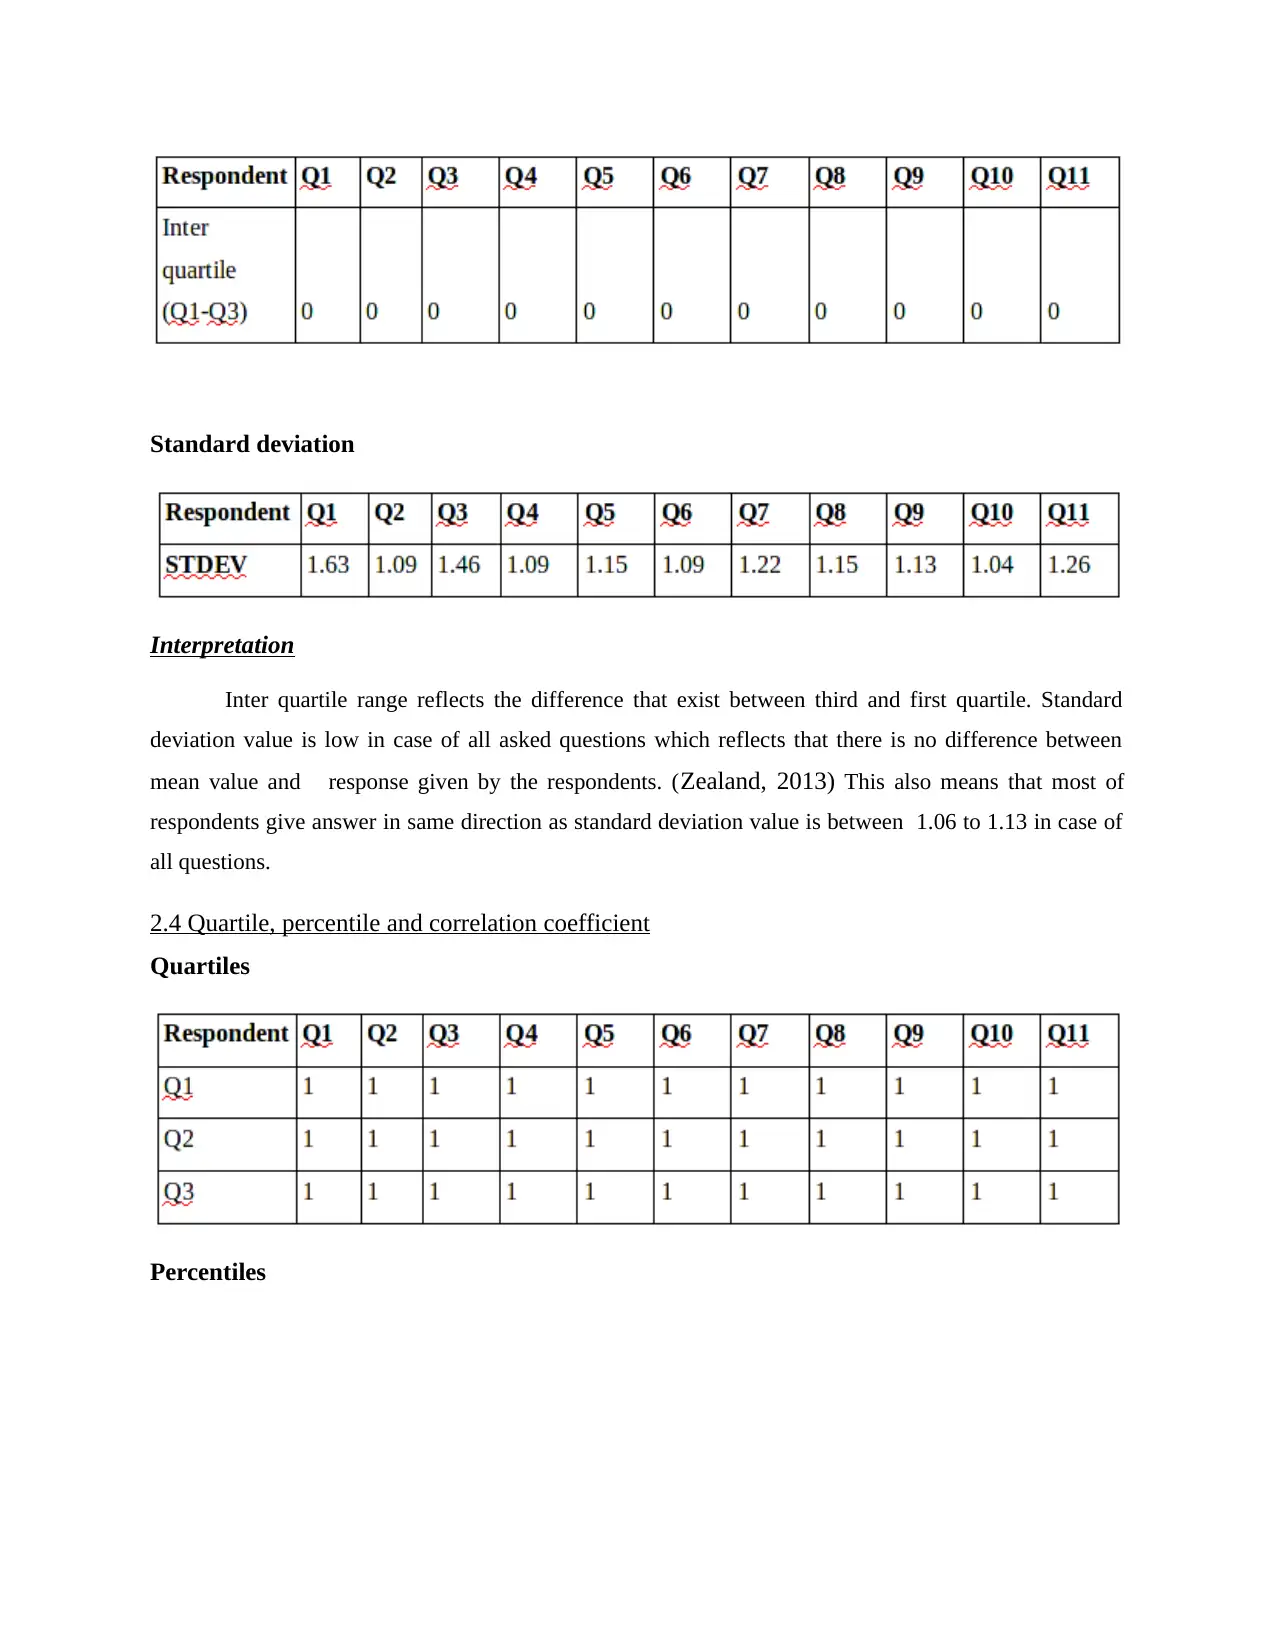
Standard deviation
Interpretation
Inter quartile range reflects the difference that exist between third and first quartile. Standard
deviation value is low in case of all asked questions which reflects that there is no difference between
mean value and response given by the respondents. (Zealand, 2013) This also means that most of
respondents give answer in same direction as standard deviation value is between 1.06 to 1.13 in case of
all questions.
2.4 Quartile, percentile and correlation coefficient
Quartiles
Percentiles
Interpretation
Quartile and percentile like median classified group of values in to four equal parts
(Siegel, Naishadham and Jemal, 2013). Value of quartile in all questions is one which reflects
that data in all asked questions is equally classified by the statistical tool.
TASK3
3.1 data analyses
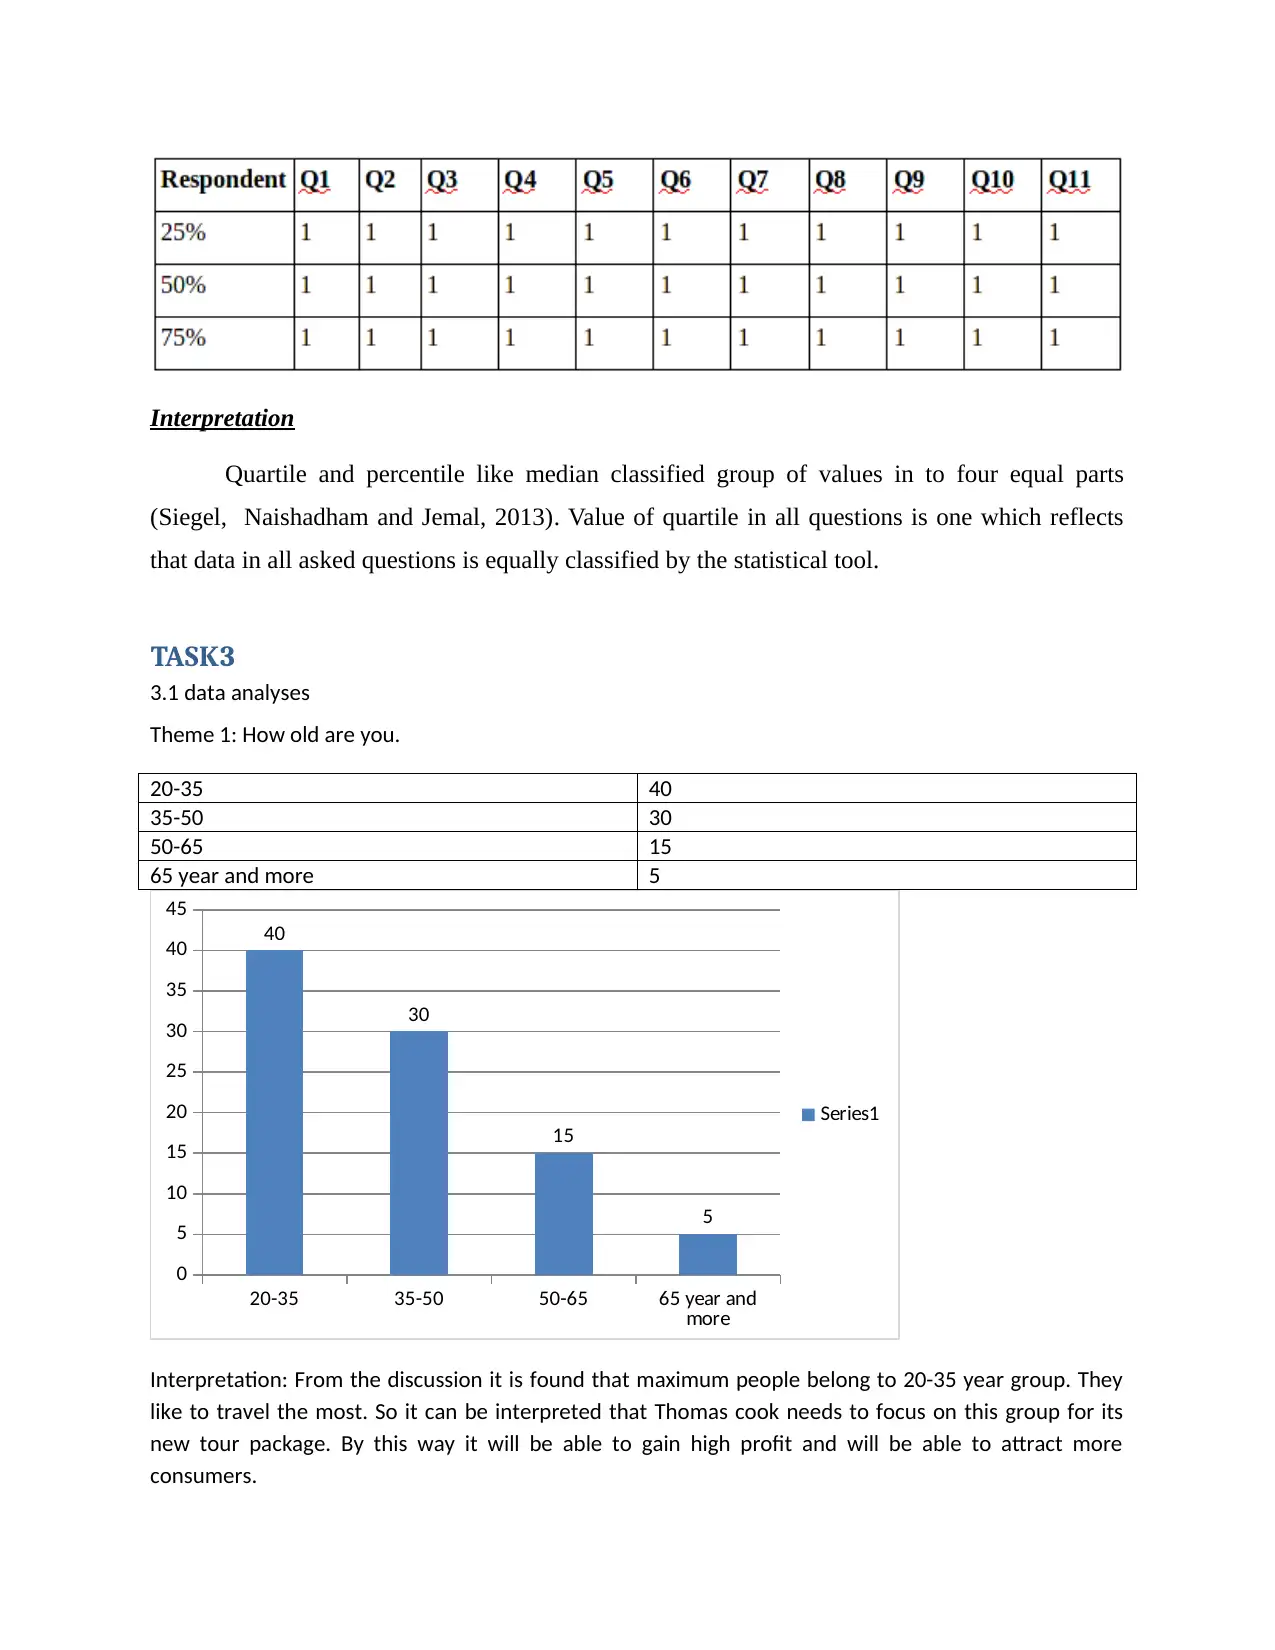
Theme 1: How old are you.
20-35 40
35-50 30
50-65 15
65 year and more 5
20-35 35-50 50-65 65 year and
more
0
5
10
15
20
25
30
35
40
45
40
30
15
5
Series1
Interpretation: From the discussion it is found that maximum people belong to 20-35 year group. They
like to travel the most. So it can be interpreted that Thomas cook needs to focus on this group for its
new tour package. By this way it will be able to gain high profit and will be able to attract more
consumers.
Quartile and percentile like median classified group of values in to four equal parts
(Siegel, Naishadham and Jemal, 2013). Value of quartile in all questions is one which reflects
that data in all asked questions is equally classified by the statistical tool.
TASK3
3.1 data analyses
Theme 1: How old are you.
20-35 40
35-50 30
50-65 15
65 year and more 5
20-35 35-50 50-65 65 year and
more
0
5
10
15
20
25
30
35
40
45
40
30
15
5
Series1
Interpretation: From the discussion it is found that maximum people belong to 20-35 year group. They
like to travel the most. So it can be interpreted that Thomas cook needs to focus on this group for its
new tour package. By this way it will be able to gain high profit and will be able to attract more
consumers.
⊘ This is a preview!⊘
Do you want full access?
Subscribe today to unlock all pages.
Trusted by 1+ million students worldwide
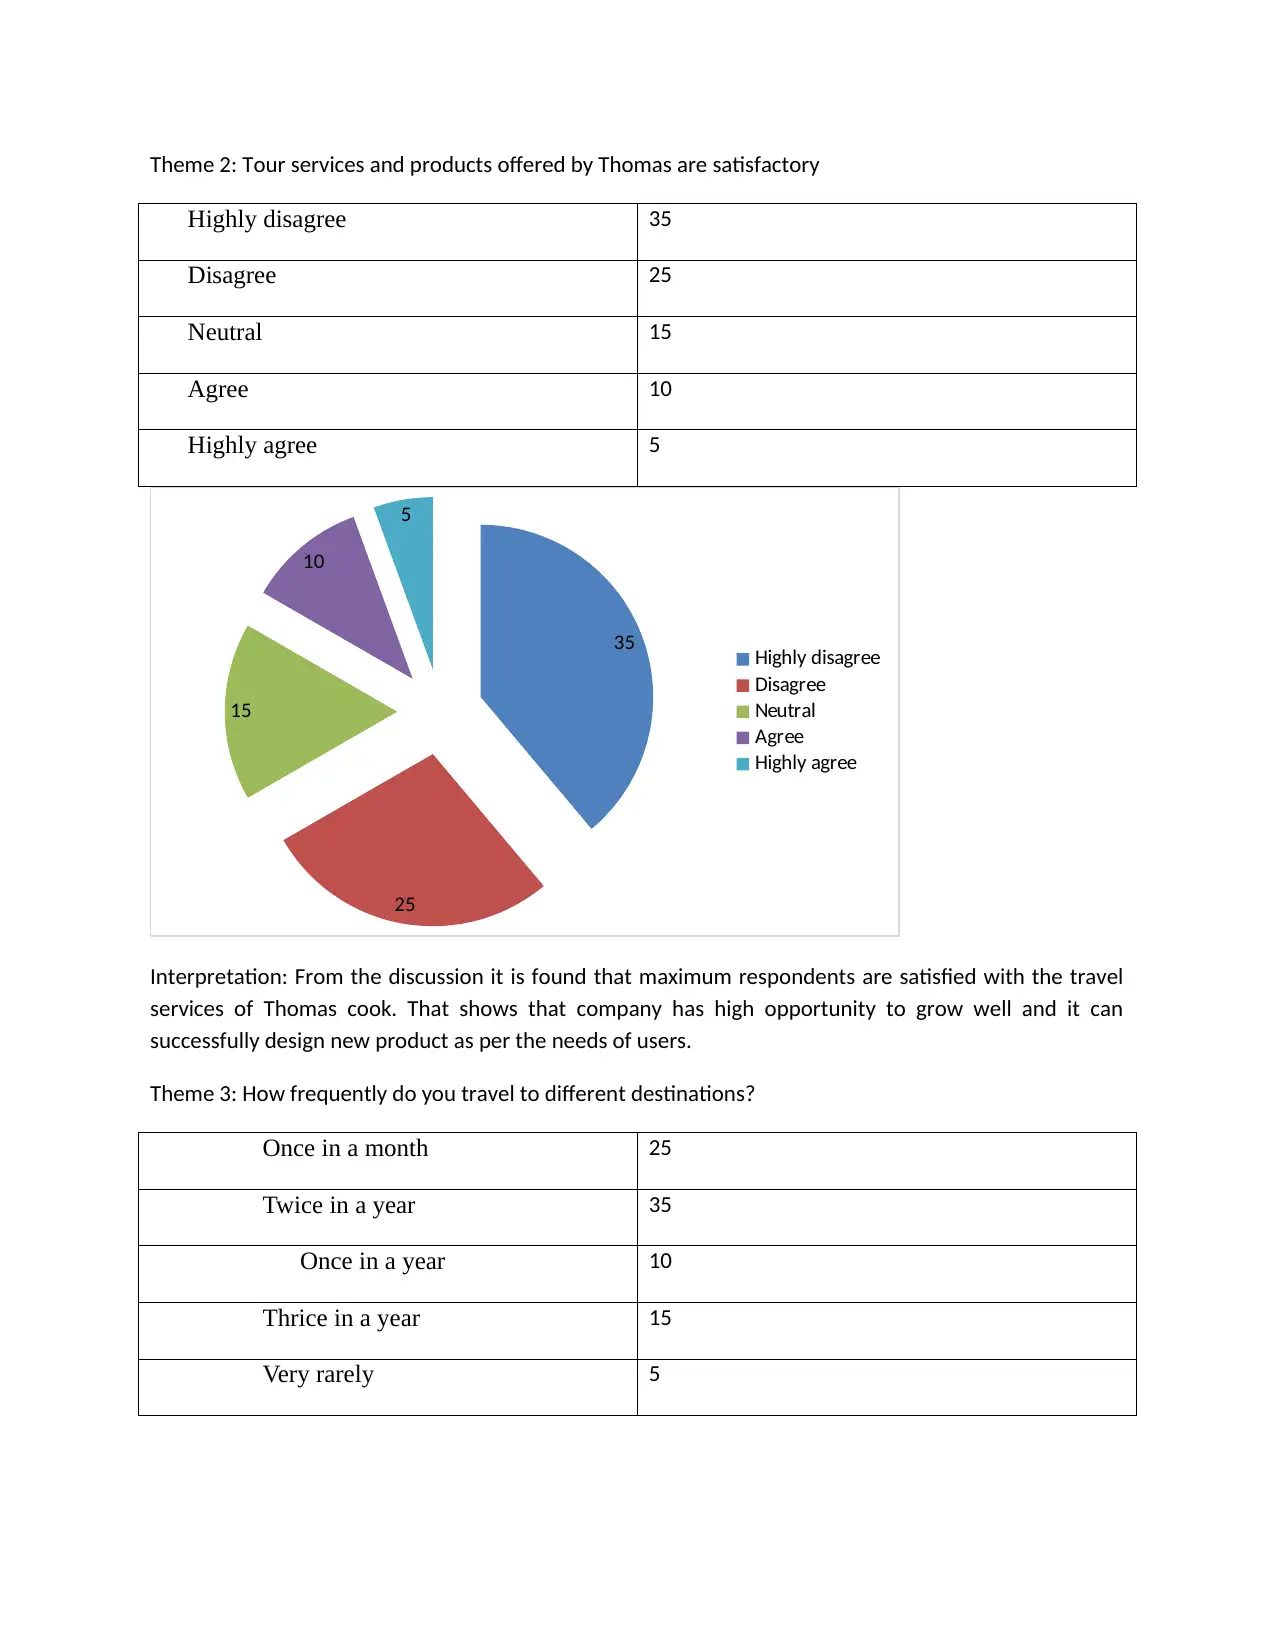
Theme 2: Tour services and products offered by Thomas are satisfactory
Highly disagree 35
Disagree 25
Neutral 15
Agree 10
Highly agree 5
35
25
15
10
5
Highly disagree
Disagree
Neutral
Agree
Highly agree
Interpretation: From the discussion it is found that maximum respondents are satisfied with the travel
services of Thomas cook. That shows that company has high opportunity to grow well and it can
successfully design new product as per the needs of users.
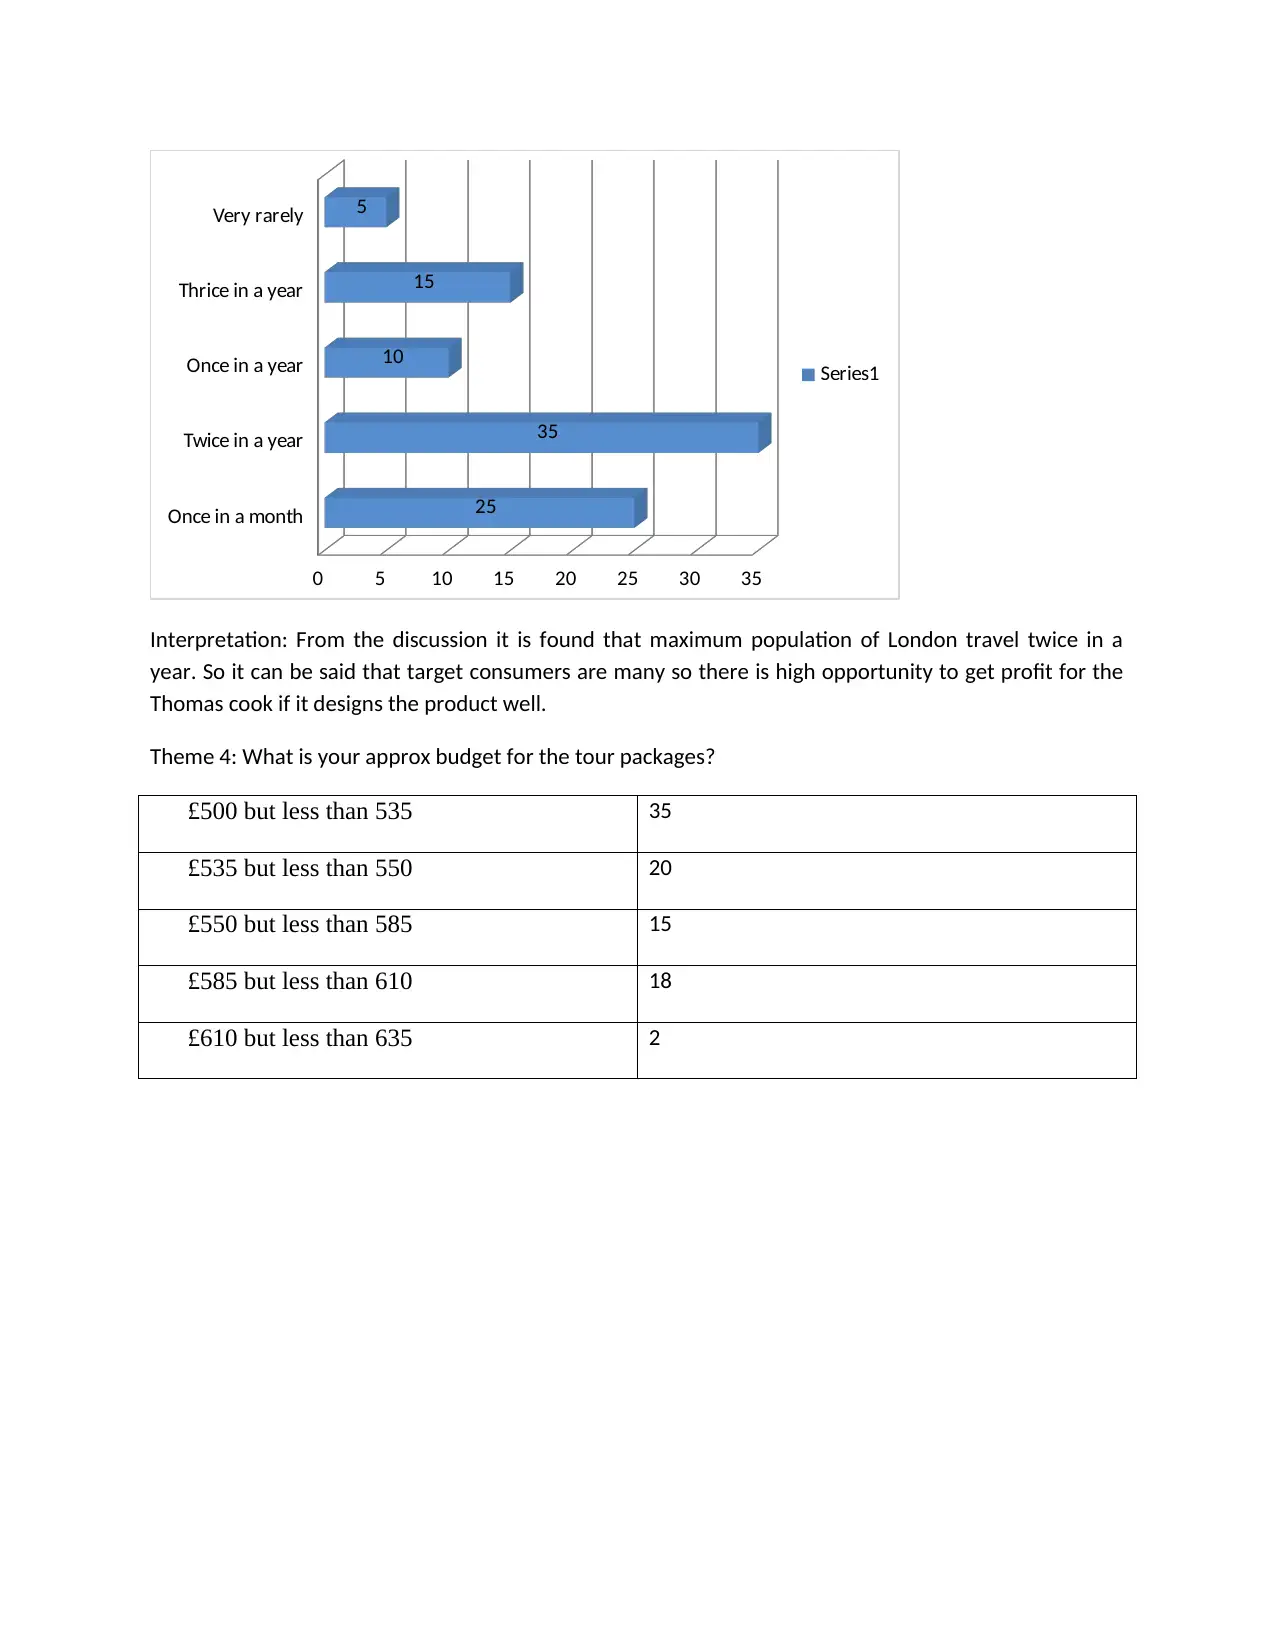
Theme 3: How frequently do you travel to different destinations?
Once in a month 25
Twice in a year 35
Once in a year 10
Thrice in a year 15
Very rarely 5
Highly disagree 35
Disagree 25
Neutral 15
Agree 10
Highly agree 5
35
25
15
10
5
Highly disagree
Disagree
Neutral
Agree
Highly agree
Interpretation: From the discussion it is found that maximum respondents are satisfied with the travel
services of Thomas cook. That shows that company has high opportunity to grow well and it can
successfully design new product as per the needs of users.
Theme 3: How frequently do you travel to different destinations?
Once in a month 25
Twice in a year 35
Once in a year 10
Thrice in a year 15
Very rarely 5
Paraphrase This Document
Need a fresh take? Get an instant paraphrase of this document with our AI Paraphraser
Once in a month
Twice in a year
Once in a year
Thrice in a year
Very rarely
0 5 10 15 20 25 30 35
25
35
10
15
5
Series1
Interpretation: From the discussion it is found that maximum population of London travel twice in a
year. So it can be said that target consumers are many so there is high opportunity to get profit for the
Thomas cook if it designs the product well.
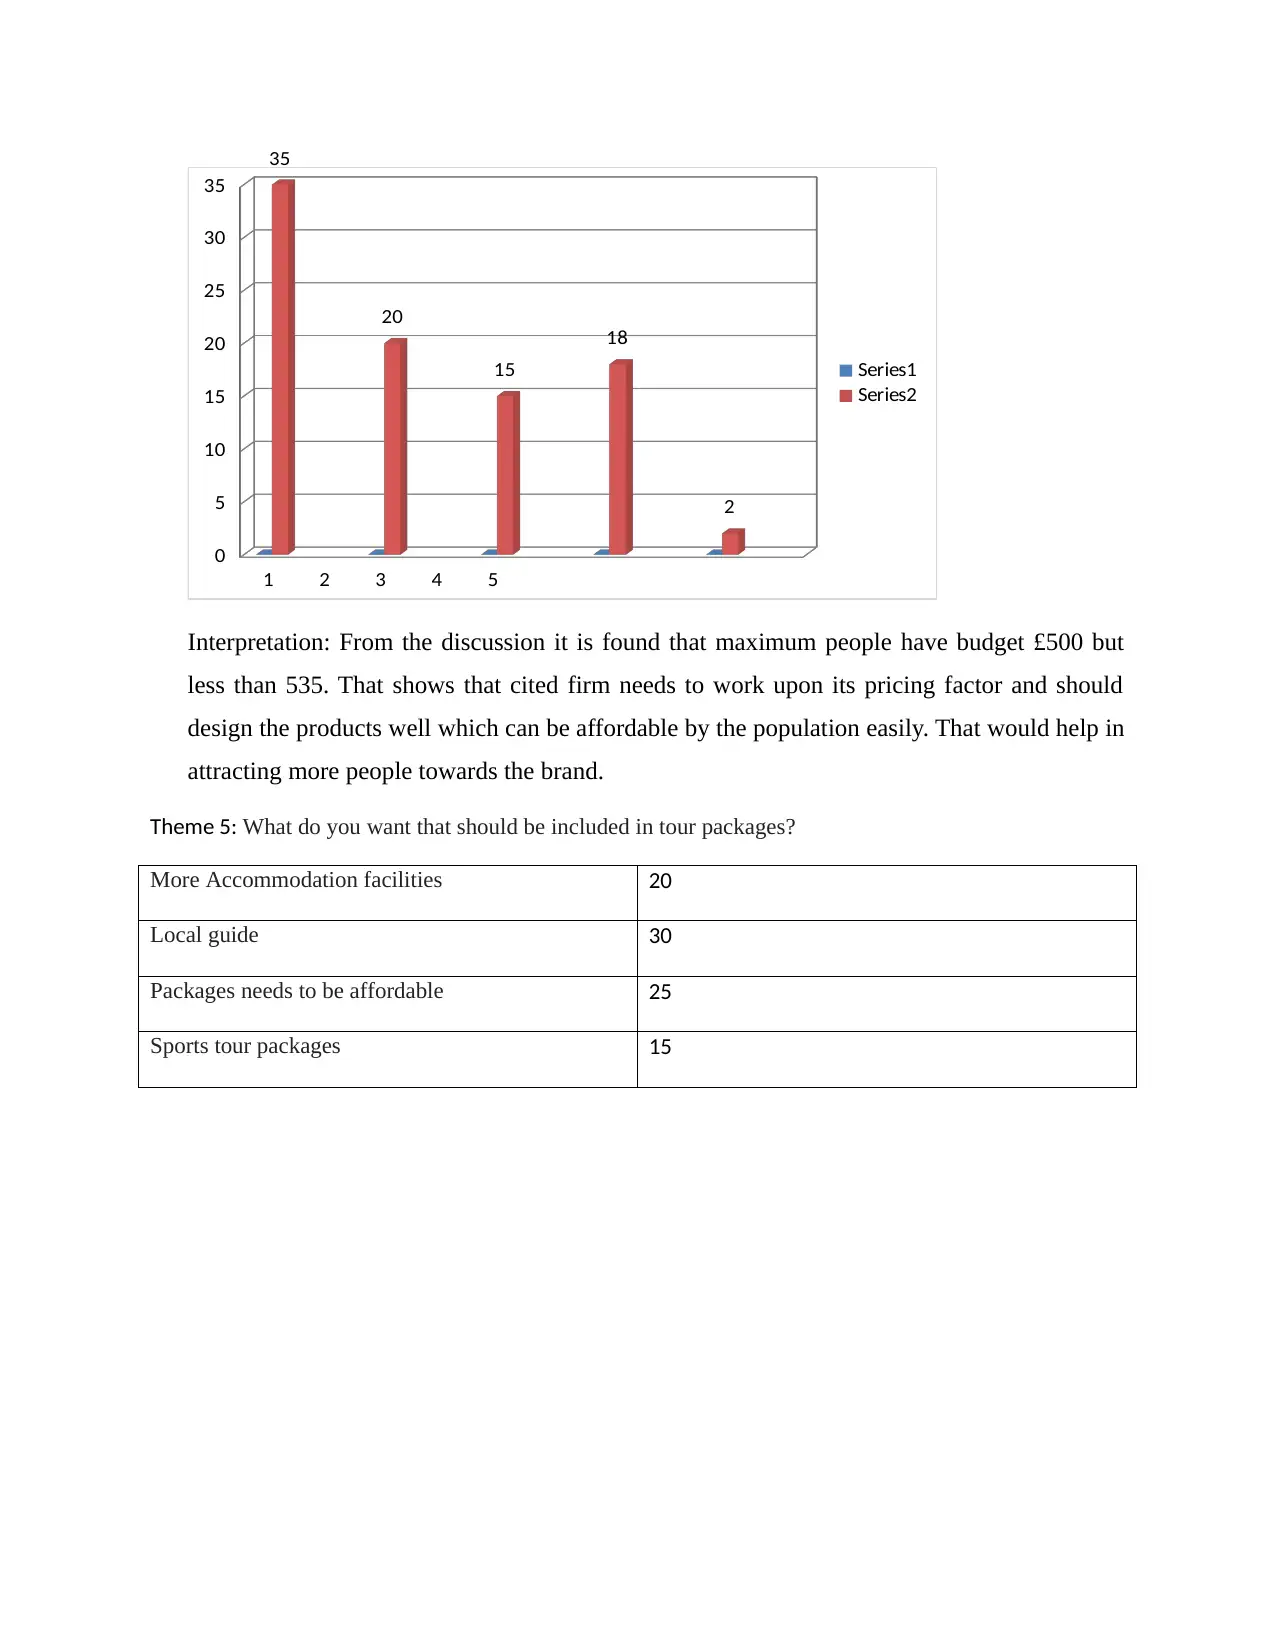
Theme 4: What is your approx budget for the tour packages?
£500 but less than 535 35
£535 but less than 550 20
£550 but less than 585 15
£585 but less than 610 18
£610 but less than 635 2
Twice in a year
Once in a year
Thrice in a year
Very rarely
0 5 10 15 20 25 30 35
25
35
10
15
5
Series1
Interpretation: From the discussion it is found that maximum population of London travel twice in a
year. So it can be said that target consumers are many so there is high opportunity to get profit for the
Thomas cook if it designs the product well.
Theme 4: What is your approx budget for the tour packages?
£500 but less than 535 35
£535 but less than 550 20
£550 but less than 585 15
£585 but less than 610 18
£610 but less than 635 2
1 2 3 4 5
0
5
10
15
20
25
30
35
35
20
15
18
2
Series1
Series2
Interpretation: From the discussion it is found that maximum people have budget £500 but
less than 535. That shows that cited firm needs to work upon its pricing factor and should
design the products well which can be affordable by the population easily. That would help in
attracting more people towards the brand.
Theme 5: What do you want that should be included in tour packages?
More Accommodation facilities 20
Local guide 30
Packages needs to be affordable 25
Sports tour packages 15
⊘ This is a preview!⊘
Do you want full access?
Subscribe today to unlock all pages.
Trusted by 1+ million students worldwide
1 out of 22
Related Documents


Your All-in-One AI-Powered Toolkit for Academic Success.
+13062052269
info@desklib.com
Available 24*7 on WhatsApp / Email
![[object Object]](/_next/static/media/star-bottom.7253800d.svg)
Unlock your academic potential
Copyright © 2020–2026 A2Z Services. All Rights Reserved. Developed and managed by ZUCOL.