Problems in Epidemiology Assignment PDF
Added on 2021-05-31
10 Pages2001 Words67 Views
1Problems in EpidemiologyStudent Name:Student ID:Subject Name:Subject ID:Due Date:
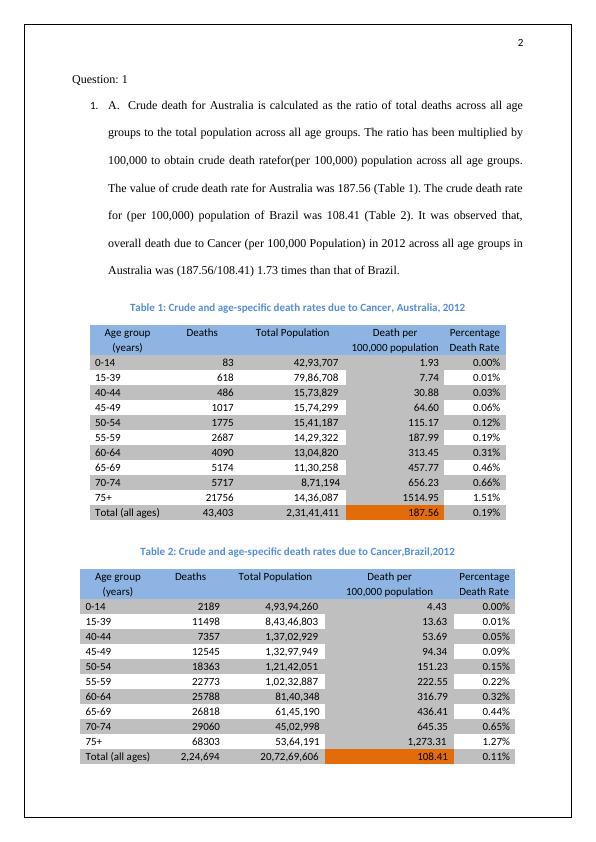
2Question: 11.A. Crude death for Australia is calculated as the ratio of total deaths across all agegroups to the total population across all age groups. The ratio has been multiplied by100,000 to obtain crude death ratefor(per 100,000) population across all age groups.The value of crude death rate for Australia was 187.56 (Table 1). The crude death ratefor (per 100,000) population of Brazil was 108.41 (Table 2). It was observed that,overall death due to Cancer (per 100,000 Population) in 2012 across all age groups inAustralia was (187.56/108.41) 1.73 times than that of Brazil. Table 1: Crude and age-specific death rates due to Cancer, Australia, 2012Age groupDeathsTotal PopulationDeath perPercentage(years)100,000 populationDeath Rate0-1483 42,93,7071.930.00%15-39618 79,86,7087.740.01%40-44486 15,73,82930.880.03%45-491017 15,74,29964.600.06%50-541775 15,41,187115.170.12%55-592687 14,29,322187.990.19%60-644090 13,04,820313.450.31%65-695174 11,30,258457.770.46%70-745717 8,71,194656.230.66%75+21756 14,36,0871514.951.51%Total (all ages) 43,403 2,31,41,411187.560.19%Table 2: Crude and age-specific death rates due to Cancer,Brazil,2012Age groupDeathsTotal PopulationDeath perPercentage(years)100,000 populationDeath Rate0-142189 4,93,94,260 4.430.00%15-3911498 8,43,46,803 13.630.01%40-447357 1,37,02,929 53.690.05%45-4912545 1,32,97,949 94.340.09%50-5418363 1,21,42,051 151.230.15%55-5922773 1,02,32,887 222.550.22%60-6425788 81,40,348 316.790.32%65-6926818 61,45,190 436.410.44%70-7429060 45,02,998 645.350.65%75+68303 53,64,191 1,273.311.27%Total (all ages) 2,24,694 20,72,69,606 108.410.11%
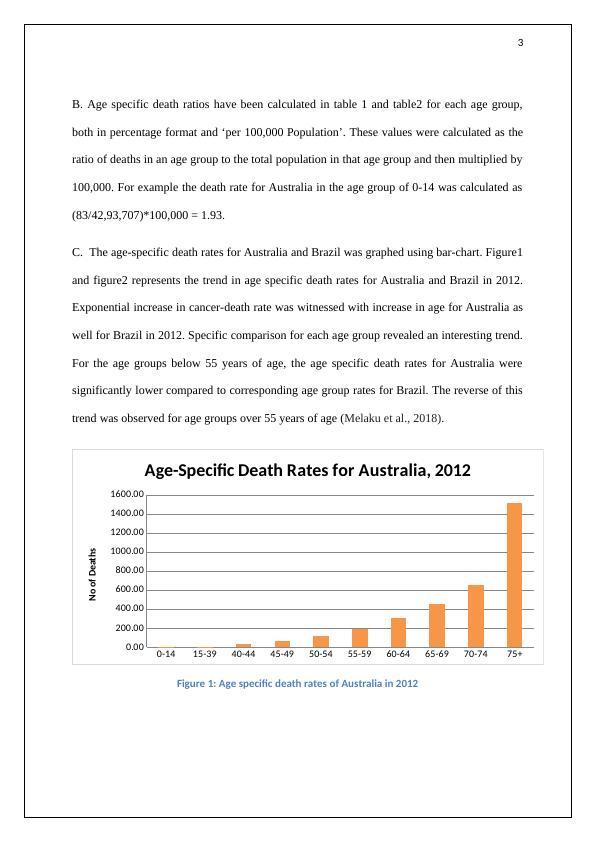
3B. Age specific death ratios have been calculated in table 1 and table2 for each age group,both in percentage format and ‘per 100,000 Population’. These values were calculated as theratio of deaths in an age group to the total population in that age group and then multiplied by100,000. For example the death rate for Australia in the age group of 0-14 was calculated as(83/42,93,707)*100,000 = 1.93. C. The age-specific death rates for Australia and Brazil was graphed using bar-chart. Figure1and figure2 represents the trend in age specific death rates for Australia and Brazil in 2012.Exponential increase in cancer-death rate was witnessed with increase in age for Australia aswell for Brazil in 2012. Specific comparison for each age group revealed an interesting trend.For the age groups below 55 years of age, the age specific death rates for Australia weresignificantly lower compared to corresponding age group rates for Brazil. The reverse of thistrend was observed for age groups over 55 years of age (Melaku et al., 2018).0-1415-3940-4445-4950-5455-5960-6465-6970-7475+0.00200.00400.00600.00800.001000.001200.001400.001600.00Age-Specific Death Rates for Australia, 2012NoofDeathsFigure 1: Age specific death rates of Australia in 2012
End of preview
Want to access all the pages? Upload your documents or become a member.
Related Documents
Calculations of Crude and Age-Specific Death Rates due to Cancer in Australia and Saudi Arabia in 2012lg...
|13
|1890
|212
Comparison of Death Rates due to Cancer in Australia and Saudi Arabia in 2012lg...
|9
|1568
|341
Epidemiology: Comparison of Death Rates and Infant Mortality by Birth Weightlg...
|8
|2627
|90
Association between Alcohol Consumption and Alcohol-related Eventslg...
|12
|1717
|200
Research Report on Epidemiologylg...
|5
|625
|35
Mathematics Assignmentlg...
|7
|1272
|61