logo

Comparison of Death Rates due to Cancer in Australia and Saudi Arabia in 2012


Added on  2023-06-04

9 Pages1568 Words341 Views
EPIDEMOLOGY AND POPULATION HEALTH
AUTUMN 2018
ASSESSMENT 2
QUESTION 1
SOLUTIONS
A. The rates of crude death are determined by dividing the death rate per 100000
populations by the total population and the multiplying by 100000 so that the exact value
of crude deaths can be obtained. Therefore,
Crude death rates= number of death s
Total population X 100000
For example, from the data below, if the age group of 75 years and above in Australia
was taken, the crude death rate would be
crude death rate Australia for age group 75+¿ 21756
1436087 X 100000=1514.95
The data above
indicates the crude
and age specific
Crude and age-specific death rates due to cancer, Australia 2012
Age group Deaths Total population Death rate per 100000
Population
0-14 83 4293707 1.933062
15-39 618 7986708 7.737856
40-44 486 1573829 30.8801
45-49 1017 1574299 64.60018
50-54 1775 1541187 115.171
55-59 2687 1429322 187.9912
60-64 4090 1304820 313.4532
65-69 5174 1130258 457.7716
70-74 5717 871194 656.2258
75+ 21756 1439087 1511.792
total 43403 23144411 187.5312
Comparison of Death Rates due to Cancer in Australia and Saudi Arabia in 2012_1
death rates that resulted from cancer in Australia in the year 2012. The data below is the as the
one above, but it’s for Saudi-Arabia.
Using the two data sets above for comparison, the death rate per 100000 populations in Australia
is 187.5 while that of Saudi Arabia is 31.40304. It is therefore okay to conclude that there were
more of deaths in Australia than in Saudi Arabia as a result of cancer in the year 2012.
B. The datasets above also indicate that in Saudi-Arabia the rates of death by specific age
are low for all the other age groups except the 0-14 years’ age group which is contrary to
the case of Australia in the year 2012.
C.
Crude an0d age-specific death rates due to cancer, Saudi Arabia 2012
Age group Deaths Total population Death rate per 100000
Population
0-14 543 8134561 6.675222
15-39 932 13600843 6.852516
40-44 426 2261777 18.83475
45-49 540 1709816 31.58235
50-54 774 1200372 64.48001
55-59 1084 812708 133.3812
60-64 1089 505266 215.53
65-69 1102 328827 335.1306
70-74 880 239961 366.7263
75+ 1764 292226 603.6424
total 9134 29086357 31.40304
Comparison of Death Rates due to Cancer in Australia and Saudi Arabia in 2012_2
0-14 15-39 40-44 45-49 50-54 55-59 60-64 65-69 70-74 75+
0
200
400
600
800
1000
1200
1400
1600
Age specific death rate
Australia Saudi Arabia
Death rate per 100,000 population
The line graph above indicates that in the year 2012, there was a similar trend in the death
rates of the two nations with age. In both the countries and for ages up to 59years, the death
rates increase with age. In the case of Australia, the graph is elevating rapidly after the age of
59 years, with optimum elevation at the 75 and above age group. This is due to the fact that
the death rates in Australia for this age group exceeds twice the value of death rates in Saudi
Arabia.
D. From the above data sets its evident that the death rates of infants belonging to the age
group 0-14 years is less is Australia as compared to Saudi-Arabia. However, for all the
other age groups, there are smaller death rates in Saudi Arabia than Australia. The small
death rates for infants in Australia can be attributed to the advancements in medical
treatment for pediatric oncology, maternity and child care specialties available in the
country as compared to Saudi Arabia.
Question 2
Solutions
Comparison of Death Rates due to Cancer in Australia and Saudi Arabia in 2012_3

End of preview

Want to access all the pages? Upload your documents or become a member.

Related Documents
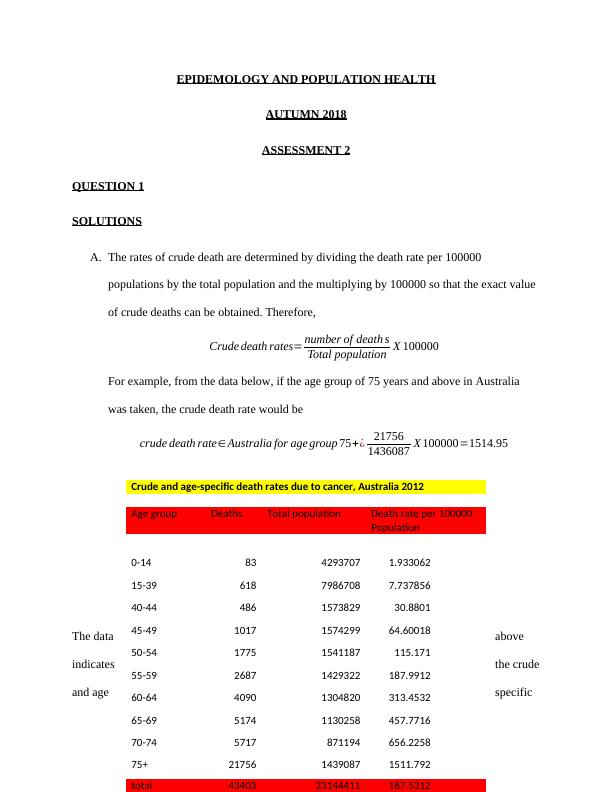
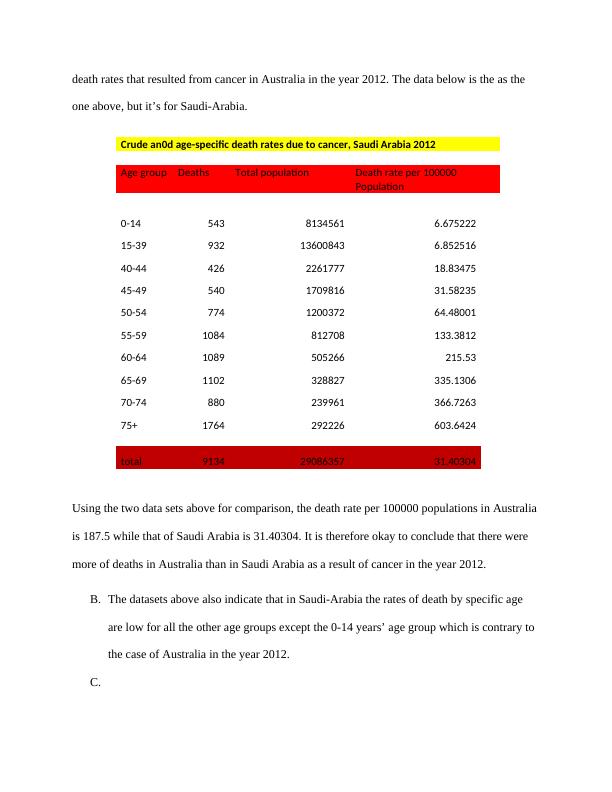
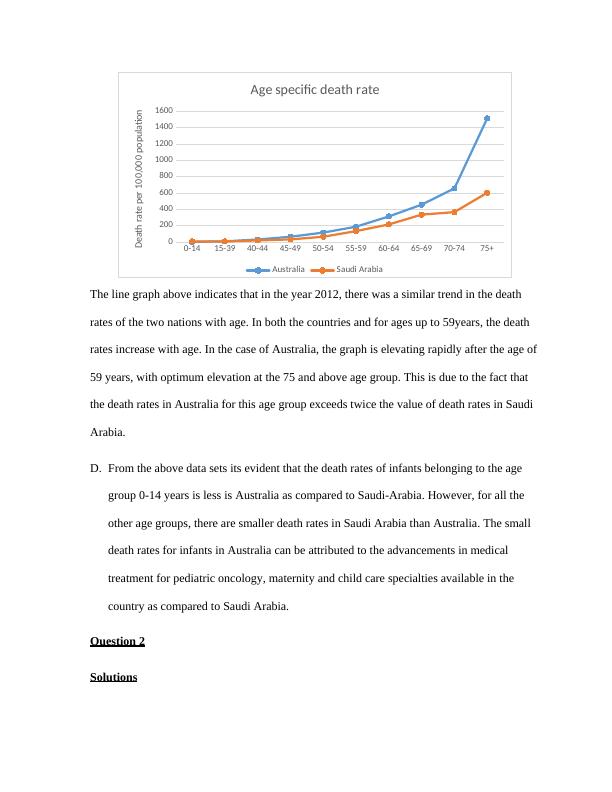
Calculations of Crude and Age-Specific Death Rates due to Cancer in Australia and Saudi Arabia in 2012
|13
|1890
|212

Epidemiology: Comparison of Death Rates and Infant Mortality by Birth Weight
|8
|2627
|90

Association between Alcohol Consumption and Alcohol-related Events
|12
|1717
|200

Problems in Epidemiology Assignment PDF
|10
|2001
|67

Prevalence of Osteoarthritis by Age Group
|6
|1155
|97

MKTG127 DEMOGRAPHIC FUNDAMENTALS
|6
|933
|92