Epidemiology: Comparison of Death Rates and Infant Mortality by Birth Weight
Added on 2023-06-14
8 Pages2627 Words90 Views
Running head: EPIDEMIOLOGY
Epidemiology
Name of the Student:
Name of the University:
Author’s Note:
Epidemiology
Name of the Student:
Name of the University:
Author’s Note:

1EPIDEMIOLOGY
Table of Contents
Question 1....................................................................................................................................................................................................2
1...............................................................................................................................................................................................................2
1. a)......................................................................................................................................................................................................2
1. b)......................................................................................................................................................................................................2
1. c)......................................................................................................................................................................................................2
1. d)......................................................................................................................................................................................................3
2...............................................................................................................................................................................................................3
2. a)......................................................................................................................................................................................................3
2. b)......................................................................................................................................................................................................4
Question 2....................................................................................................................................................................................................4
1...............................................................................................................................................................................................................4
2...............................................................................................................................................................................................................5
3...............................................................................................................................................................................................................5
4...............................................................................................................................................................................................................5
5...............................................................................................................................................................................................................5
6...............................................................................................................................................................................................................5
7...............................................................................................................................................................................................................5
Question 3....................................................................................................................................................................................................5
1...............................................................................................................................................................................................................5
2...............................................................................................................................................................................................................6
3...............................................................................................................................................................................................................6
References:..................................................................................................................................................................................................7
2EPIDEMIOLOGY
Question 1.
1.
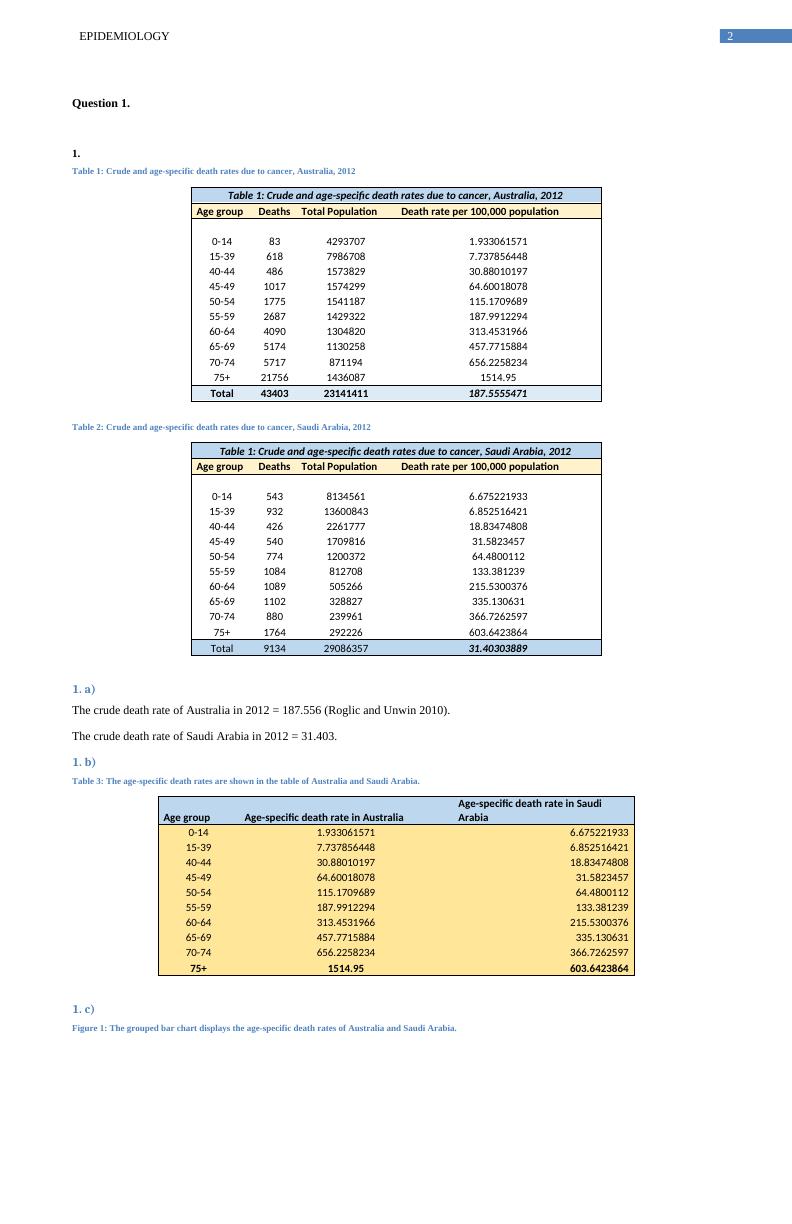
Table 1: Crude and age-specific death rates due to cancer, Australia, 2012
Table 1: Crude and age-specific death rates due to cancer, Australia, 2012
Age group Deaths Total Population Death rate per 100,000 population
0-14 83 4293707 1.933061571
15-39 618 7986708 7.737856448
40-44 486 1573829 30.88010197
45-49 1017 1574299 64.60018078
50-54 1775 1541187 115.1709689
55-59 2687 1429322 187.9912294
60-64 4090 1304820 313.4531966
65-69 5174 1130258 457.7715884
70-74 5717 871194 656.2258234
75+ 21756 1436087 1514.95
Total 43403 23141411 187.5555471
Table 2: Crude and age-specific death rates due to cancer, Saudi Arabia, 2012
Table 1: Crude and age-specific death rates due to cancer, Saudi Arabia, 2012
Age group Deaths Total Population Death rate per 100,000 population
0-14 543 8134561 6.675221933
15-39 932 13600843 6.852516421
40-44 426 2261777 18.83474808
45-49 540 1709816 31.5823457
50-54 774 1200372 64.4800112
55-59 1084 812708 133.381239
60-64 1089 505266 215.5300376
65-69 1102 328827 335.130631
70-74 880 239961 366.7262597
75+ 1764 292226 603.6423864
Total 9134 29086357 31.40303889
1. a)
The crude death rate of Australia in 2012 = 187.556 (Roglic and Unwin 2010).
The crude death rate of Saudi Arabia in 2012 = 31.403.
1. b)
Table 3: The age-specific death rates are shown in the table of Australia and Saudi Arabia.
Age group Age-specific death rate in Australia
Age-specific death rate in Saudi
Arabia
0-14 1.933061571 6.675221933
15-39 7.737856448 6.852516421
40-44 30.88010197 18.83474808
45-49 64.60018078 31.5823457
50-54 115.1709689 64.4800112
55-59 187.9912294 133.381239
60-64 313.4531966 215.5300376
65-69 457.7715884 335.130631
70-74 656.2258234 366.7262597
75+ 1514.95 603.6423864
1. c)
Figure 1: The grouped bar chart displays the age-specific death rates of Australia and Saudi Arabia.
Question 1.
1.
Table 1: Crude and age-specific death rates due to cancer, Australia, 2012
Table 1: Crude and age-specific death rates due to cancer, Australia, 2012
Age group Deaths Total Population Death rate per 100,000 population
0-14 83 4293707 1.933061571
15-39 618 7986708 7.737856448
40-44 486 1573829 30.88010197
45-49 1017 1574299 64.60018078
50-54 1775 1541187 115.1709689
55-59 2687 1429322 187.9912294
60-64 4090 1304820 313.4531966
65-69 5174 1130258 457.7715884
70-74 5717 871194 656.2258234
75+ 21756 1436087 1514.95
Total 43403 23141411 187.5555471
Table 2: Crude and age-specific death rates due to cancer, Saudi Arabia, 2012
Table 1: Crude and age-specific death rates due to cancer, Saudi Arabia, 2012
Age group Deaths Total Population Death rate per 100,000 population
0-14 543 8134561 6.675221933
15-39 932 13600843 6.852516421
40-44 426 2261777 18.83474808
45-49 540 1709816 31.5823457
50-54 774 1200372 64.4800112
55-59 1084 812708 133.381239
60-64 1089 505266 215.5300376
65-69 1102 328827 335.130631
70-74 880 239961 366.7262597
75+ 1764 292226 603.6423864
Total 9134 29086357 31.40303889
1. a)
The crude death rate of Australia in 2012 = 187.556 (Roglic and Unwin 2010).
The crude death rate of Saudi Arabia in 2012 = 31.403.
1. b)
Table 3: The age-specific death rates are shown in the table of Australia and Saudi Arabia.
Age group Age-specific death rate in Australia
Age-specific death rate in Saudi
Arabia
0-14 1.933061571 6.675221933
15-39 7.737856448 6.852516421
40-44 30.88010197 18.83474808
45-49 64.60018078 31.5823457
50-54 115.1709689 64.4800112
55-59 187.9912294 133.381239
60-64 313.4531966 215.5300376
65-69 457.7715884 335.130631
70-74 656.2258234 366.7262597
75+ 1514.95 603.6423864
1. c)
Figure 1: The grouped bar chart displays the age-specific death rates of Australia and Saudi Arabia.
End of preview
Want to access all the pages? Upload your documents or become a member.
Related Documents
Comparison of Death Rates due to Cancer in Australia and Saudi Arabia in 2012lg...
|9
|1568
|341
Calculations of Crude and Age-Specific Death Rates due to Cancer in Australia and Saudi Arabia in 2012lg...
|13
|1890
|212
Problems in Epidemiology Assignment PDFlg...
|10
|2001
|67
Association between Alcohol Consumption and Alcohol-related Eventslg...
|12
|1717
|200
Prevalence of Osteoarthritis by Age Grouplg...
|6
|1155
|97
Epidemiology: Principles and Practiceslg...
|9
|2119
|62