Economics and Quantitative Analysis: Linear Regression Report
VerifiedAdded on 2023/04/25
|8
|1668
|291
Report
AI Summary
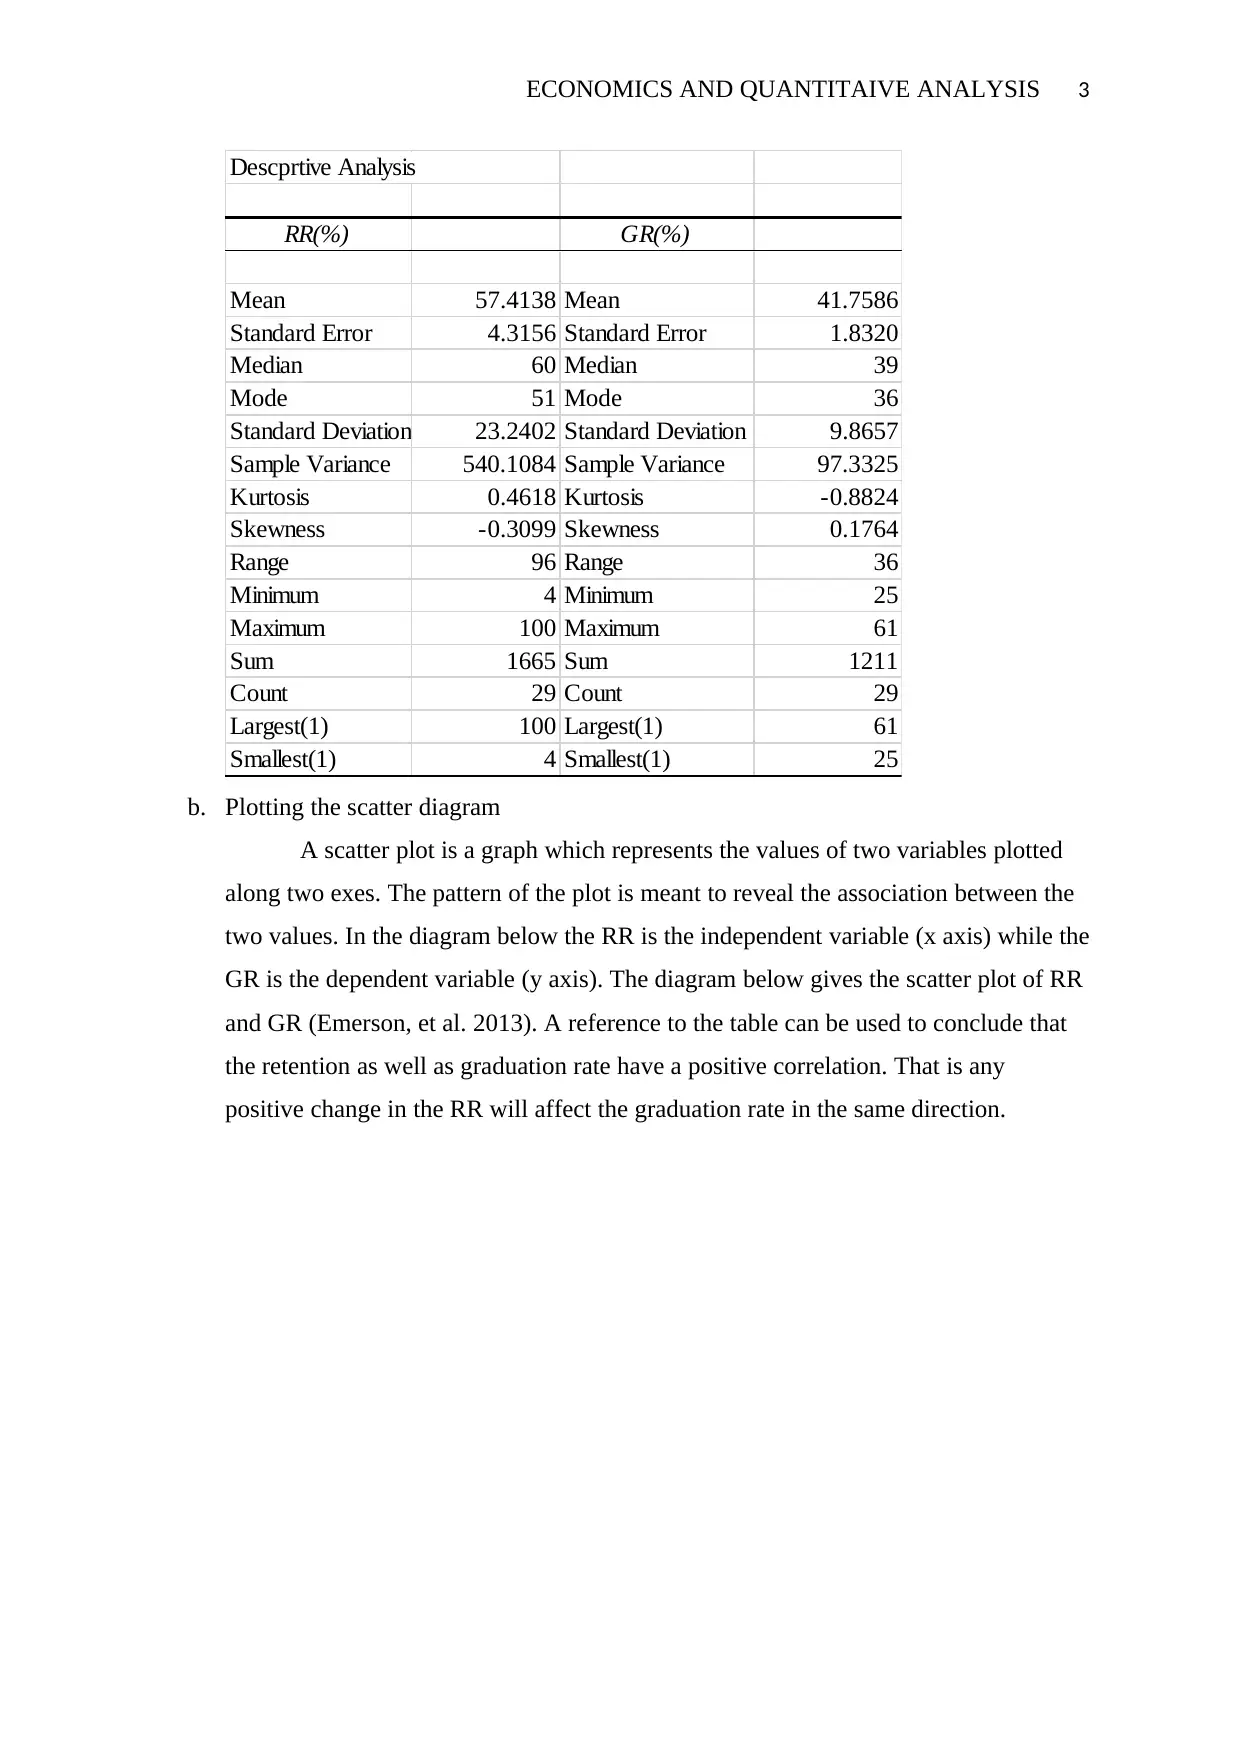
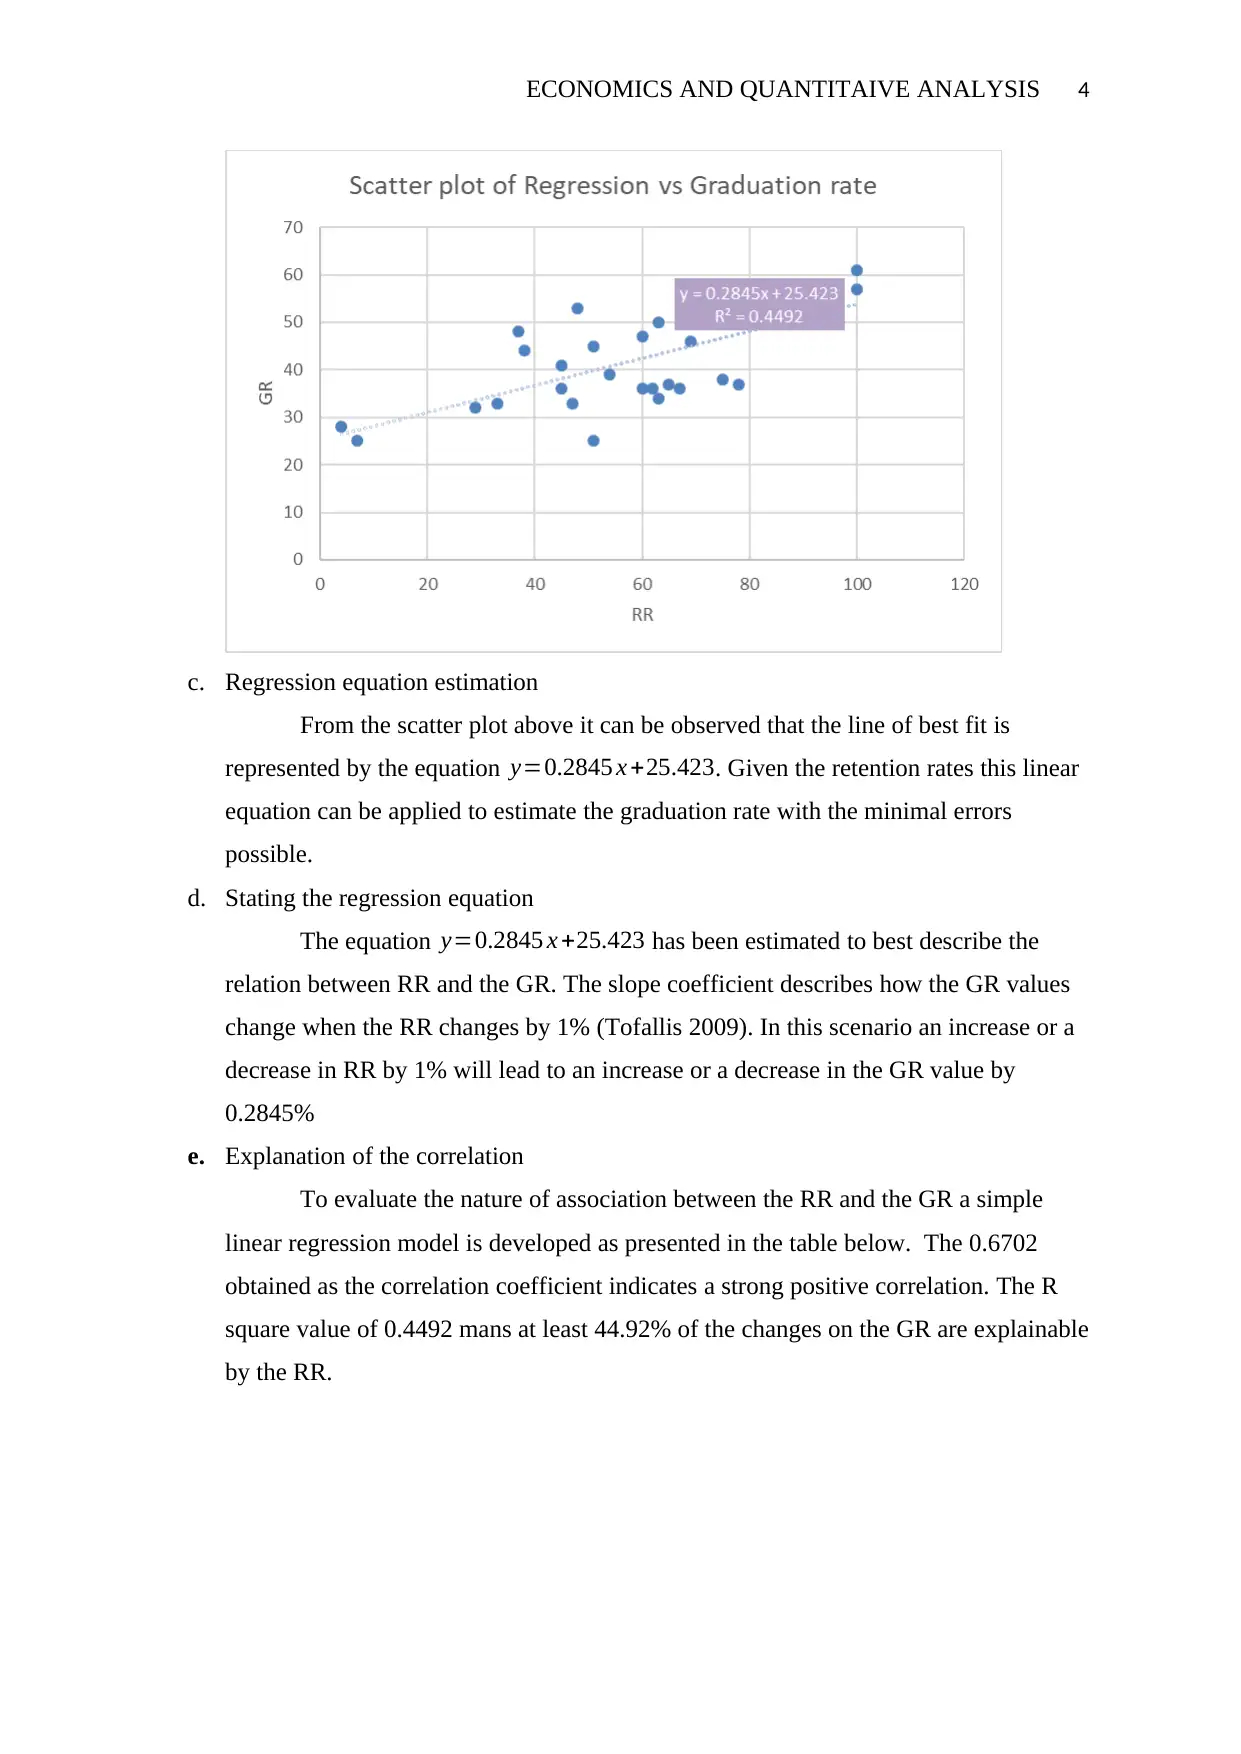
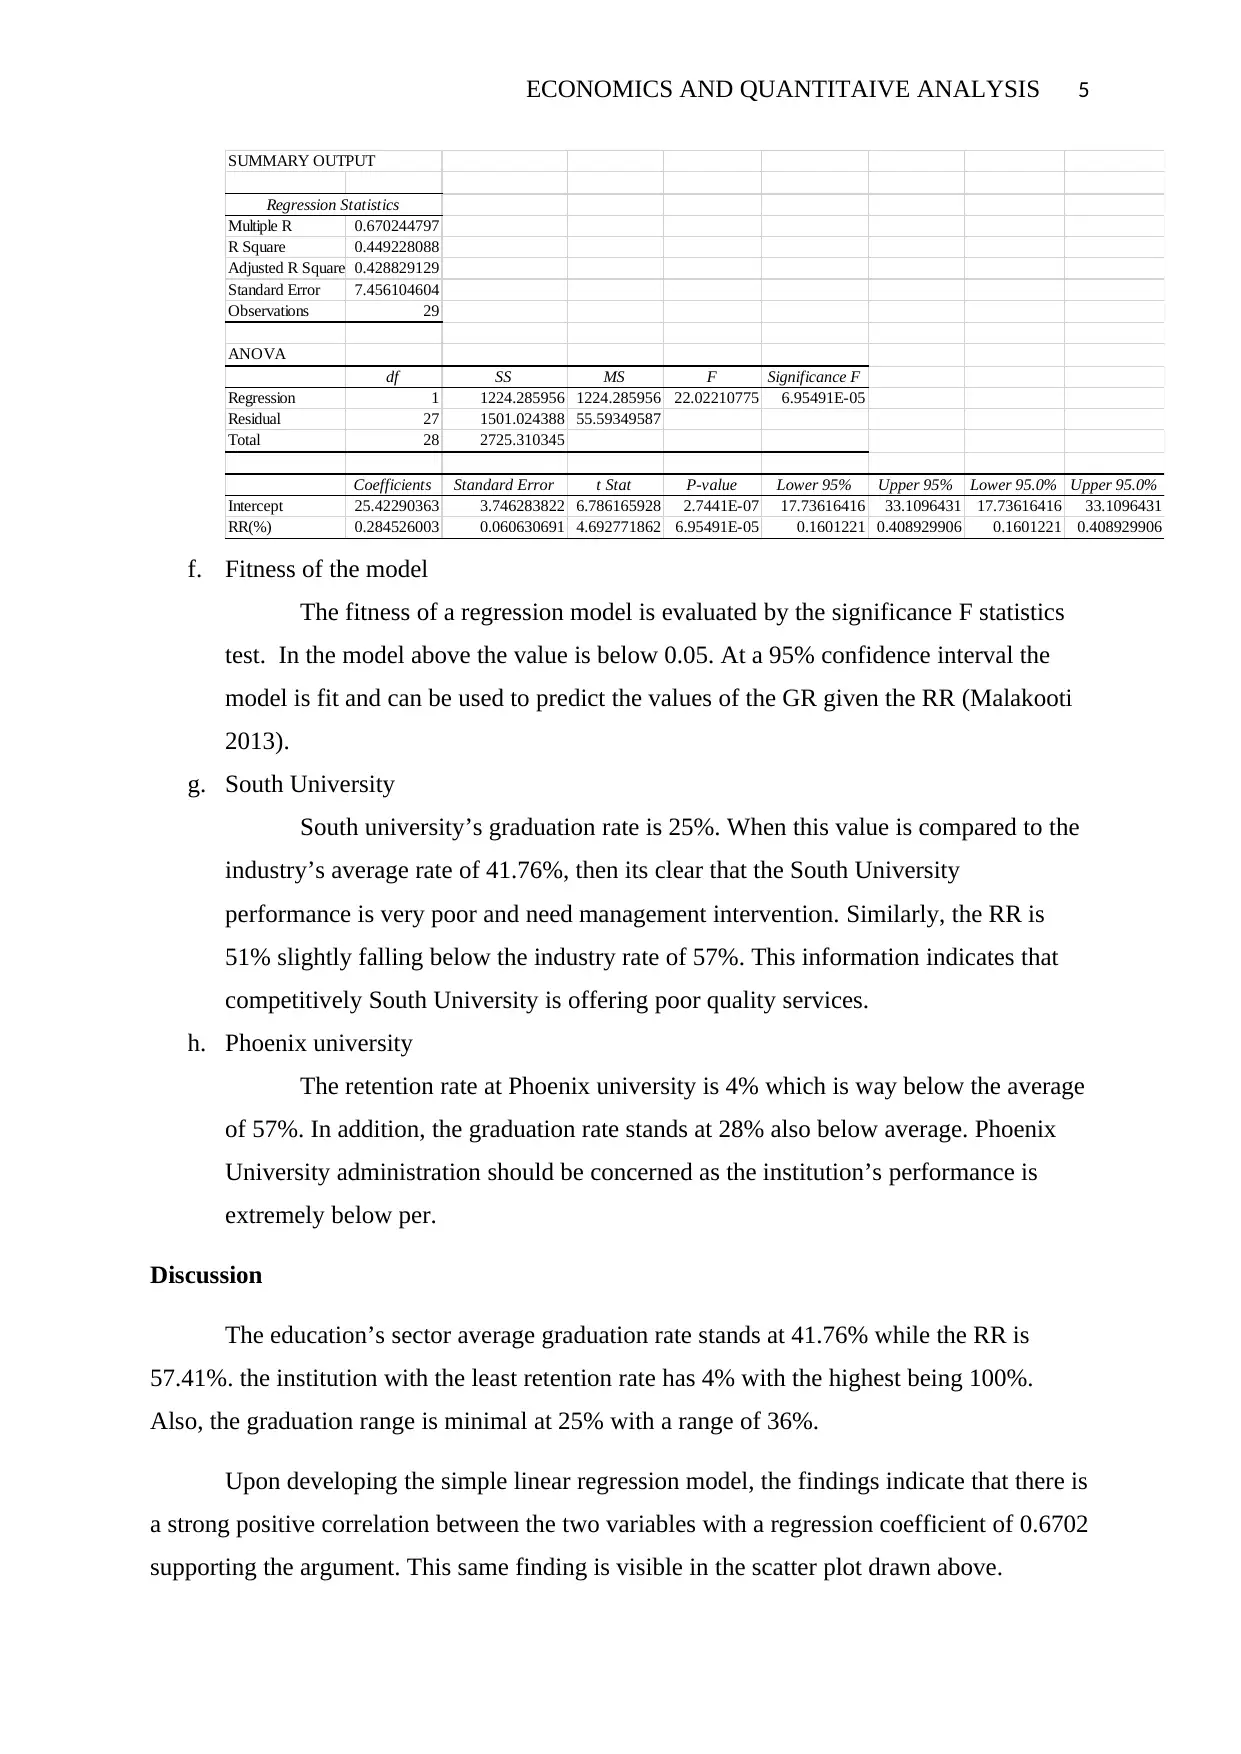
This report presents a linear regression analysis examining the relationship between retention rates (RR) and graduation rates (GR) in online colleges. The study, based on data from the Online Education Database, aims to model the correlation between these two key performance indicators. The report includes descriptive statistics, a scatter plot illustrating the relationship, and the estimation of a regression equation. The findings reveal a strong positive correlation between RR and GR, with the regression coefficient indicating how changes in RR affect GR. The model's fitness is evaluated using the significance F statistic. The report also analyzes the performance of specific universities, such as South University and Phoenix University, in relation to industry averages. Recommendations are provided for universities to improve student support, curriculum quality, and further research. The report concludes by acknowledging the limitations of the small sample size and emphasizes the importance of the findings for stakeholders in the higher education sector.

1 out of 8
Related Documents


Your All-in-One AI-Powered Toolkit for Academic Success.
+13062052269
info@desklib.com
Available 24*7 on WhatsApp / Email
![[object Object]](/_next/static/media/star-bottom.7253800d.svg)
Copyright © 2020–2026 A2Z Services. All Rights Reserved. Developed and managed by ZUCOL.