logo

Linear Regression Report

Conduct a linear regression analysis to examine the association between retention rate and graduation rate for online colleges in the United States.

8 Pages1876 Words378 Views
   

Added on  2023-04-21

About This Document

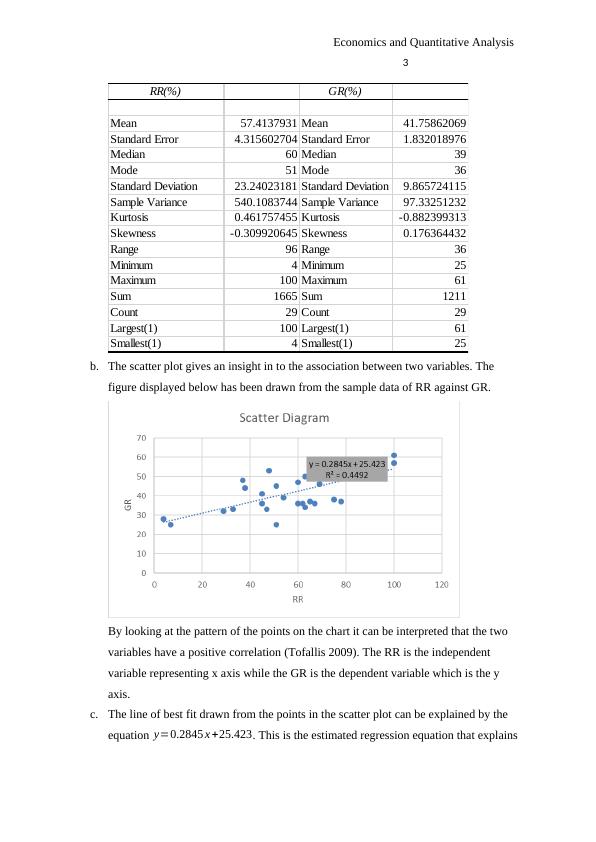
This report evaluates the relationship between graduation and retention rate using linear regression analysis. Findings suggest a positive correlation between the two variables. The study uses a data sample of 29 colleges from the Online University Database. Descriptive statistics and a scatter plot are used to analyze the data. The regression equation y=0.2845x+25.423 is estimated to best describe the relationship. Recommendations include evaluating the quality of online education and improving service delivery in institutions with low retention and graduation rates.

Linear Regression Report

Conduct a linear regression analysis to examine the association between retention rate and graduation rate for online colleges in the United States.

   Added on 2023-04-21

ShareRelated Documents
Economics and Quantitative Analysis
1
ECONOMICS AND QUANTITAIVE ANALYSIS
by Students Name
Course
Professor
University
City
Date
Linear Regression Report_1
Economics and Quantitative Analysis
2
Linear Regression Report
Purpose
The main aim of this report was to evaluate the relationship between the graduation
and the retention rate. This was be achieved by conducting a linear regression analysis.
Background
Online education is one of the technologies that is hastily sweeping across the
Australian education sector. Unlike in the past education system, currently individuals are
able to take university programmes at the comfort of their homes (Rubin 2012). No more
need to go to classrooms thanks to the quickly spreading internet coverage in the continent.
Due to the demand for education schedules that are flexible and time saving more and more
colleges are availing the online study programmes in their curriculum (Dunlap & Lowenthal
2010). Despite the advantage of making education more accessible the online studies have
made it hard for students to have a merit of evaluating the best school to attend. To assist
with this dilemma economists have come up with two rates that is the retention rate (RR0 and
the graduation rate (GR) (Callahan & Belcheir 2017).
RR is the percentage of first year students who enrol back in the same institution to
continue with their studies for the second year (University of Arkansas 2014). Meanwhile
graduation rate is the proportion o students in a college who join in first year and goes ahead
to graduate in at least 150% of the time needed to complete a programme.
Method
The study uses a data sample of 29 colleges from the Online University Database
which were selected at random. So as to conduct the regression analysis we modelled the
simple linear regression, in addition a scatter plot was drawn and a linear equation estimated
(Berg, 2009). This were analysed so as to arrive at the relevant conclusions. Analysis was
conducted using the Microsoft Excel software
Results
a. Descriptive statistics is a quantitative breakdown of the sample data to reflect
measures. In the table below we have a summary of measures of central tendency,
measures pf dispersion among others.
Linear Regression Report_2
Economics and Quantitative Analysis
3
RR(%) GR(%)
Mean 57.4137931 Mean 41.75862069
Standard Error 4.315602704 Standard Error 1.832018976
Median 60 Median 39
Mode 51 Mode 36
Standard Deviation 23.24023181 Standard Deviation 9.865724115
Sample Variance 540.1083744 Sample Variance 97.33251232
Kurtosis 0.461757455 Kurtosis -0.882399313
Skewness -0.309920645 Skewness 0.176364432
Range 96 Range 36
Minimum 4 Minimum 25
Maximum 100 Maximum 61
Sum 1665 Sum 1211
Count 29 Count 29
Largest(1) 100 Largest(1) 61
Smallest(1) 4 Smallest(1) 25
b. The scatter plot gives an insight in to the association between two variables. The
figure displayed below has been drawn from the sample data of RR against GR.
By looking at the pattern of the points on the chart it can be interpreted that the two
variables have a positive correlation (Tofallis 2009). The RR is the independent
variable representing x axis while the GR is the dependent variable which is the y
axis.
c. The line of best fit drawn from the points in the scatter plot can be explained by the
equation y=0.2845 x +25.423. This is the estimated regression equation that explains
Linear Regression Report_3

End of preview

Want to access all the pages? Upload your documents or become a member.

Related Documents
Linear Regression Report on Retention and Graduation Rates
|7
|1843
|369

Linear Regression Report on RR and GR Relationship in Online Education
|8
|1668
|291

Linear Regression Report
|7
|1961
|158

Analyzing the Relationship between Retention and Graduation Rates in Colleges: A Quantitative Analysis
|7
|1790
|224

Simple Linear Regression Analysis
|8
|1789
|301

Linear Regression Analysis of Graduation and Retention Rates in Online Education
|7
|1771
|365