Analyzing the Relationship between Retention and Graduation Rates in Colleges: A Quantitative Analysis
Added on 2023-04-25
7 Pages1790 Words224 Views
Economics and Quantitative Analysis
Purpose
The spread of internet coverage across the globe has catalyses technological
innovations. One of the sectors that have seen massive development as a result of the
increased internet access is education. The number of universities offering online
programmes have since increased (Craig 2015). The online study programmes have increased
access to education, this though have come with a number of challenges to the sector. One of
the challenges is the issue of identifying the right college to enrol in. For this reason, the
report focuses on analysing the relationship between the retention and the graduation rates
and developing an equation that can be used to explain the two variables
Background
Choosing the right college to enrol in for a course is one of the most difficult life time
choices that students are often faced with. To ease this selection dilemma two ratios have
been put forward by economists, that is the retention and the graduation rate. By definition
GR is the proportion of students who join a college in first year and goes ahead to graduate in
a time period that is at least 150% of the normal time needed to finish a course (Morris 2018).
This rate can be used by stake holders to gauge the number of students who are able to
graduate from an institution in an appropriate timeline. Meanwhile RR, measures the
proportion of the first-year students who enrol back in the institution for second year of study.
The retention rate is vital in evaluating if an institution is living up to the standards that it sets
during students’ enrolment (Anstine 2013). The students that are retained in the school till
their final year will form part of the number that are able to graduate from the institution, for
this reason its possible that the two rates correlates. The focus of this report is to analyse the
nature of the association (Sabbah 2011).
Method
The analysis used secondary data that was obtained from the online Educational
Database. The Online Educational Database is an organisation that is independently set up to
generate a list of accredited universities in Australia. The data sample consists of retention
rate and graduation rate from 29 colleges selected at random from the database. The focus of
the analysis was to study the association between the two rates. In this regard a scatter plot
was drawn in addition to estimating a regression equation. Moreover, a simple linear model
was developed to study the significant of the regression equation. The analysis was conducted
using Microsoft Excel software.
Results
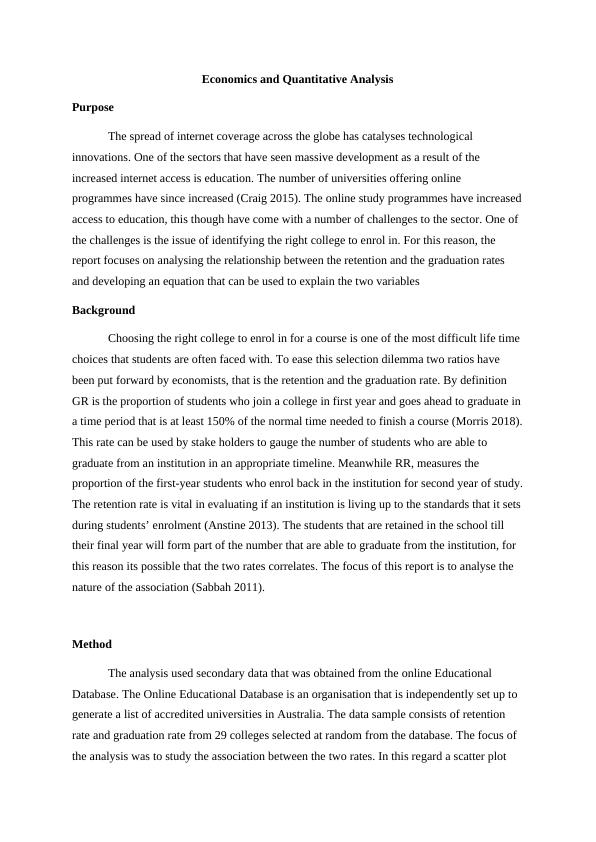
a. The table summarises the descriptive statistics
Descriptive analysis
RR(%) GR(%)
Mean 57.4137931 Mean 41.75862069
Standard Error 4.315602704 Standard Error 1.832018976
Median 60 Median 39
Mode 51 Mode 36
Standard Deviation 23.24023181 Standard Deviation 9.865724115
Sample Variance 540.1083744 Sample Variance 97.33251232
Kurtosis 0.461757455 Kurtosis -0.882399313
Skewness -0.309920645 Skewness 0.176364432
Range 96 Range 36
Minimum 4 Minimum 25
Maximum 100 Maximum 61
Sum 1665 Sum 1211
Count 29 Count 29
Largest(1) 100 Largest(1) 61
Smallest(1) 4 Smallest(1) 25
b. The scatter diagram visualises the relationship between RR and GR. The RR is the
independent variable (x) while GR is the dependent variable (y).
was developed to study the significant of the regression equation. The analysis was conducted
using Microsoft Excel software.
Results
a. The table summarises the descriptive statistics
Descriptive analysis
RR(%) GR(%)
Mean 57.4137931 Mean 41.75862069
Standard Error 4.315602704 Standard Error 1.832018976
Median 60 Median 39
Mode 51 Mode 36
Standard Deviation 23.24023181 Standard Deviation 9.865724115
Sample Variance 540.1083744 Sample Variance 97.33251232
Kurtosis 0.461757455 Kurtosis -0.882399313
Skewness -0.309920645 Skewness 0.176364432
Range 96 Range 36
Minimum 4 Minimum 25
Maximum 100 Maximum 61
Sum 1665 Sum 1211
Count 29 Count 29
Largest(1) 100 Largest(1) 61
Smallest(1) 4 Smallest(1) 25
b. The scatter diagram visualises the relationship between RR and GR. The RR is the
independent variable (x) while GR is the dependent variable (y).
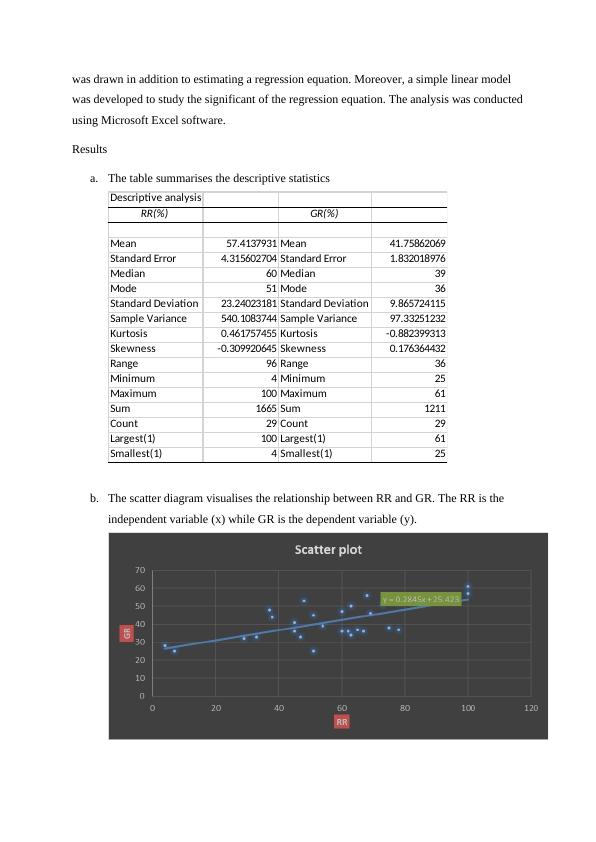
By observing the scatter diagram, it can be concluded that RR and GR have a positive
correlation. This is proven by the dots in the graph that are increasing from left to
right (Vce Further Maths Tutorials 2011). Hence, when the value of RR increases
(decreases) the GR values will also increase (decrease).
c. When a line of best fit is drawn in the scatter plot a regression equation can be
obtained. The equation y=0.2845 x +25.423 is obtained to best describe the
correlation between the two rates. In this equation RR is represented by x while GR
by y. The positive gradient shows that the two variables have a positive association
(Malakooti 2013).
d. The equation estimated to best explain the relationship between RR and GR is
y=0.2845 x +25.423.When the RR is 0% institutions are expected to have a
graduation rate of 25.423% as explained by the y intercept of the equation. From the
gradient of the equation we can deduce that an increase in RR by 1 % will lead to a
0.2845% increase in the value of GR. The slope gives an explanation of to how the
two rates relate (Stephanie 2019).
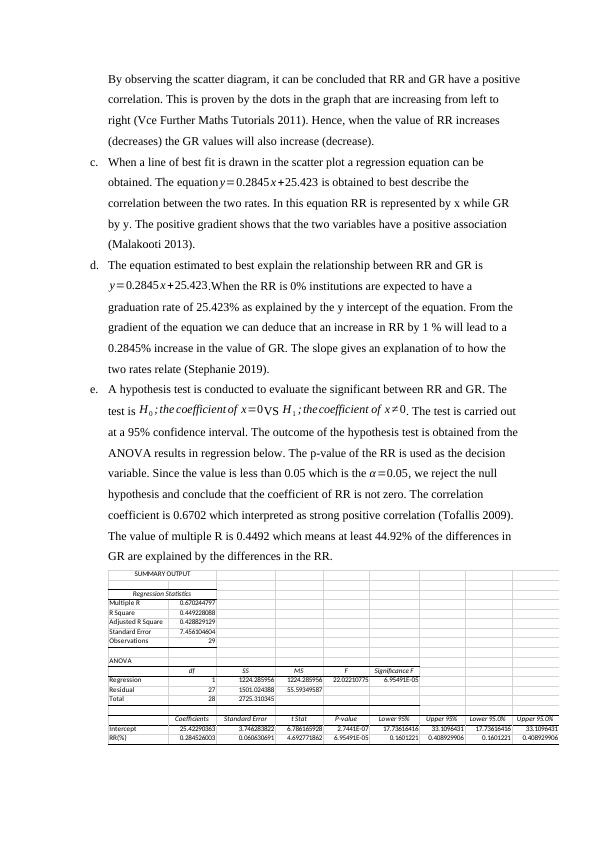
e. A hypothesis test is conducted to evaluate the significant between RR and GR. The
test is H0 ; the coefficient of x=0VS H1 ; thecoefficient of x ≠ 0. The test is carried out
at a 95% confidence interval. The outcome of the hypothesis test is obtained from the
ANOVA results in regression below. The p-value of the RR is used as the decision
variable. Since the value is less than 0.05 which is the α =0.05, we reject the null
hypothesis and conclude that the coefficient of RR is not zero. The correlation
coefficient is 0.6702 which interpreted as strong positive correlation (Tofallis 2009).
The value of multiple R is 0.4492 which means at least 44.92% of the differences in
GR are explained by the differences in the RR.
Multiple R 0.670244797
R Square 0.449228088
Adjusted R Square 0.428829129
Standard Error 7.456104604
Observations 29
ANOVA
df SS MS F Significance F
Regression 1 1224.285956 1224.285956 22.02210775 6.95491E-05
Residual 27 1501.024388 55.59349587
Total 28 2725.310345
Coefficients Standard Error t Stat P-value Lower 95% Upper 95% Lower 95.0% Upper 95.0%
Intercept 25.42290363 3.746283822 6.786165928 2.7441E-07 17.73616416 33.1096431 17.73616416 33.1096431
RR(%) 0.284526003 0.060630691 4.692771862 6.95491E-05 0.1601221 0.408929906 0.1601221 0.408929906
Regression Statistics
SUMMARY OUTPUT
correlation. This is proven by the dots in the graph that are increasing from left to
right (Vce Further Maths Tutorials 2011). Hence, when the value of RR increases
(decreases) the GR values will also increase (decrease).
c. When a line of best fit is drawn in the scatter plot a regression equation can be
obtained. The equation y=0.2845 x +25.423 is obtained to best describe the
correlation between the two rates. In this equation RR is represented by x while GR
by y. The positive gradient shows that the two variables have a positive association
(Malakooti 2013).
d. The equation estimated to best explain the relationship between RR and GR is
y=0.2845 x +25.423.When the RR is 0% institutions are expected to have a
graduation rate of 25.423% as explained by the y intercept of the equation. From the
gradient of the equation we can deduce that an increase in RR by 1 % will lead to a
0.2845% increase in the value of GR. The slope gives an explanation of to how the
two rates relate (Stephanie 2019).
e. A hypothesis test is conducted to evaluate the significant between RR and GR. The
test is H0 ; the coefficient of x=0VS H1 ; thecoefficient of x ≠ 0. The test is carried out
at a 95% confidence interval. The outcome of the hypothesis test is obtained from the
ANOVA results in regression below. The p-value of the RR is used as the decision
variable. Since the value is less than 0.05 which is the α =0.05, we reject the null
hypothesis and conclude that the coefficient of RR is not zero. The correlation
coefficient is 0.6702 which interpreted as strong positive correlation (Tofallis 2009).
The value of multiple R is 0.4492 which means at least 44.92% of the differences in
GR are explained by the differences in the RR.
Multiple R 0.670244797
R Square 0.449228088
Adjusted R Square 0.428829129
Standard Error 7.456104604
Observations 29
ANOVA
df SS MS F Significance F
Regression 1 1224.285956 1224.285956 22.02210775 6.95491E-05
Residual 27 1501.024388 55.59349587
Total 28 2725.310345
Coefficients Standard Error t Stat P-value Lower 95% Upper 95% Lower 95.0% Upper 95.0%
Intercept 25.42290363 3.746283822 6.786165928 2.7441E-07 17.73616416 33.1096431 17.73616416 33.1096431
RR(%) 0.284526003 0.060630691 4.692771862 6.95491E-05 0.1601221 0.408929906 0.1601221 0.408929906
Regression Statistics
SUMMARY OUTPUT
End of preview
Want to access all the pages? Upload your documents or become a member.
Related Documents
Linear Regression Reportlg...
|7
|1961
|158
Linear Regression Reportlg...
|8
|1876
|378
Linear Regression Report on Retention and Graduation Rateslg...
|7
|1843
|369
Simple Linear Regression Analysislg...
|8
|1789
|301
Linear Regression Analysis of Graduation and Retention Rates in Online Educationlg...
|7
|1771
|365
Linear Regression Report on RR and GR Relationship in Online Educationlg...
|8
|1668
|291