logo

Linear Regression Report

Conduct a linear regression analysis to examine the association between retention rate and graduation rate for online colleges in the United States.

7 Pages1961 Words158 Views
   

Added on  2023-04-20

About This Document

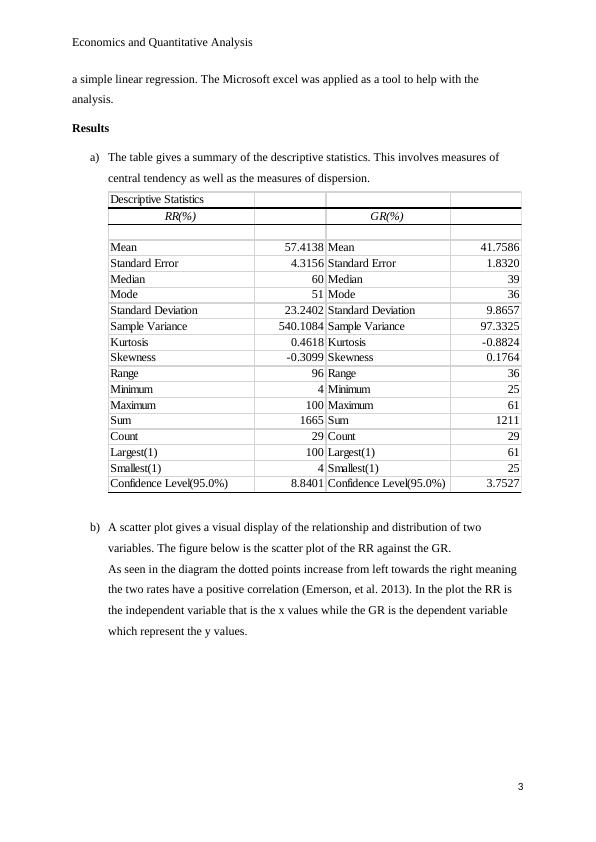
This report conducts a linear regression analysis to estimate the regression equation that can be used to predict graduation rates based on retention rates. The study analyzes a sample of 29 colleges from an online educational database and provides descriptive statistics, scatter plot, regression equation, and policy implications.

Linear Regression Report

Conduct a linear regression analysis to examine the association between retention rate and graduation rate for online colleges in the United States.

   Added on 2023-04-20

ShareRelated Documents
Economics and Quantitative Analysis
Institution Name
Student Name
1
Linear Regression Report_1
Economics and Quantitative Analysis
Linear Regression Report
Purpose
The retention and graduation rates can both be applied as scales for evaluating the
quality of education offered by an institution. The major objective of this report will be to
conduct a linear regression analysis. Moreover, will estimate the regression equation that can
be used to predict the GR values in situations where the RR values are present.
Background
The change in the higher education has been propelled by a number of drivers in
recent times; technology, economy, globalization and changing demographics being just a
few. Even though each of these drivers have a significant impact, most researchers are in
agreement that online learning has disrupted the normal system of education (University of
Arkansas 2014). This technology has led to emergence of simple, accessible and affordable
education patterns. From 1970s to date the technology have tremendously developed with
several institutions joining in to offer online programmes (Rubin 2012). Despite the
improvement in education accessibility students and parents have been thrown into a
dilemma when it comes to selecting the right college to attend. To assist with this selection
problem two rates of interest have emerged, that is the retention rate (RR) and the graduation
rate (GR) (Dunlap & Lowenthal 2010).
The association between RR and GR do vary in a number of ways when dealing with
the online courses as compared to the traditional system. Graduation rate is the proportion of
students who join a college in first year and manages to graduate within 150% of the time
normally needed to complete a programme. (Callahan & Belcheir 2017). Meanwhile the RR
is the percentage of the first time first year students who enrol to continue with their second-
year studies in the same college.
Method
The RR and GR are important because they can be used to rank institutions based on
quality of education provided. In this study, a sample of 29 colleges from the online
educational database were selected at random and used to analyse the relationship between
the RR and GR (Berg, 2009). The Online Educational Database is an enterprise independently
tasked with generating a list of accredited institutions in Australia. Some of the approaches
that the analysis took is drawing a scatter plot, estimating regression line as well as modelling
2
Linear Regression Report_2
Economics and Quantitative Analysis
a simple linear regression. The Microsoft excel was applied as a tool to help with the
analysis.
Results
a) The table gives a summary of the descriptive statistics. This involves measures of
central tendency as well as the measures of dispersion.
Descriptive Statistics
RR(%) GR(%)
Mean 57.4138 Mean 41.7586
Standard Error 4.3156 Standard Error 1.8320
Median 60 Median 39
Mode 51 Mode 36
Standard Deviation 23.2402 Standard Deviation 9.8657
Sample Variance 540.1084 Sample Variance 97.3325
Kurtosis 0.4618 Kurtosis -0.8824
Skewness -0.3099 Skewness 0.1764
Range 96 Range 36
Minimum 4 Minimum 25
Maximum 100 Maximum 61
Sum 1665 Sum 1211
Count 29 Count 29
Largest(1) 100 Largest(1) 61
Smallest(1) 4 Smallest(1) 25
Confidence Level(95.0%) 8.8401 Confidence Level(95.0%) 3.7527
b) A scatter plot gives a visual display of the relationship and distribution of two
variables. The figure below is the scatter plot of the RR against the GR.
As seen in the diagram the dotted points increase from left towards the right meaning
the two rates have a positive correlation (Emerson, et al. 2013). In the plot the RR is
the independent variable that is the x values while the GR is the dependent variable
which represent the y values.
3
Linear Regression Report_3

End of preview

Want to access all the pages? Upload your documents or become a member.

Related Documents
Linear Regression Report on Retention and Graduation Rates
|7
|1843
|369

Linear Regression Report
|8
|1876
|378

Linear Regression Report on RR and GR Relationship in Online Education
|8
|1668
|291

Analyzing the Relationship between Retention and Graduation Rates in Colleges: A Quantitative Analysis
|7
|1790
|224

Linear Regression Analysis of Graduation and Retention Rates in Online Education
|7
|1771
|365

Simple Linear Regression Analysis
|8
|1789
|301