Air New Zealand Limited Financial Performance Analysis Report
VerifiedAdded on 2020/10/22
|20
|6653
|106
Report
AI Summary
This report provides a comprehensive financial analysis of Air New Zealand Limited, evaluating its performance through various financial ratios, including profitability, liquidity, efficiency, and market value ratios. The analysis encompasses a comparative study with Kingfisher Plc, examining their income statements and balance sheets using horizontal and vertical analysis techniques. The report delves into the gross profit margin, operating income, and net profit margin of both companies, highlighting their respective strengths and weaknesses. It also assesses liquidity positions through current and quick ratios, inventory turnover, and interest coverage ratios. Furthermore, the report includes a horizontal analysis of Air New Zealand's income statement, detailing changes in revenue, cost of goods sold, operating expenses, and net income over a three-year period. A vertical analysis is also conducted to assess the percentage changes in key financial metrics. The conclusion identifies which company demonstrates a better financial position and market value, based on the comparative analysis.

AIR NEW ZEALAND
LIMITED
LIMITED
Paraphrase This Document
Need a fresh take? Get an instant paraphrase of this document with our AI Paraphraser
TABLE OF CONTENTS
INTRODUCTION...........................................................................................................................1
MAIN BODY...................................................................................................................................1
Financial ratio analysis...........................................................................................................1
Horizontal analysis.................................................................................................................3
Vertical analysis ....................................................................................................................4
Horizontal Analysis................................................................................................................6
Vertical analysis.....................................................................................................................7
CONCLUSION................................................................................................................................8
REFERENCES................................................................................................................................9
APPENDIX....................................................................................................................................10
EXECUTIVE SUMMARY
Financial performance indicator is the predefined structure which help the organization to
identify and analyse the organization's performance. This can be done with calculation of
different financial ratios such as profitability, liquidity, market value, investment and efficiency
ratio. In this present report, This can be done with calculation of different financial ratios such as
profitability, liquidity, market value, investment and efficiency ratio. Gross profit margin of
Kingfisher Plc has seen slight increment from 2015 to 2017 of around $.03 million. This not a
major increment for a big organisation in a period of 3 years. For Air New Zealand limited the
growth was 77.89% in 2015 to 83.81% in 2017, there is slight more increase in profits as
compared to Kingfisher. The will remain unhold 106 to 110 days in Kingfisher Plc and in new
air it is between 41 to 48 days. This indicates that inventory is fast moving in New air as it has a
time period of less than 50 days. The interest coverage ratio for Air new was 5.39 in 2105 and
7.06 in 2107 this shows that company is putting its step forward to cover its interest expenses.
For Kingfisher plc earnings were 0. 24 in 2015, 0.18 in 2016 and 0.51 in 2017. Earnings per
share are very low for all three years yet it is increasing with a slow pace. For Air New earnings
in 2015 and 2016 were 23.31 and 40.21 respectively. This shows that company provides a good
return to shareholders on their investments.
⊘ This is a preview!⊘
Do you want full access?
Subscribe today to unlock all pages.
Trusted by 1+ million students worldwide
INTRODUCTION
Financial performance indicator of an organisation is the analysis and evaluation of
accounting statements. This can be done with calculation of different financial ratios such as
profitability, liquidity, market value, investment and efficiency ratio. A comparison of two
different firms in same industry can also be carried out with comparison of these ratios. In the
present case study, This can be done with calculation of different financial ratios such as
profitability, liquidity, market value, investment and efficiency ratio It is done in a way of
evaluation of their income statement and balance sheet in form of vertical and horizontal
analysis. A ratio analysis of both organisations is also presented in this report. At the end of this
report, it will present one company from both of them which has a better financial position and
market value.
MAIN BODY
Financial ratio analysis
Profitability ratios
Gross profit margin of Kingfisher Plc has seen slight increment from 2015 to 2017 of
around $.03 million. This not a major increment for a big organisation in a period of 3 years. For
Air New Zealand limited the growth was 77.89% in 2015 to 83.81% in 2017, there is slight more
increase in profits as compared to Kingfisher (Gub & et.al., 2015). for operating income it can
be said that Air New Zealand have seen a increment in 2016 and then a downfall in 2017, there is
consistent rise in operating income of kingfisher Plc. Same is the case with net profit margin for
both organisations. This can be said that kingfisher have gained a control over its operating
overhead and it is reflected in its net profits. Though gross profits of Air new Zealand Limited
are very high for every year but it does not have an effective control over its administrative cost
and this resulted in lower net profit margin and also, they are decreasing in this period of 3 years.
Liquidity ration
The liquidity position of both firms is compared through current and quick ratios. Current
ratio for all the three years is below 1 which is not a good sign of liquidity position for a
business. For Kingfisher Plc in two years it was constant and for 2014 it rose to 1.3 with a minor
1
Paraphrase This Document
Need a fresh take? Get an instant paraphrase of this document with our AI Paraphraser
increment. Quick ratio for Air new Zealand Limited was constant for all three years with minor
ups and down and of Kingfisher plc it felled down by 0.10. This indicates that both of them not
enjoy a liquidity position and do not have sufficient cash and profit equivalent resource to meet
their current liabilities (Financial ratio, 2018). This ratio ensures short term solvency of business
in meeting small debts at right time.
Air new Zealand Limited is not even near the standard ratio of 2:1. when a comparison of
these ratios of both companies is done it is found that kingfisher plc has a better liquidity
position as compared to new air. The will remain unhold 106 to 110 days in Kingfisher Plc and
in new air it is between 41 to 48 days. This indicates that inventory is fast moving in New air as
it has a time period of less than 50 days.
Efficiency ratio
Returns earned on assets for Air New Zealand limited was 5.3 in 2015 which saw an
increment in next year in 2017 fell down to 5.18. For Kingfisher Plc there was an increment from
2015 to 2017 by 0.22, though it is a minor increment yet there is an slight progress rather than
increase in ratio of Air New Zealand Limited . Earning on capital employed for Air new was
constant for both 2015 and 2017 at 9.02 and with an increase in 2016 as 11.07. In Kingfisher Plc
as for 2015 it was 5.9 it decreased in 2016 to 4.25 and again increased to 6.12, this reflects that
company has again maintained its position and earned sufficient return on its capital employed.
The interest coverage ratio for Air new was 5.39 in 2105 and 7.06 in 2107 this shows that
company is putting its step forward to cover its interest expenses (Read & et.al., 2016).
Kingfisher Plc has a very high interest coverage that means it have higher resources to cover its
interest expenses and also, it has more debt in this capital structure. For 2015 ratio was 31.12
which increased to 41.12 by 2017, In a period of mere 2 years this ratio increased by 10, which
indicates company is highly relying on debt capital which attracts interest.
Market ratio:
The ratio calculates actual earning for shareholders and which is a financial performance
indicator in market.To increase in the earning per share of the organization is the main aim of the
shareholder to invest in it For Kingfisher plc earnings were 0. 24 in 2015, 0.18 in 2016 and 0.51
in 2017. Earnings per share are very low for all three years yet it is increasing with a slow pace.
2
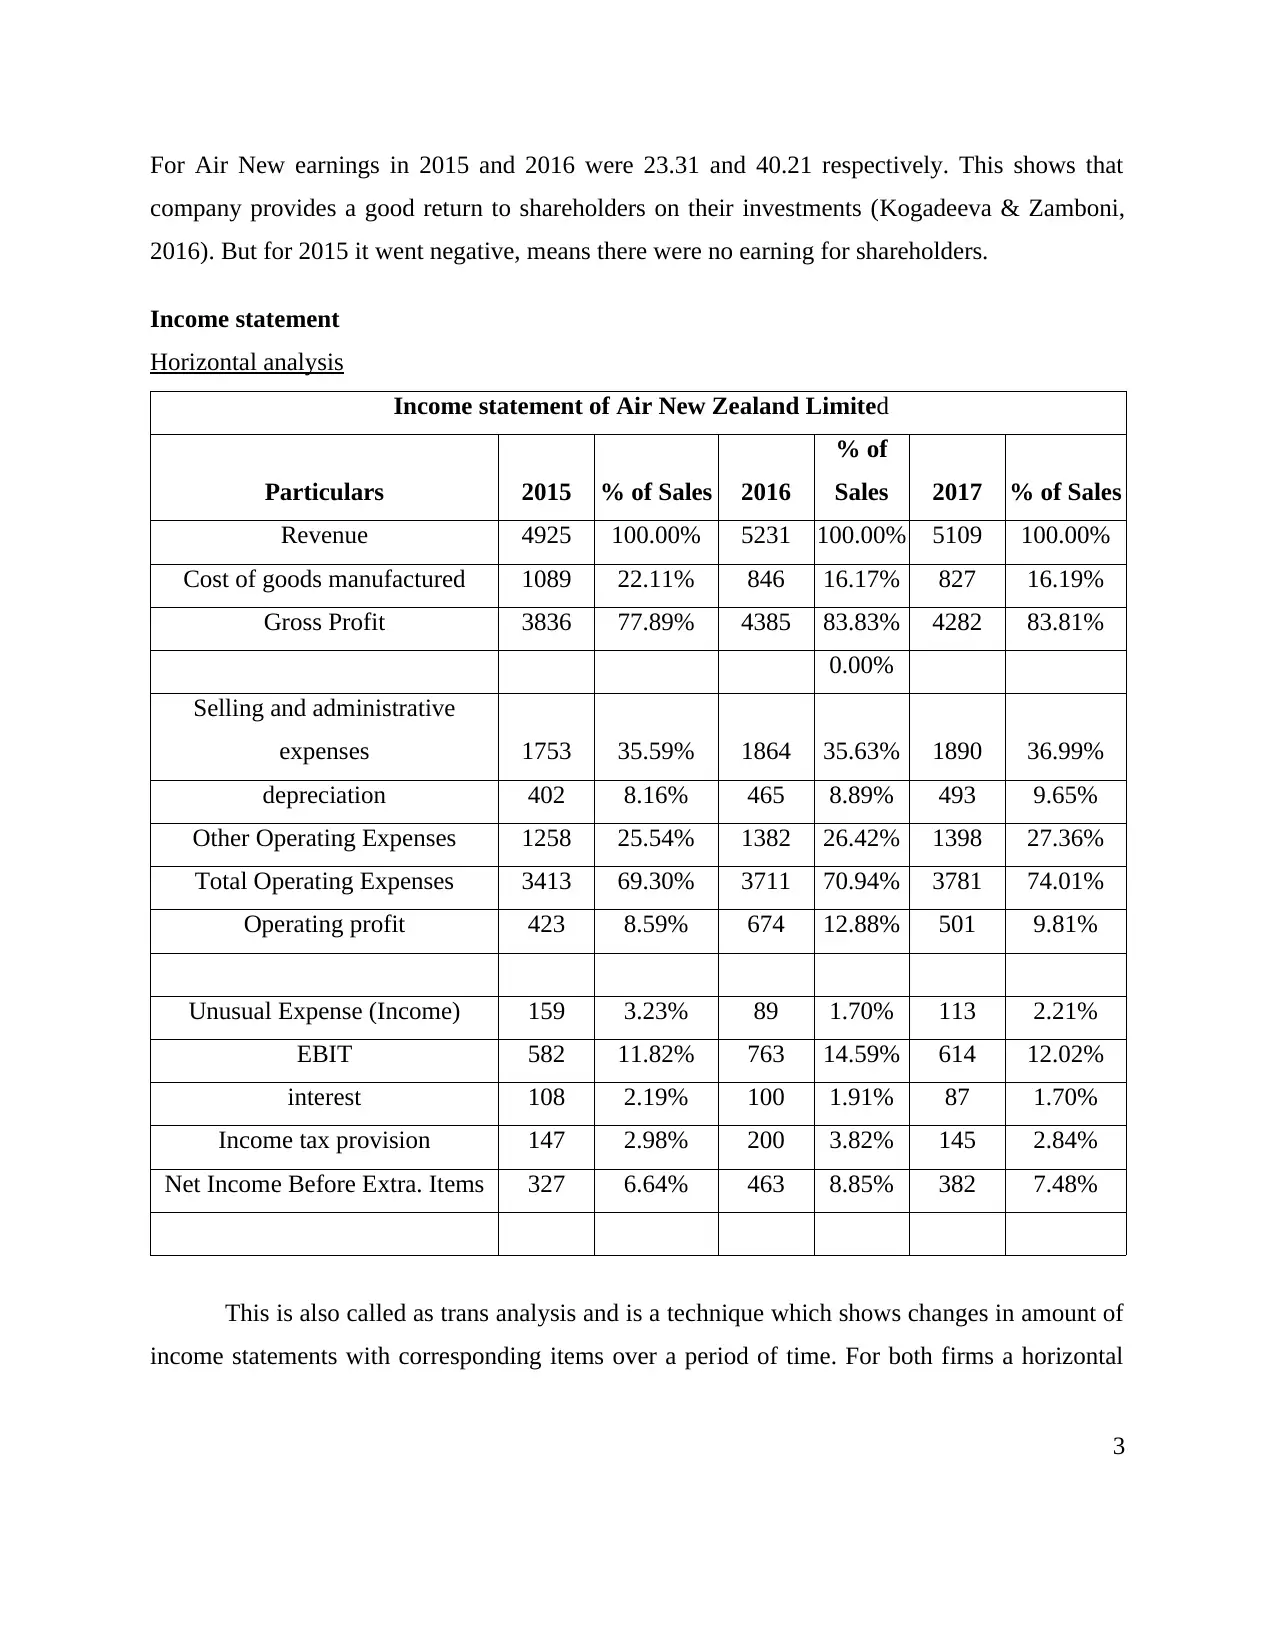
For Air New earnings in 2015 and 2016 were 23.31 and 40.21 respectively. This shows that
company provides a good return to shareholders on their investments (Kogadeeva & Zamboni,
2016). But for 2015 it went negative, means there were no earning for shareholders.
Income statement
Horizontal analysis
Income statement of Air New Zealand Limited
Particulars 2015 % of Sales 2016
% of
Sales 2017 % of Sales
Revenue 4925 100.00% 5231 100.00% 5109 100.00%
Cost of goods manufactured 1089 22.11% 846 16.17% 827 16.19%
Gross Profit 3836 77.89% 4385 83.83% 4282 83.81%
0.00%
Selling and administrative
expenses 1753 35.59% 1864 35.63% 1890 36.99%
depreciation 402 8.16% 465 8.89% 493 9.65%
Other Operating Expenses 1258 25.54% 1382 26.42% 1398 27.36%
Total Operating Expenses 3413 69.30% 3711 70.94% 3781 74.01%
Operating profit 423 8.59% 674 12.88% 501 9.81%
Unusual Expense (Income) 159 3.23% 89 1.70% 113 2.21%
EBIT 582 11.82% 763 14.59% 614 12.02%
interest 108 2.19% 100 1.91% 87 1.70%
Income tax provision 147 2.98% 200 3.82% 145 2.84%
Net Income Before Extra. Items 327 6.64% 463 8.85% 382 7.48%
This is also called as trans analysis and is a technique which shows changes in amount of
income statements with corresponding items over a period of time. For both firms a horizontal
3
⊘ This is a preview!⊘
Do you want full access?
Subscribe today to unlock all pages.
Trusted by 1+ million students worldwide
analysis for 3 years is carried out which will reflect changes in all items present in profit and loss
account with respect to sales (Luo & et.al., 2015). This will present a year wise comparison of
both firms individually and also with each other. Gross profit margin with respect to sales for Air
New was 77.89% in 2015 and it increased to 83.83% in 2016 and remained constant for 2017,
this indicates that gross profits of firm have increased and remained constant. The operating
profits with ratio to sales indicated that it increased to 12.88% from 8.59% in 2015 and for 2016
it decreased to 9.81%. A fall in operating income can be justified as there was an increment in
the oprative expenses. over a period of these 3 years and resulted in a dragging down operating
profit of firm (de Lecea, Cooper & Smit, 2016). The net profit of firm for 2015 was 6.64%
which increased in 2016 but in 2017 it fell down to 7.48%. with this it can be stated that
company has maintained its cost control so at end of 2017 it had a net profit of 7.48 % as a
percentage to its sales.
For Kingfisher plc gross profit as a percentage to sales for 2015 was 36.91%. and for
2016 it increased to 37.31% and remained constant in 2017 with a percentage to sales of
37.19%. There was a slight increase in revenues of firm and cost of production also remained
same for all 3 years and as a result there was no huge change in gross profit percentage.
Operating profit percentage increased from 5.95% to 6.83% from 2015 – 2017. This increment
was due to control and reduction of operating expenses. Net profit of firm as a percentage to
sales was same for both 2015 and 2017 as 5.23% and 5.43%.
A comparison between income statements of both firms is carried out and it can be
stated that Kingfisher Plc have gained a control over its operating expenses which helped in
increasing it operating and net profits. Air New Zealand limited have earned unusual income and
reduced its interest expenses which resulted in increment of its net profits.
Vertical analysis
Revenue of Air New Zealand limited increased by 6.21% from 2015 to 2016 and for it
reduced by 2.33% in 2017 as compared to 2016. Gross profits increased by 14.31 % in 2016 with
2015 as base year and in2017 it reduced by 2.35% when compared to 2016, this change was due
to fall in sales revenue. Net profit increased by more than 50% in 2016 and fell down by more
than 345 in 2017 and this was a major fall (Molnar & et.al.,2018). But there was a decrement in
4
Paraphrase This Document
Need a fresh take? Get an instant paraphrase of this document with our AI Paraphraser
net profit percentage change from 2015 to 2017. The net profit were higher in 2016as compared
to 2015 and it decreased in 2017 resulted in diminishing percentage change.
Revenue of Kingfisher Plc was seen an increment in 2017 as compared to 2016 and in
2016 they saw a downfall when compared to sales revenue of 2015. With a rise in gross income,
profit percentage also increased. In 2016 all three profits that is gross, operating and net profits
were lesser than 2015but in 2017, all of them increased showing a positive gain in percentage
increments.
Kingfisher Plc have seen a fall in all three profits and sales from2015 to 2016 and in 2017
there was increment in all of them resulted in reflecting a positive percentage rise (Verma &
Suthar, 2018). Air New Zealand Limited’s profits increased in 2016 and again fell down in 2017
which was due to lack in effective control over is operating and administrative costs.
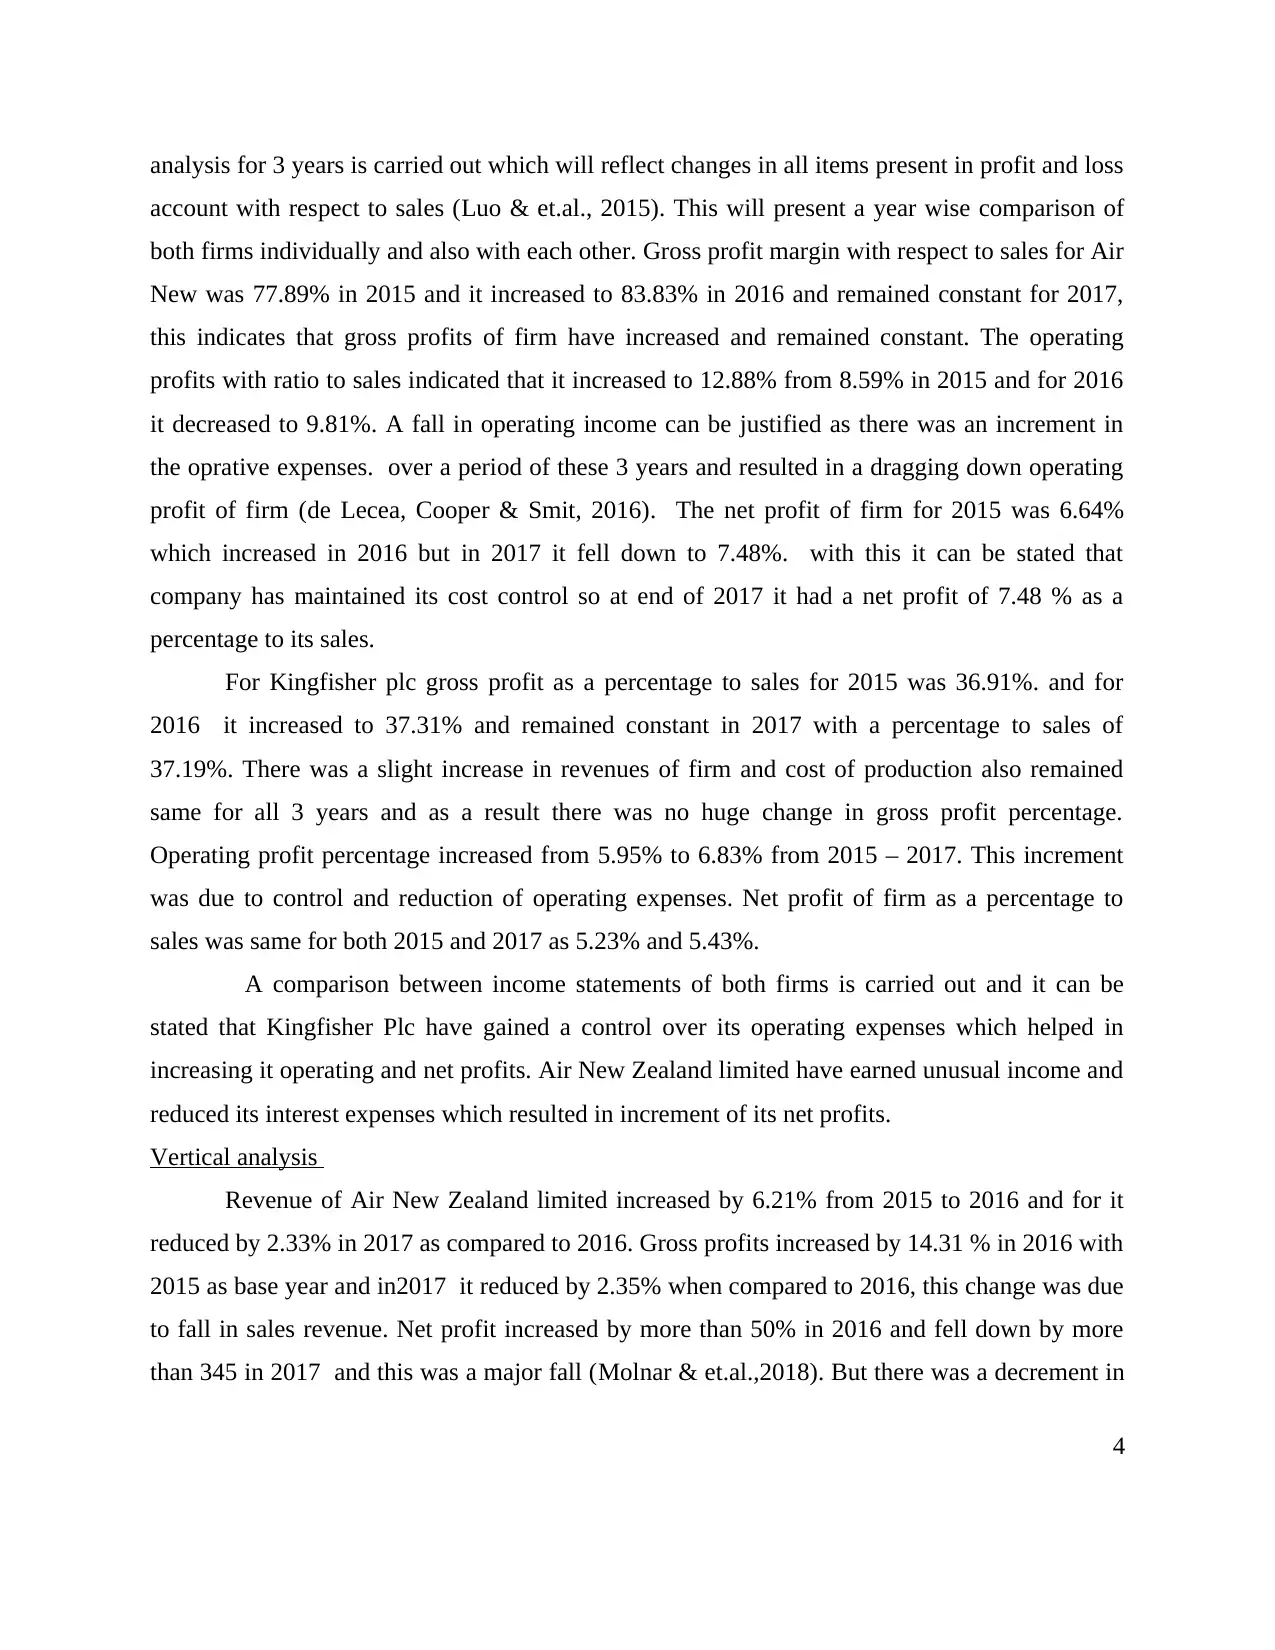
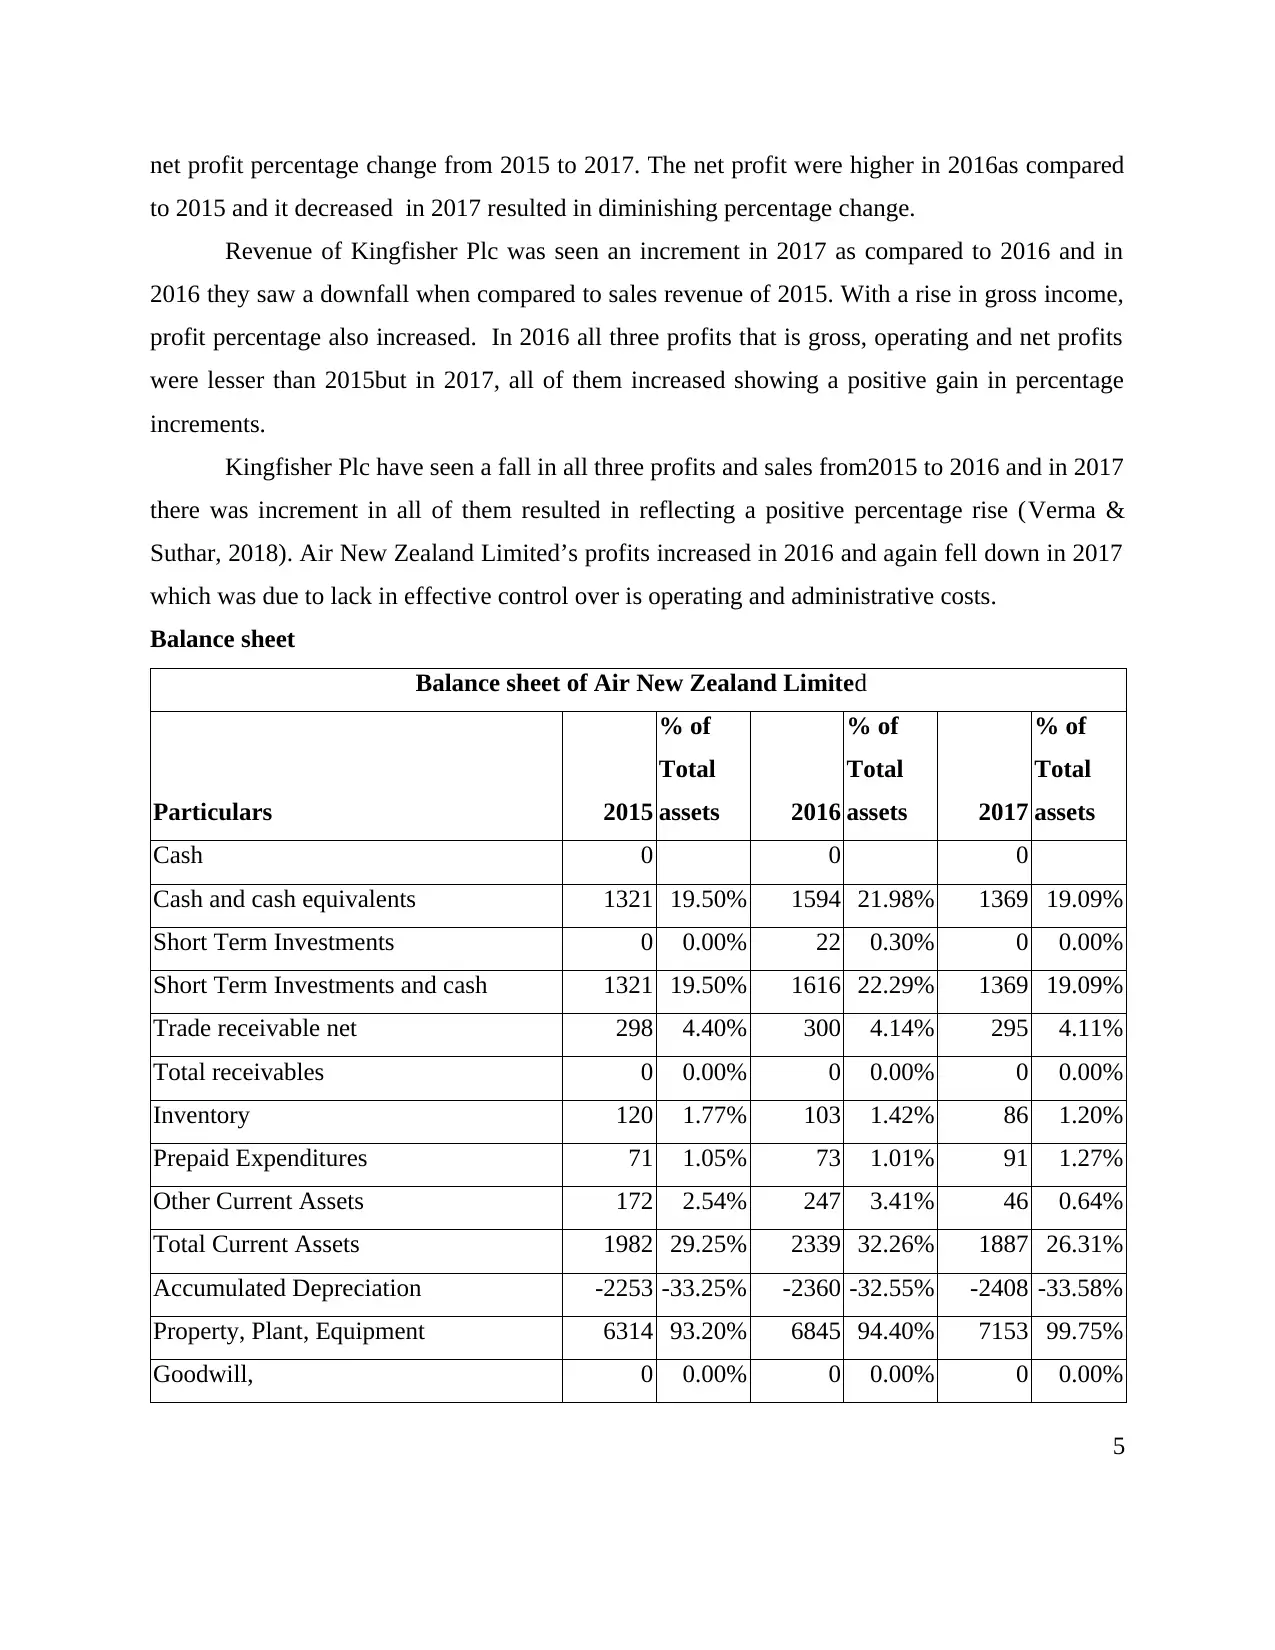
Balance sheet
Balance sheet of Air New Zealand Limited
Particulars 2015
% of
Total
assets 2016
% of
Total
assets 2017
% of
Total
assets
Cash 0 0 0
Cash and cash equivalents 1321 19.50% 1594 21.98% 1369 19.09%
Short Term Investments 0 0.00% 22 0.30% 0 0.00%
Short Term Investments and cash 1321 19.50% 1616 22.29% 1369 19.09%
Trade receivable net 298 4.40% 300 4.14% 295 4.11%
Total receivables 0 0.00% 0 0.00% 0 0.00%
Inventory 120 1.77% 103 1.42% 86 1.20%
Prepaid Expenditures 71 1.05% 73 1.01% 91 1.27%
Other Current Assets 172 2.54% 247 3.41% 46 0.64%
Total Current Assets 1982 29.25% 2339 32.26% 1887 26.31%
Accumulated Depreciation -2253 -33.25% -2360 -32.55% -2408 -33.58%
Property, Plant, Equipment 6314 93.20% 6845 94.40% 7153 99.75%
Goodwill, 0 0.00% 0 0.00% 0 0.00%
5
to 2015 and it decreased in 2017 resulted in diminishing percentage change.
Revenue of Kingfisher Plc was seen an increment in 2017 as compared to 2016 and in
2016 they saw a downfall when compared to sales revenue of 2015. With a rise in gross income,
profit percentage also increased. In 2016 all three profits that is gross, operating and net profits
were lesser than 2015but in 2017, all of them increased showing a positive gain in percentage
increments.
Kingfisher Plc have seen a fall in all three profits and sales from2015 to 2016 and in 2017
there was increment in all of them resulted in reflecting a positive percentage rise (Verma &
Suthar, 2018). Air New Zealand Limited’s profits increased in 2016 and again fell down in 2017
which was due to lack in effective control over is operating and administrative costs.
Balance sheet
Balance sheet of Air New Zealand Limited
Particulars 2015
% of
Total
assets 2016
% of
Total
assets 2017
% of
Total
assets
Cash 0 0 0
Cash and cash equivalents 1321 19.50% 1594 21.98% 1369 19.09%
Short Term Investments 0 0.00% 22 0.30% 0 0.00%
Short Term Investments and cash 1321 19.50% 1616 22.29% 1369 19.09%
Trade receivable net 298 4.40% 300 4.14% 295 4.11%
Total receivables 0 0.00% 0 0.00% 0 0.00%
Inventory 120 1.77% 103 1.42% 86 1.20%
Prepaid Expenditures 71 1.05% 73 1.01% 91 1.27%
Other Current Assets 172 2.54% 247 3.41% 46 0.64%
Total Current Assets 1982 29.25% 2339 32.26% 1887 26.31%
Accumulated Depreciation -2253 -33.25% -2360 -32.55% -2408 -33.58%
Property, Plant, Equipment 6314 93.20% 6845 94.40% 7153 99.75%
Goodwill, 0 0.00% 0 0.00% 0 0.00%
5
Intangible assets 102 1.51% 127 1.75% 149 2.08%
Long Term Investments 425 6.27% 230 3.17% 259 3.61%
Long Term (note receivable) 0 0.00% 0 0.00% 0 0.00%
Other Long Term assets 205 3.03% 70 0.97% 131 1.83%
Total Assets 6775
100.00
% 7251
100.00
% 7171
100.00
%
% of
Total
liabilitie
s and
equity
% of
Total
liabilitie
s and
equity
% of
Total
liabilitie
s and
equity
Liabilities and stock
Liabilities
Current liabilities
Short-term debt 46 0.68% 239 3.30% 132 1.84%
Capital leases 207 3.06% 225 3.10% 185 2.58%
Accounts payable 448 6.61% 453 6.25% 462 6.44%
Deferred income taxes 20 0.30% 54 0.74% 36 0.50%
Deferred revenues 1055 15.57% 1111 15.32% 1177 16.41%
Other current liability 352 5.20% 389 5.36% 413 5.76%
Total current liabilities 2128 31.41% 2471 34.08% 2405 33.54%
Non-current liabilities 0.00% 0.00% 0.00%
Long-term debt 616 9.09% 841 11.60% 1161 16.19%
Capital leases 1453 21.45% 1262 17.40% 1036 14.45%
Deferred taxes liability 228 3.37% 264 3.64% 193 2.69%
Deferred revenues 150 2.21% 161 2.22% 184 2.57%
Pensions and other ben 12 0.18% 13 0.18% 14 0.20%
6
⊘ This is a preview!⊘
Do you want full access?
Subscribe today to unlock all pages.
Trusted by 1+ million students worldwide
Minority interest 0 0.00% 0 0.00% 0 0.00%
Other long-term liabilities 223 3.29% 231 3.19% 192 2.68%
Total non-current liabilities 2682 39.59% 2672 36.85% 2780 38.77%
Total liabilities 4810 71.00% 5143 70.93% 5185 72.31%
Stockholders' equity 0.00% 0.00% 0.00%
Common stock 2286 33.74% 2252 31.06% 2238 31.21%
Other Equity 74 1.09% -129 -1.78% -236 -3.29%
Retained earnings -351 -5.18% 0 0.00% 0 0.00%
Accumulated other comp... -44 -0.65% -15 -0.21% -16 -0.22%
Total stockholders' eq... 1965 29.00% 2108 29.07% 1986 27.69%
Total liabilities and ... 6775
100.00
% 7251
100.00
% 7171
100.00
%
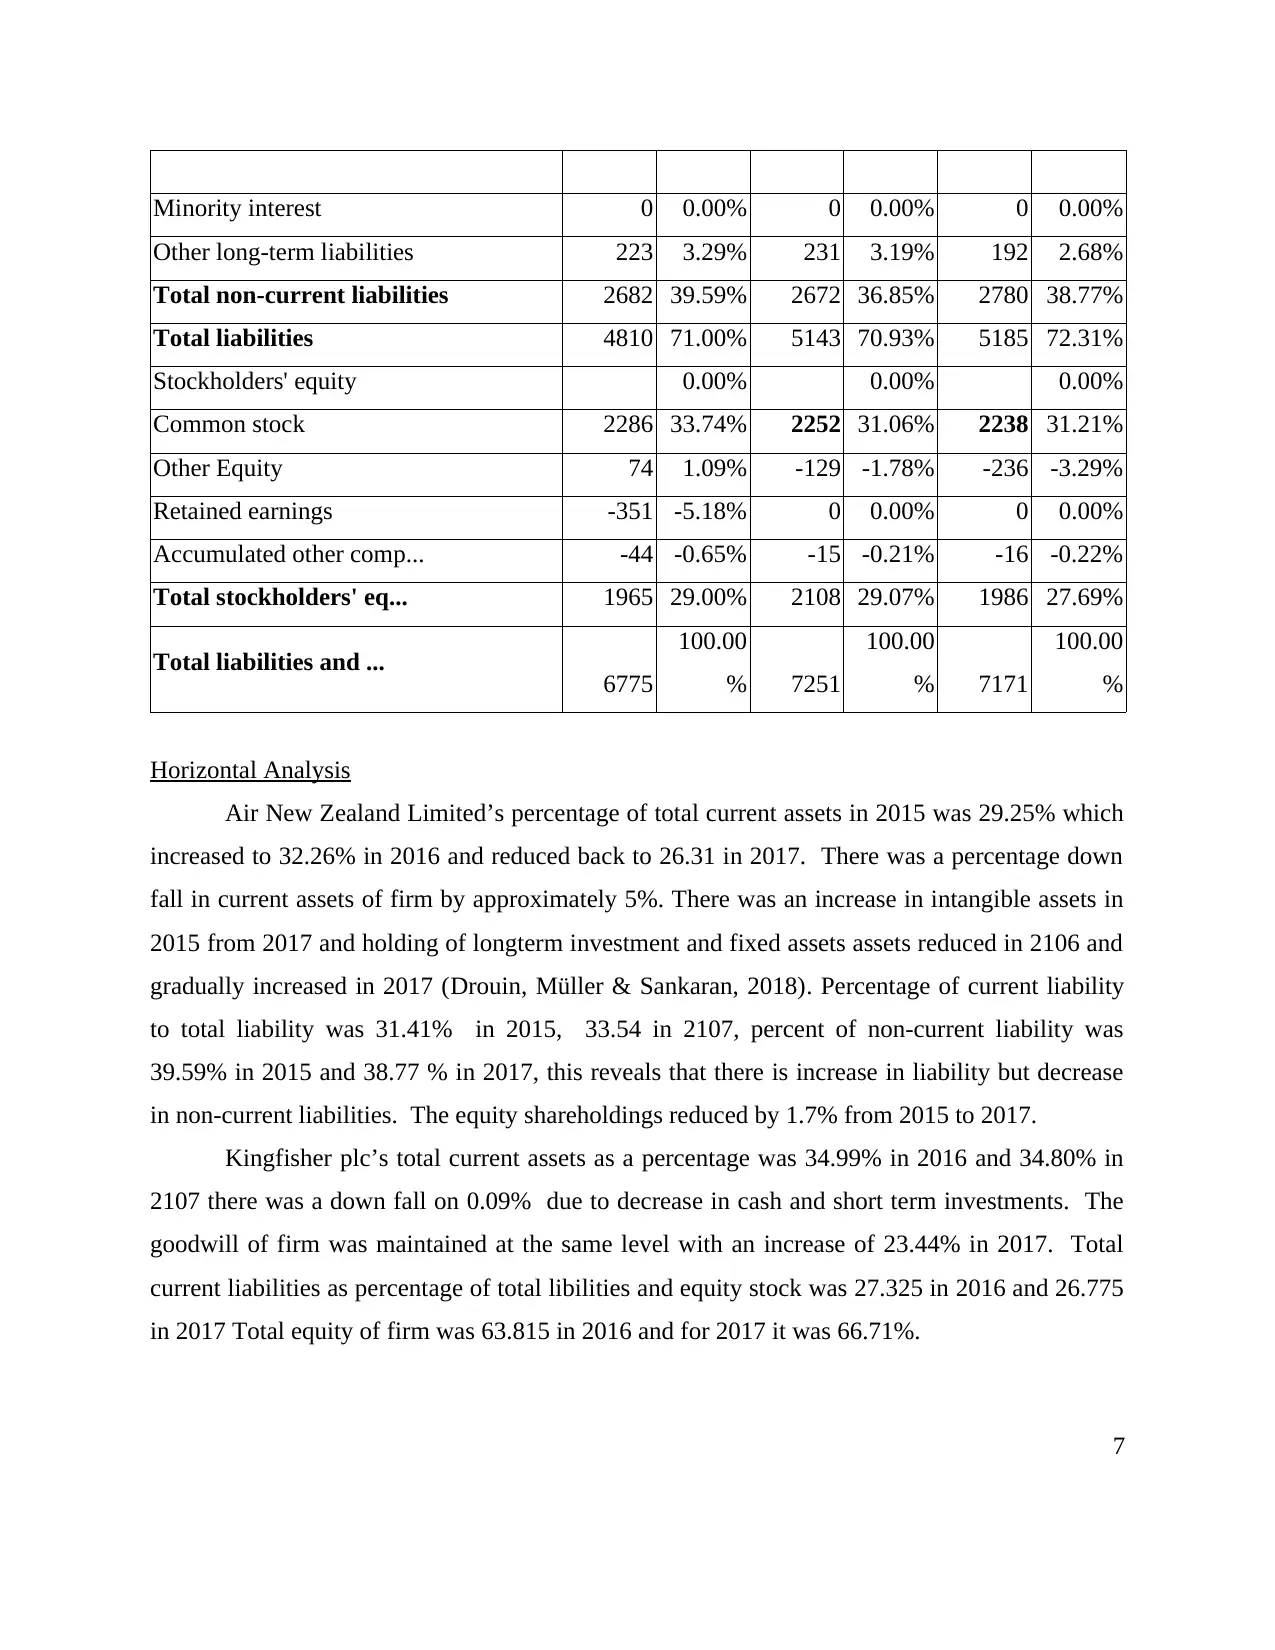
Horizontal Analysis
Air New Zealand Limited’s percentage of total current assets in 2015 was 29.25% which
increased to 32.26% in 2016 and reduced back to 26.31 in 2017. There was a percentage down
fall in current assets of firm by approximately 5%. There was an increase in intangible assets in
2015 from 2017 and holding of longterm investment and fixed assets assets reduced in 2106 and
gradually increased in 2017 (Drouin, Müller & Sankaran, 2018). Percentage of current liability
to total liability was 31.41% in 2015, 33.54 in 2107, percent of non-current liability was
39.59% in 2015 and 38.77 % in 2017, this reveals that there is increase in liability but decrease
in non-current liabilities. The equity shareholdings reduced by 1.7% from 2015 to 2017.
Kingfisher plc’s total current assets as a percentage was 34.99% in 2016 and 34.80% in
2107 there was a down fall on 0.09% due to decrease in cash and short term investments. The
goodwill of firm was maintained at the same level with an increase of 23.44% in 2017. Total
current liabilities as percentage of total libilities and equity stock was 27.325 in 2016 and 26.775
in 2017 Total equity of firm was 63.815 in 2016 and for 2017 it was 66.71%.
7
Other long-term liabilities 223 3.29% 231 3.19% 192 2.68%
Total non-current liabilities 2682 39.59% 2672 36.85% 2780 38.77%
Total liabilities 4810 71.00% 5143 70.93% 5185 72.31%
Stockholders' equity 0.00% 0.00% 0.00%
Common stock 2286 33.74% 2252 31.06% 2238 31.21%
Other Equity 74 1.09% -129 -1.78% -236 -3.29%
Retained earnings -351 -5.18% 0 0.00% 0 0.00%
Accumulated other comp... -44 -0.65% -15 -0.21% -16 -0.22%
Total stockholders' eq... 1965 29.00% 2108 29.07% 1986 27.69%
Total liabilities and ... 6775
100.00
% 7251
100.00
% 7171
100.00
%
Horizontal Analysis
Air New Zealand Limited’s percentage of total current assets in 2015 was 29.25% which
increased to 32.26% in 2016 and reduced back to 26.31 in 2017. There was a percentage down
fall in current assets of firm by approximately 5%. There was an increase in intangible assets in
2015 from 2017 and holding of longterm investment and fixed assets assets reduced in 2106 and
gradually increased in 2017 (Drouin, Müller & Sankaran, 2018). Percentage of current liability
to total liability was 31.41% in 2015, 33.54 in 2107, percent of non-current liability was
39.59% in 2015 and 38.77 % in 2017, this reveals that there is increase in liability but decrease
in non-current liabilities. The equity shareholdings reduced by 1.7% from 2015 to 2017.
Kingfisher plc’s total current assets as a percentage was 34.99% in 2016 and 34.80% in
2107 there was a down fall on 0.09% due to decrease in cash and short term investments. The
goodwill of firm was maintained at the same level with an increase of 23.44% in 2017. Total
current liabilities as percentage of total libilities and equity stock was 27.325 in 2016 and 26.775
in 2017 Total equity of firm was 63.815 in 2016 and for 2017 it was 66.71%.
7
Paraphrase This Document
Need a fresh take? Get an instant paraphrase of this document with our AI Paraphraser
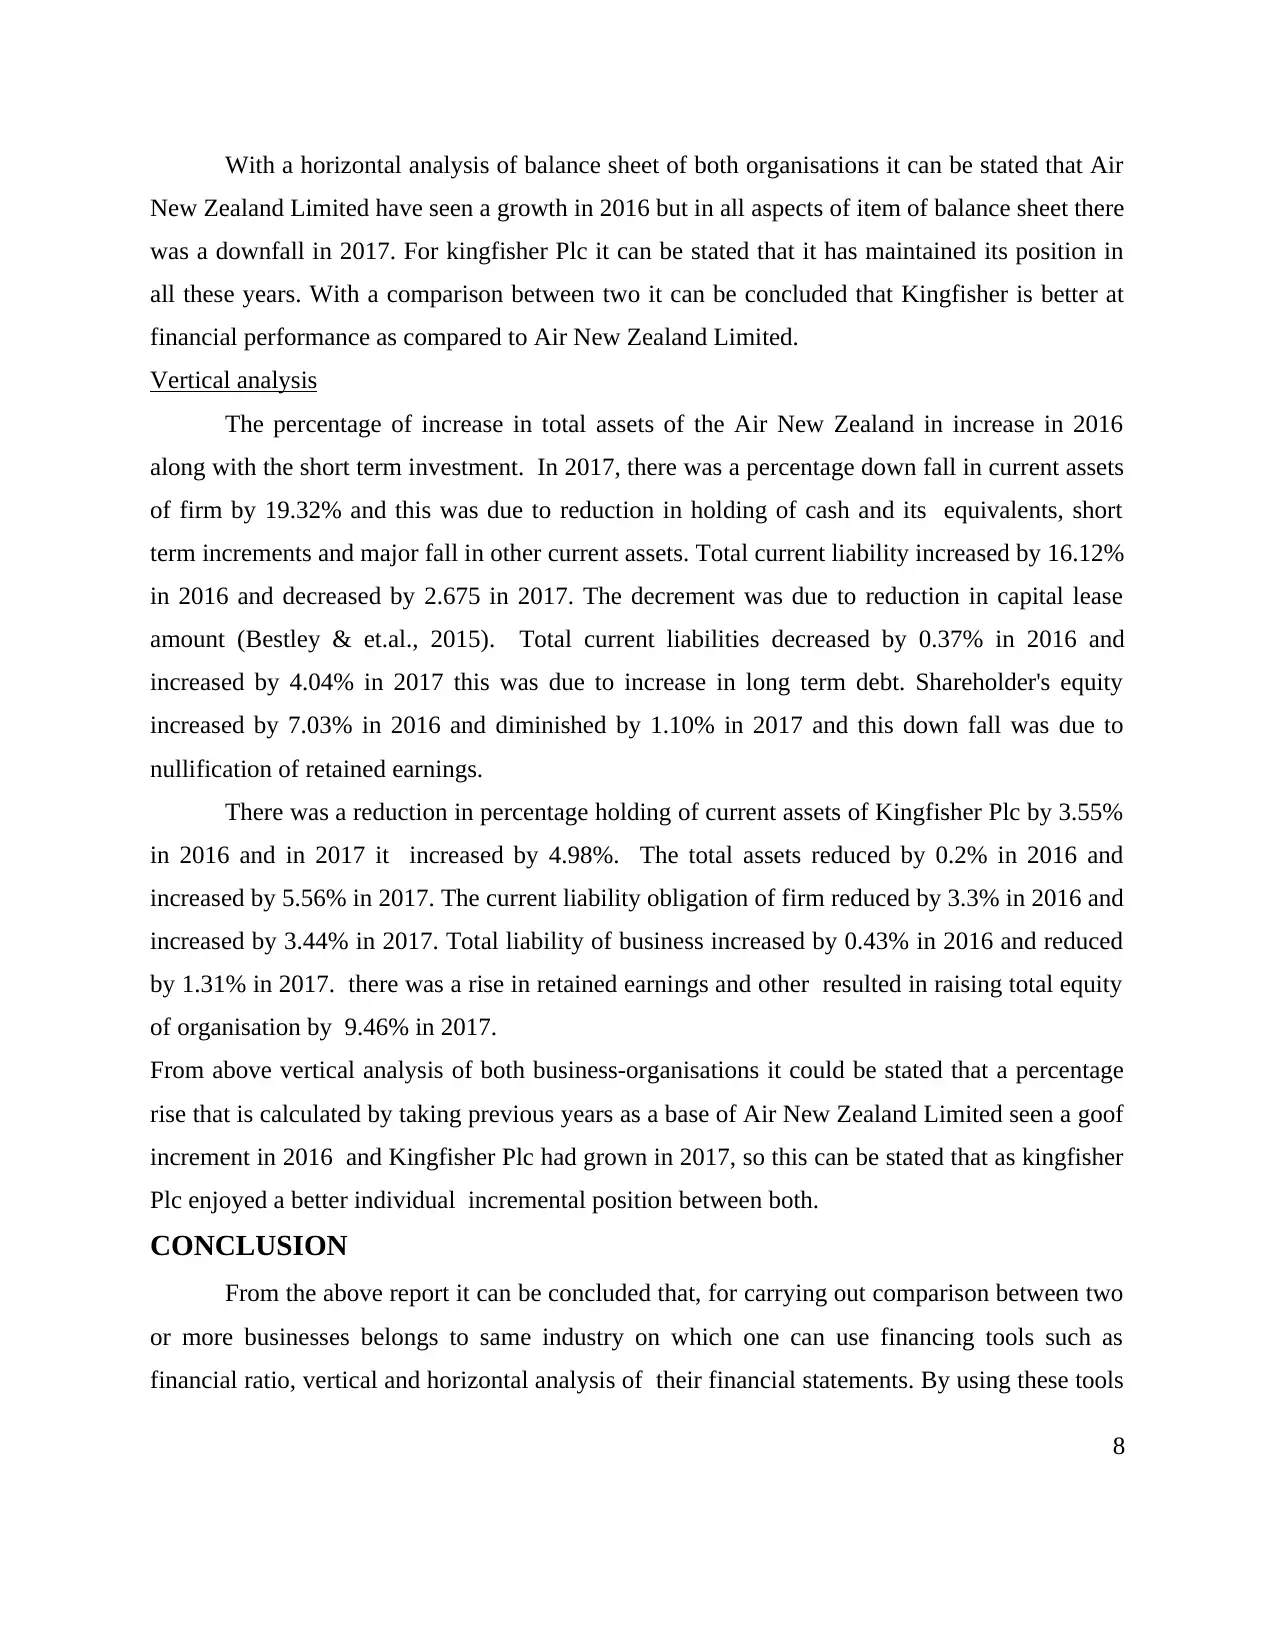
With a horizontal analysis of balance sheet of both organisations it can be stated that Air
New Zealand Limited have seen a growth in 2016 but in all aspects of item of balance sheet there
was a downfall in 2017. For kingfisher Plc it can be stated that it has maintained its position in
all these years. With a comparison between two it can be concluded that Kingfisher is better at
financial performance as compared to Air New Zealand Limited.
Vertical analysis
The percentage of increase in total assets of the Air New Zealand in increase in 2016
along with the short term investment. In 2017, there was a percentage down fall in current assets
of firm by 19.32% and this was due to reduction in holding of cash and its equivalents, short
term increments and major fall in other current assets. Total current liability increased by 16.12%
in 2016 and decreased by 2.675 in 2017. The decrement was due to reduction in capital lease
amount (Bestley & et.al., 2015). Total current liabilities decreased by 0.37% in 2016 and
increased by 4.04% in 2017 this was due to increase in long term debt. Shareholder's equity
increased by 7.03% in 2016 and diminished by 1.10% in 2017 and this down fall was due to
nullification of retained earnings.
There was a reduction in percentage holding of current assets of Kingfisher Plc by 3.55%
in 2016 and in 2017 it increased by 4.98%. The total assets reduced by 0.2% in 2016 and
increased by 5.56% in 2017. The current liability obligation of firm reduced by 3.3% in 2016 and
increased by 3.44% in 2017. Total liability of business increased by 0.43% in 2016 and reduced
by 1.31% in 2017. there was a rise in retained earnings and other resulted in raising total equity
of organisation by 9.46% in 2017.
From above vertical analysis of both business-organisations it could be stated that a percentage
rise that is calculated by taking previous years as a base of Air New Zealand Limited seen a goof
increment in 2016 and Kingfisher Plc had grown in 2017, so this can be stated that as kingfisher
Plc enjoyed a better individual incremental position between both.
CONCLUSION
From the above report it can be concluded that, for carrying out comparison between two
or more businesses belongs to same industry on which one can use financing tools such as
financial ratio, vertical and horizontal analysis of their financial statements. By using these tools
8
a comparison of financial performance of Kingfisher Plc and Air New Zealand Limited is done
and it is analysed that both firms later enjoyed a good profitable position but former one is
goofed in liquidity and efficiency that gives regular returns to its shareholders. Evaluation of
financial statements reveals that kingfisher have kept a good record in its financial performance
as compared to Air New Zealand Limited. It grew in 2016 but in 2017 it has seen a slight
downfall.
9
⊘ This is a preview!⊘
Do you want full access?
Subscribe today to unlock all pages.
Trusted by 1+ million students worldwide
1 out of 20
Related Documents


Your All-in-One AI-Powered Toolkit for Academic Success.
+13062052269
info@desklib.com
Available 24*7 on WhatsApp / Email
![[object Object]](/_next/static/media/star-bottom.7253800d.svg)
Unlock your academic potential
Copyright © 2020–2025 A2Z Services. All Rights Reserved. Developed and managed by ZUCOL.