Statistics Assignment: Data Analysis using SPSS Software
VerifiedAdded on 2020/02/05
|17
|1865
|63
Homework Assignment
AI Summary
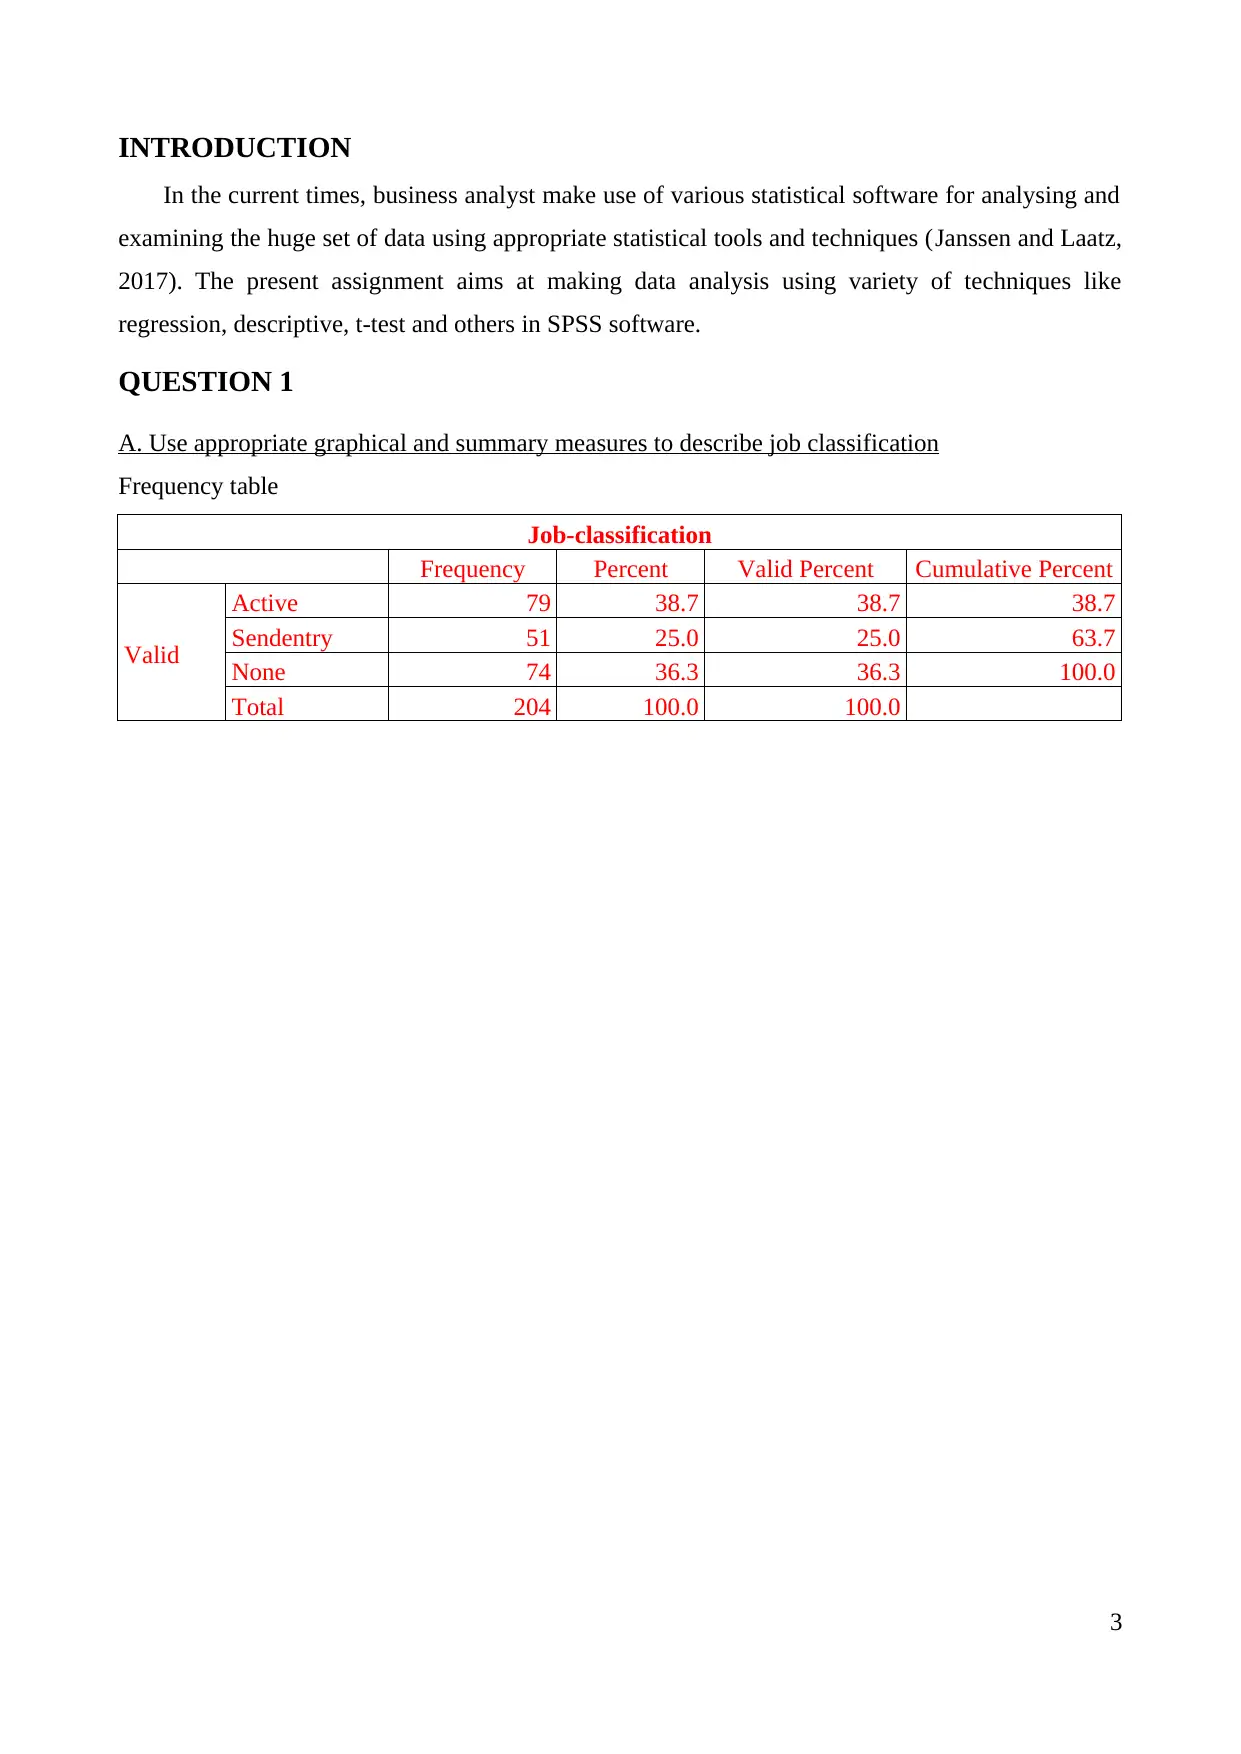
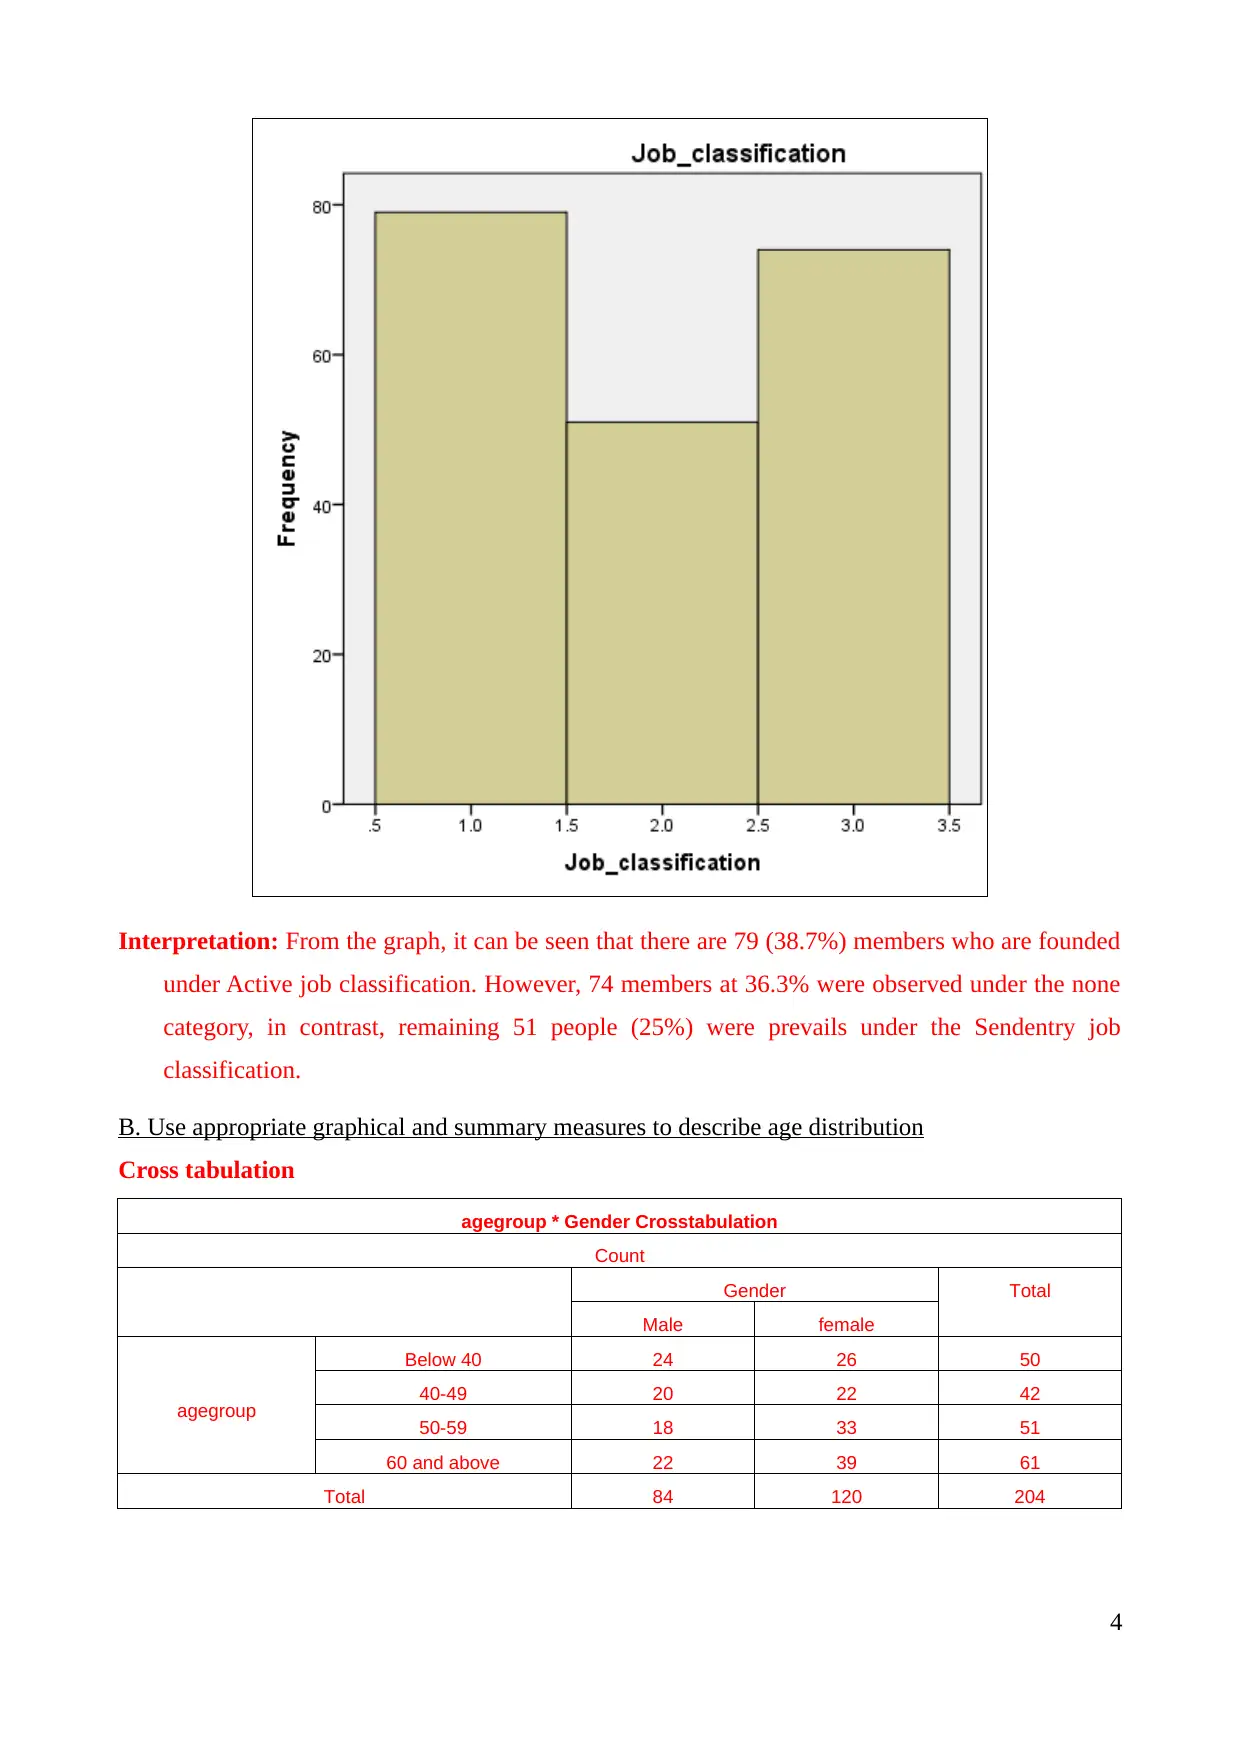
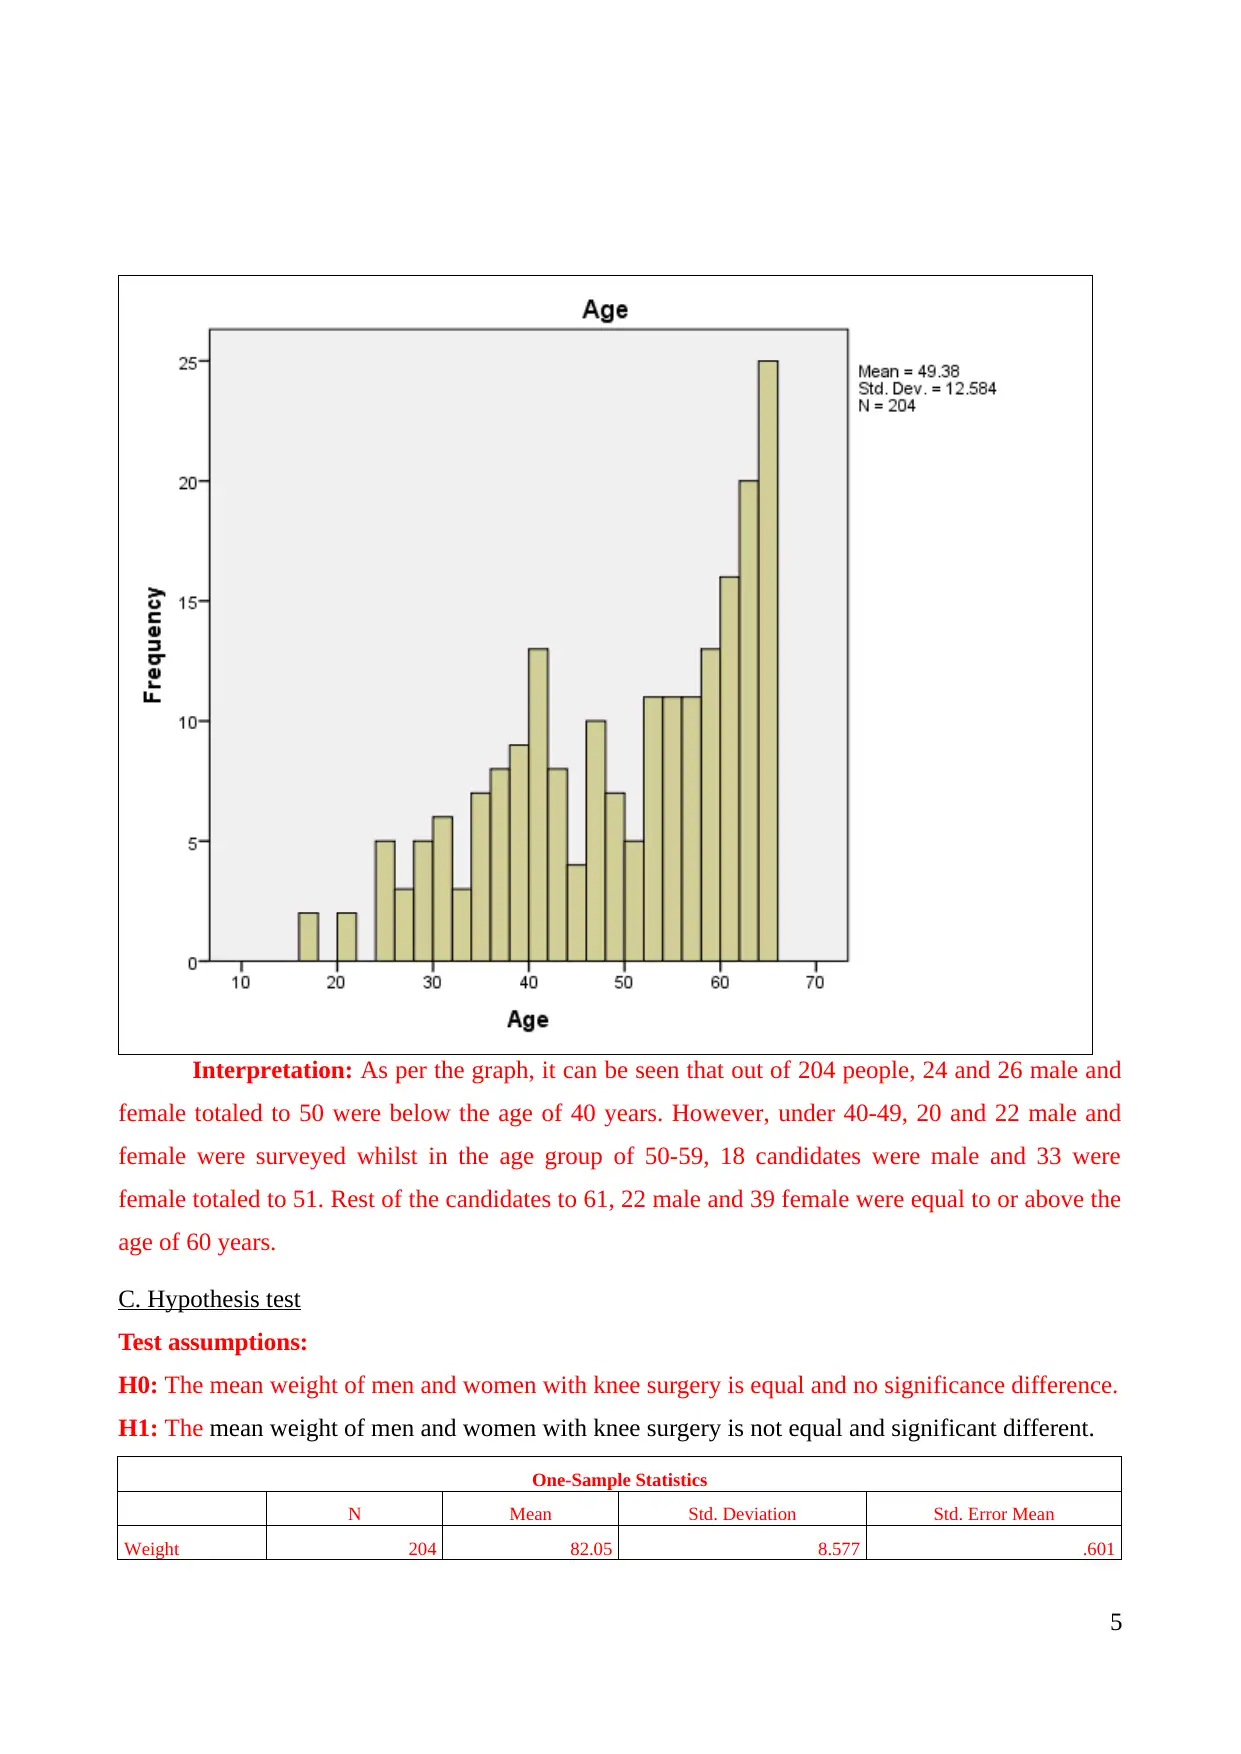
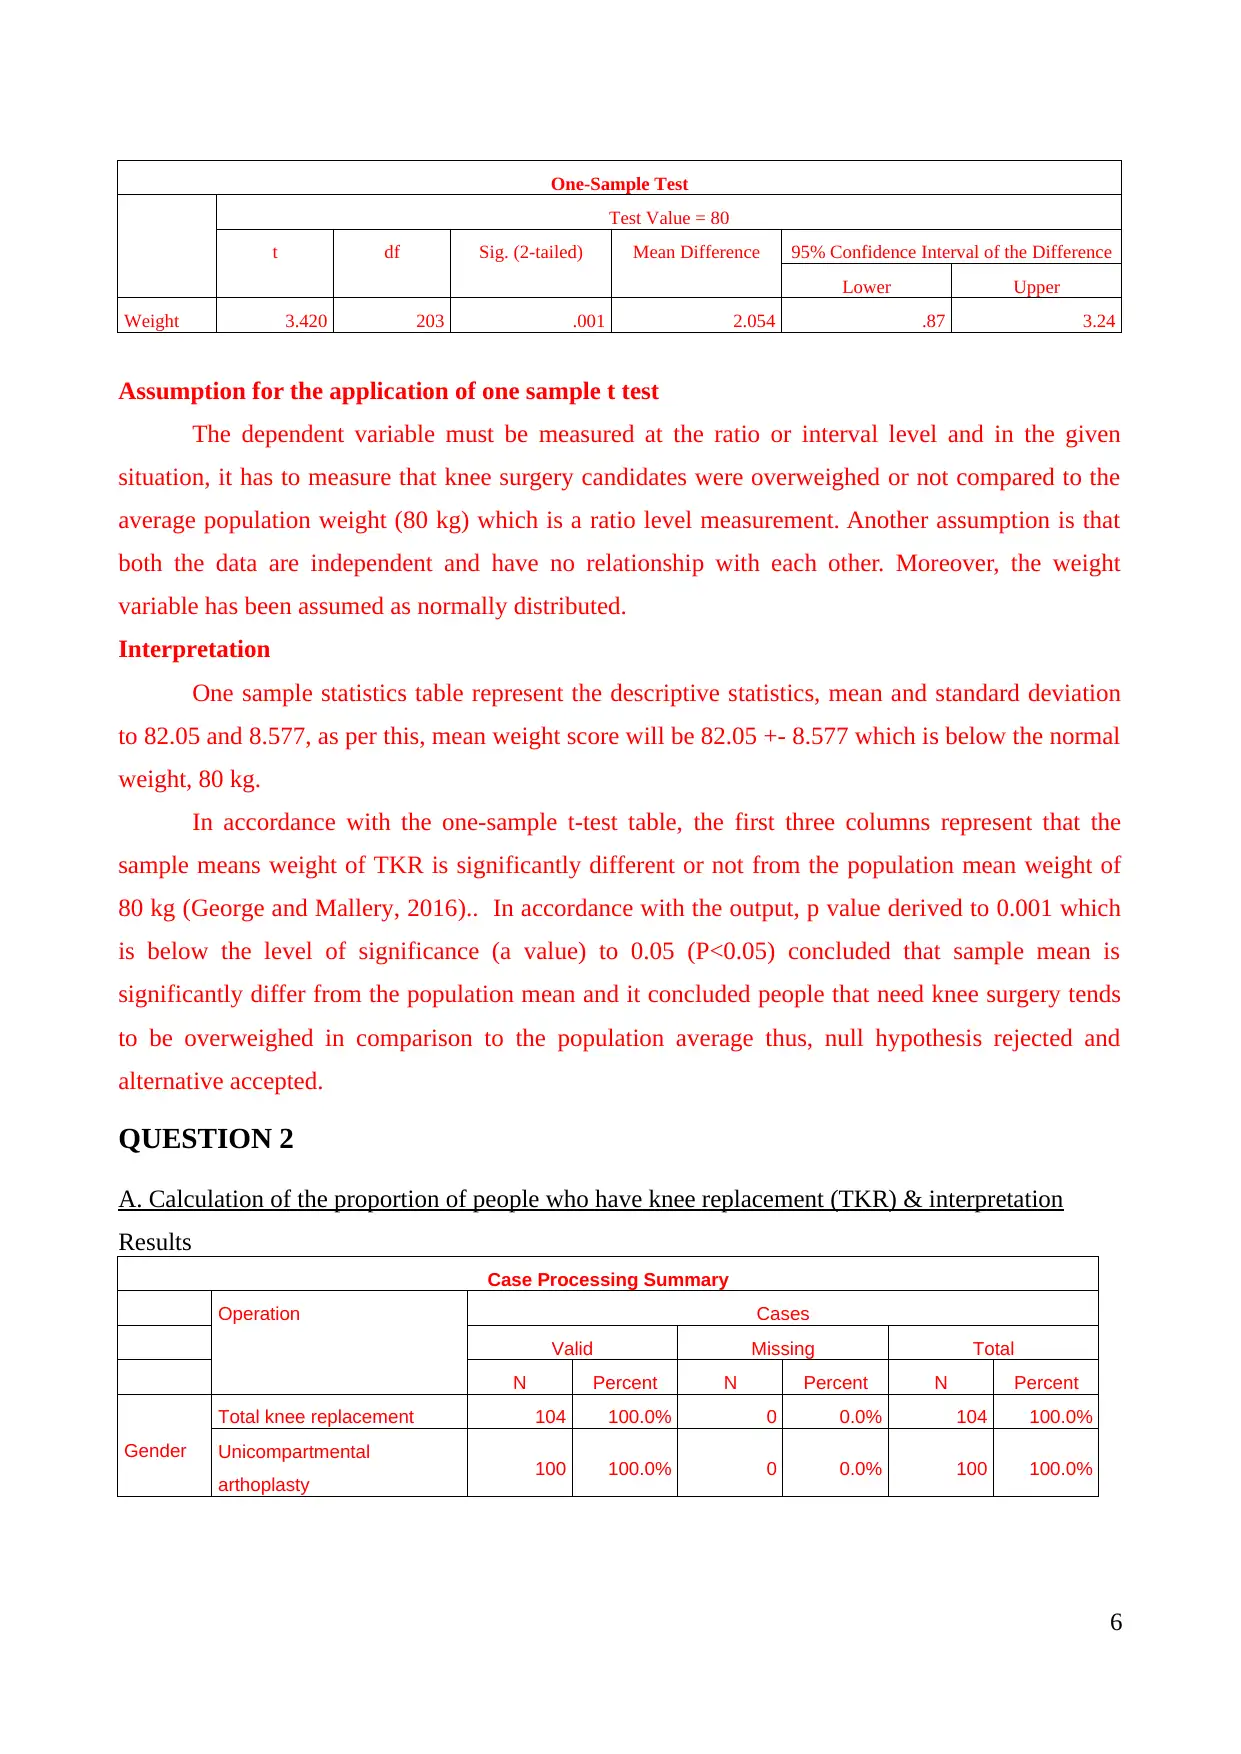
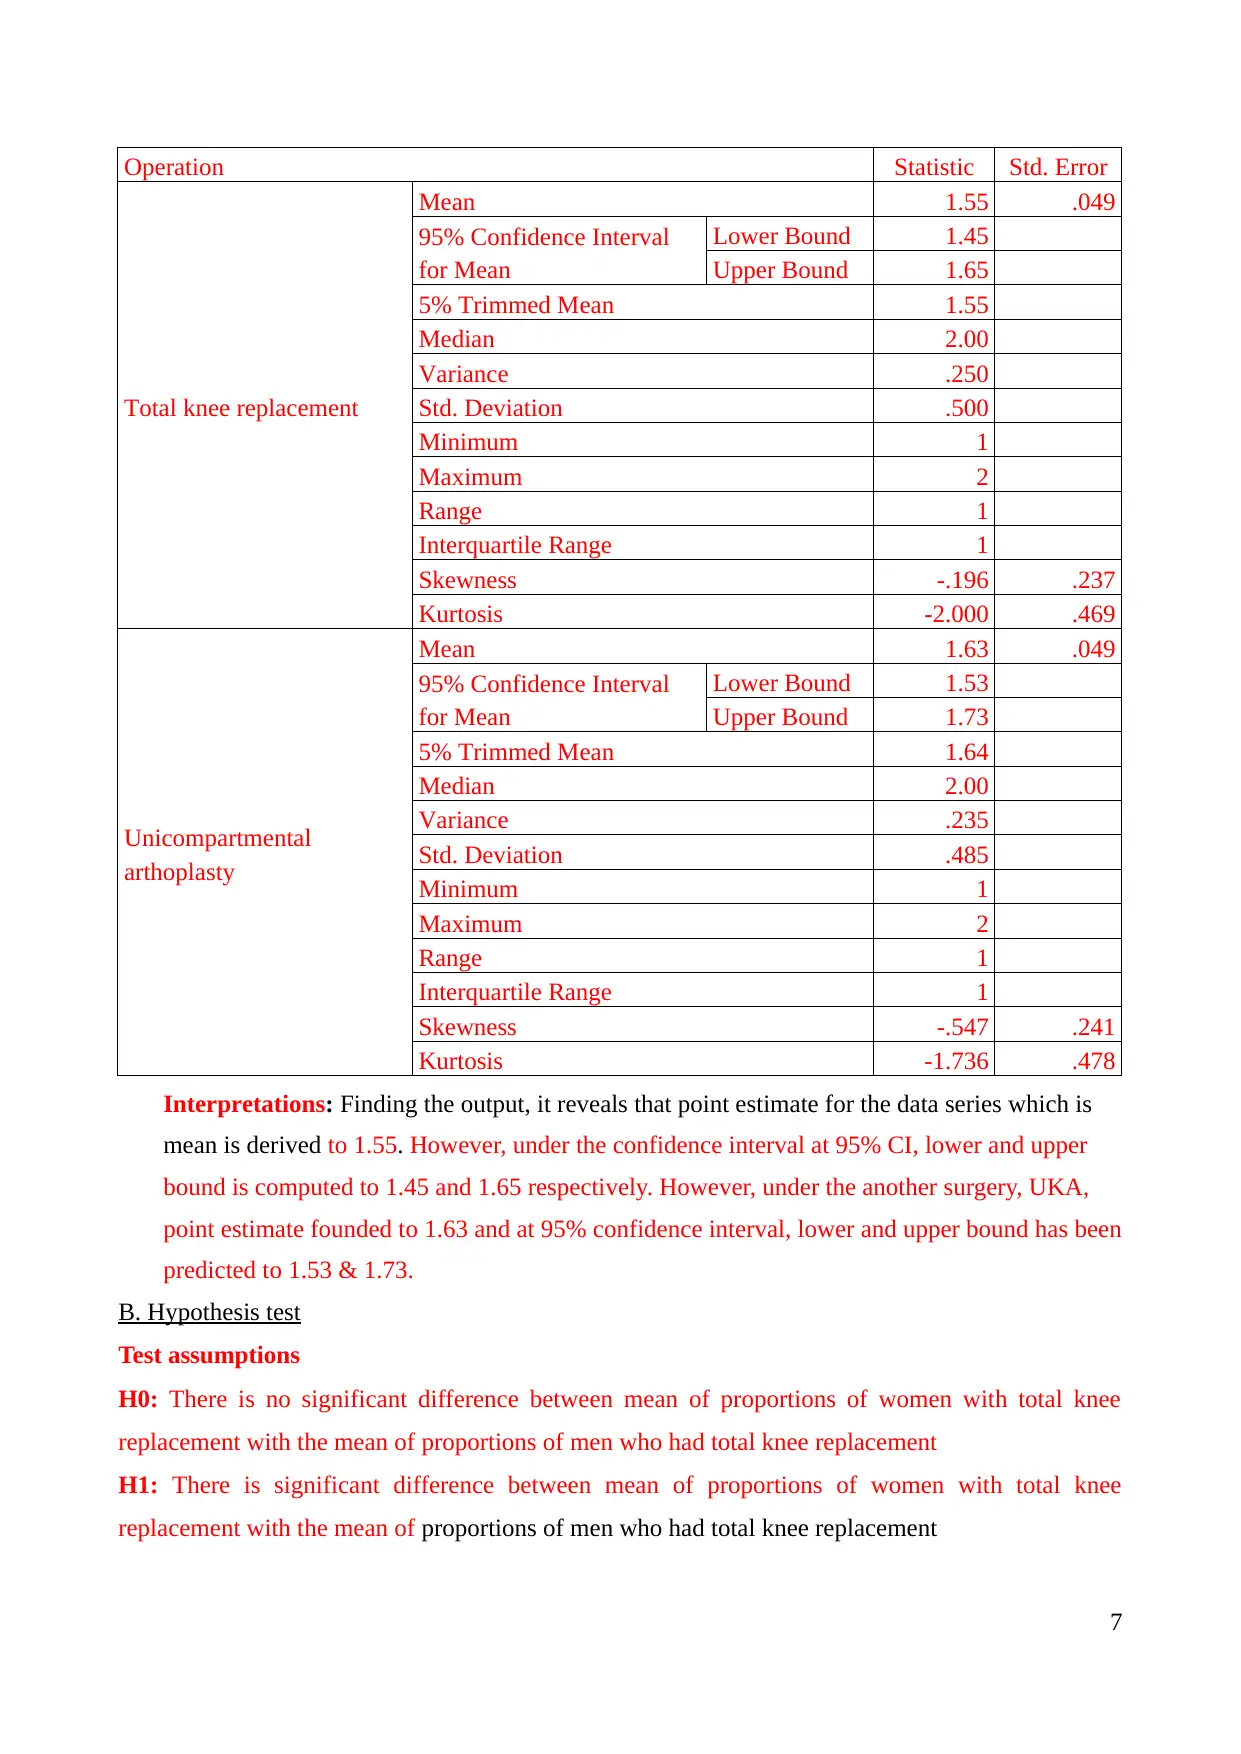
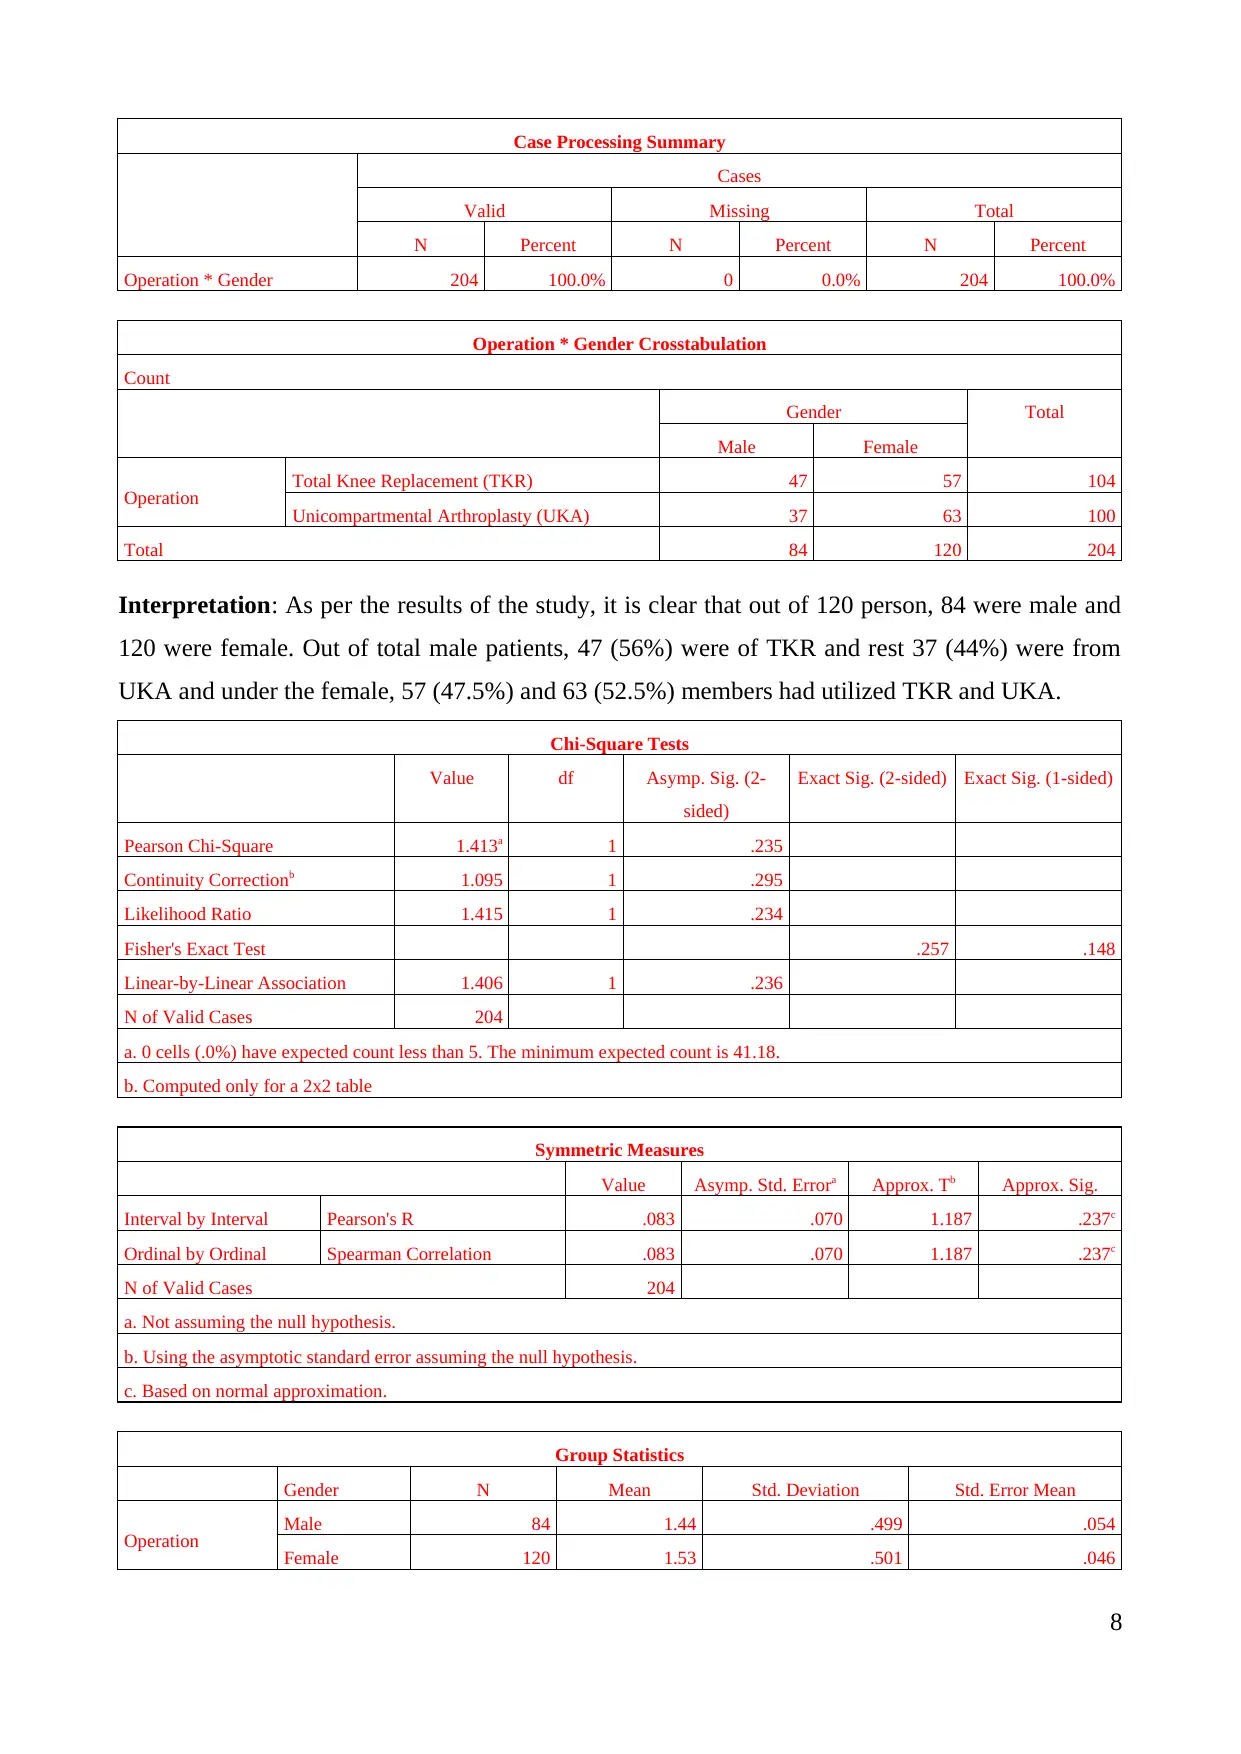
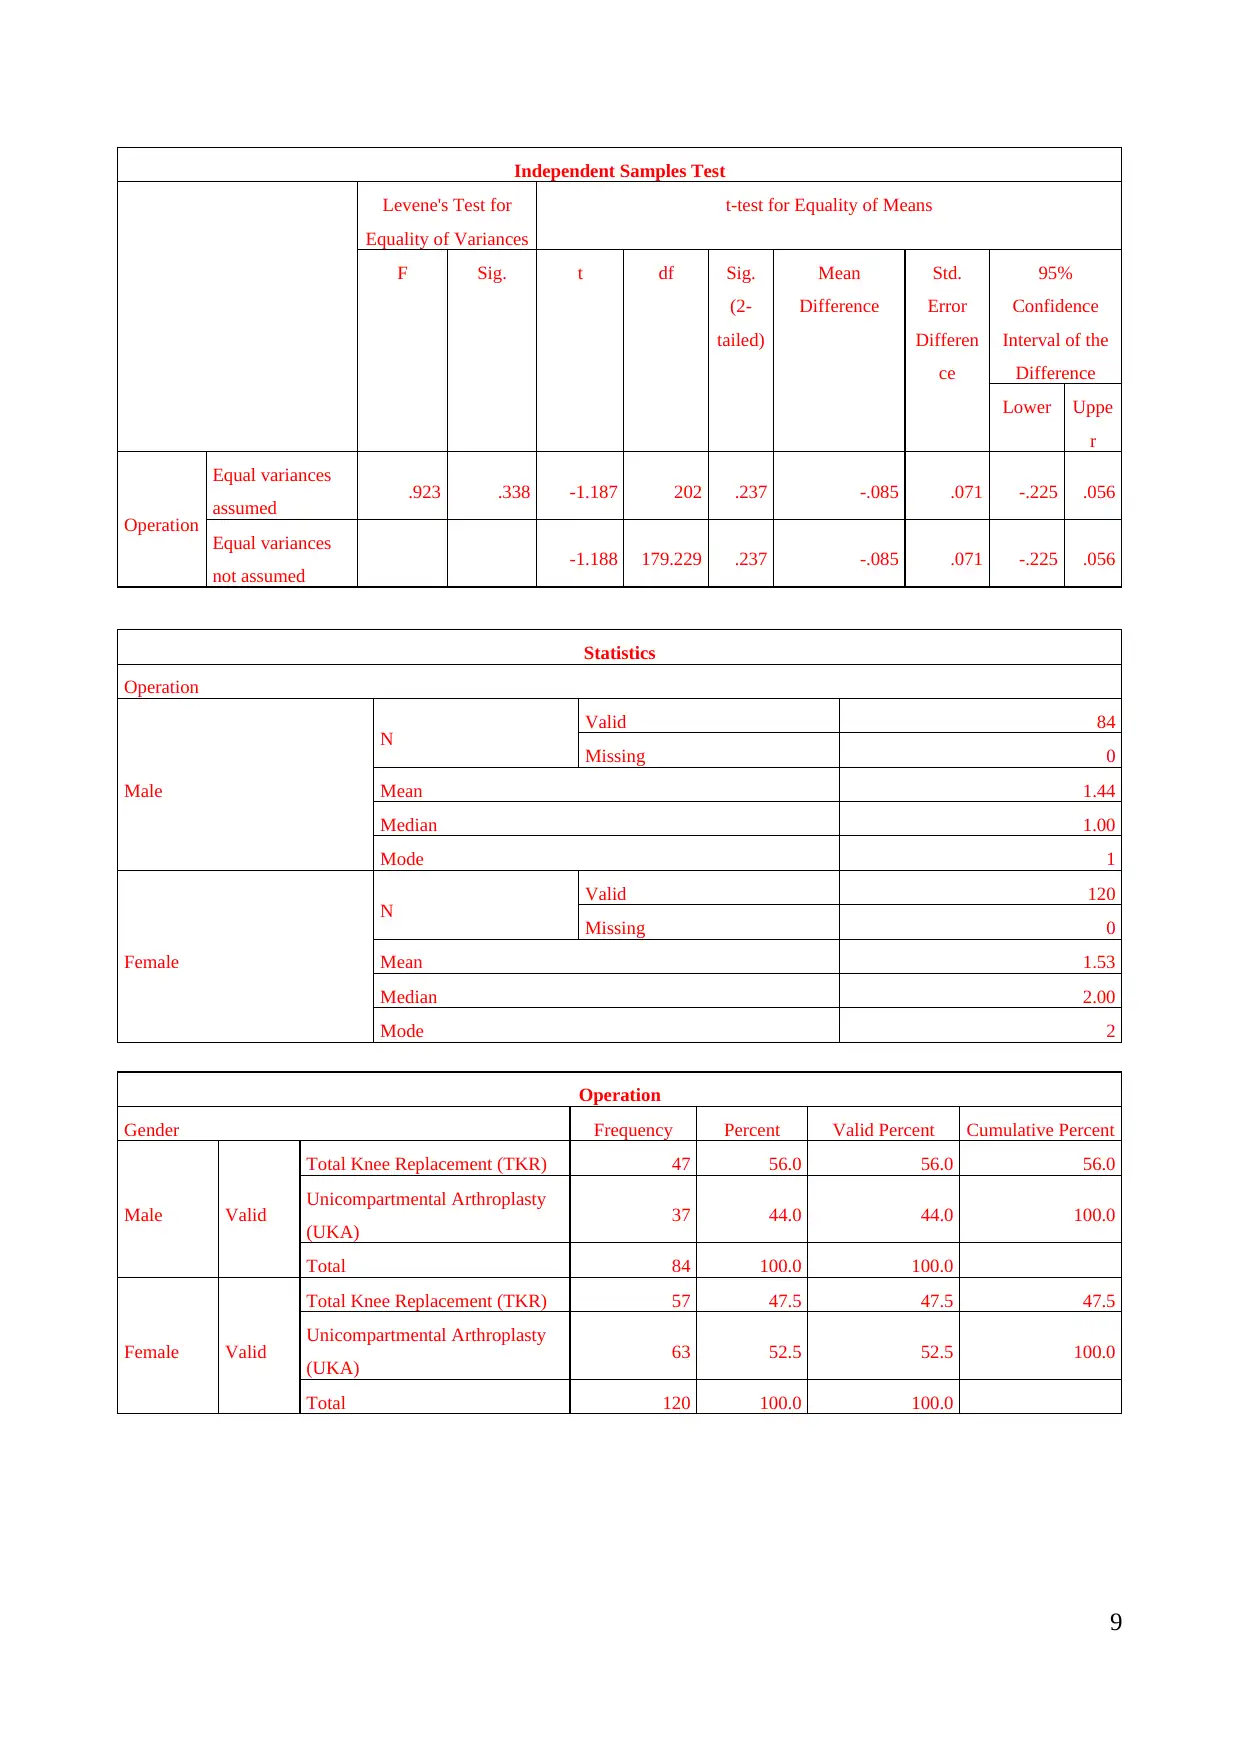
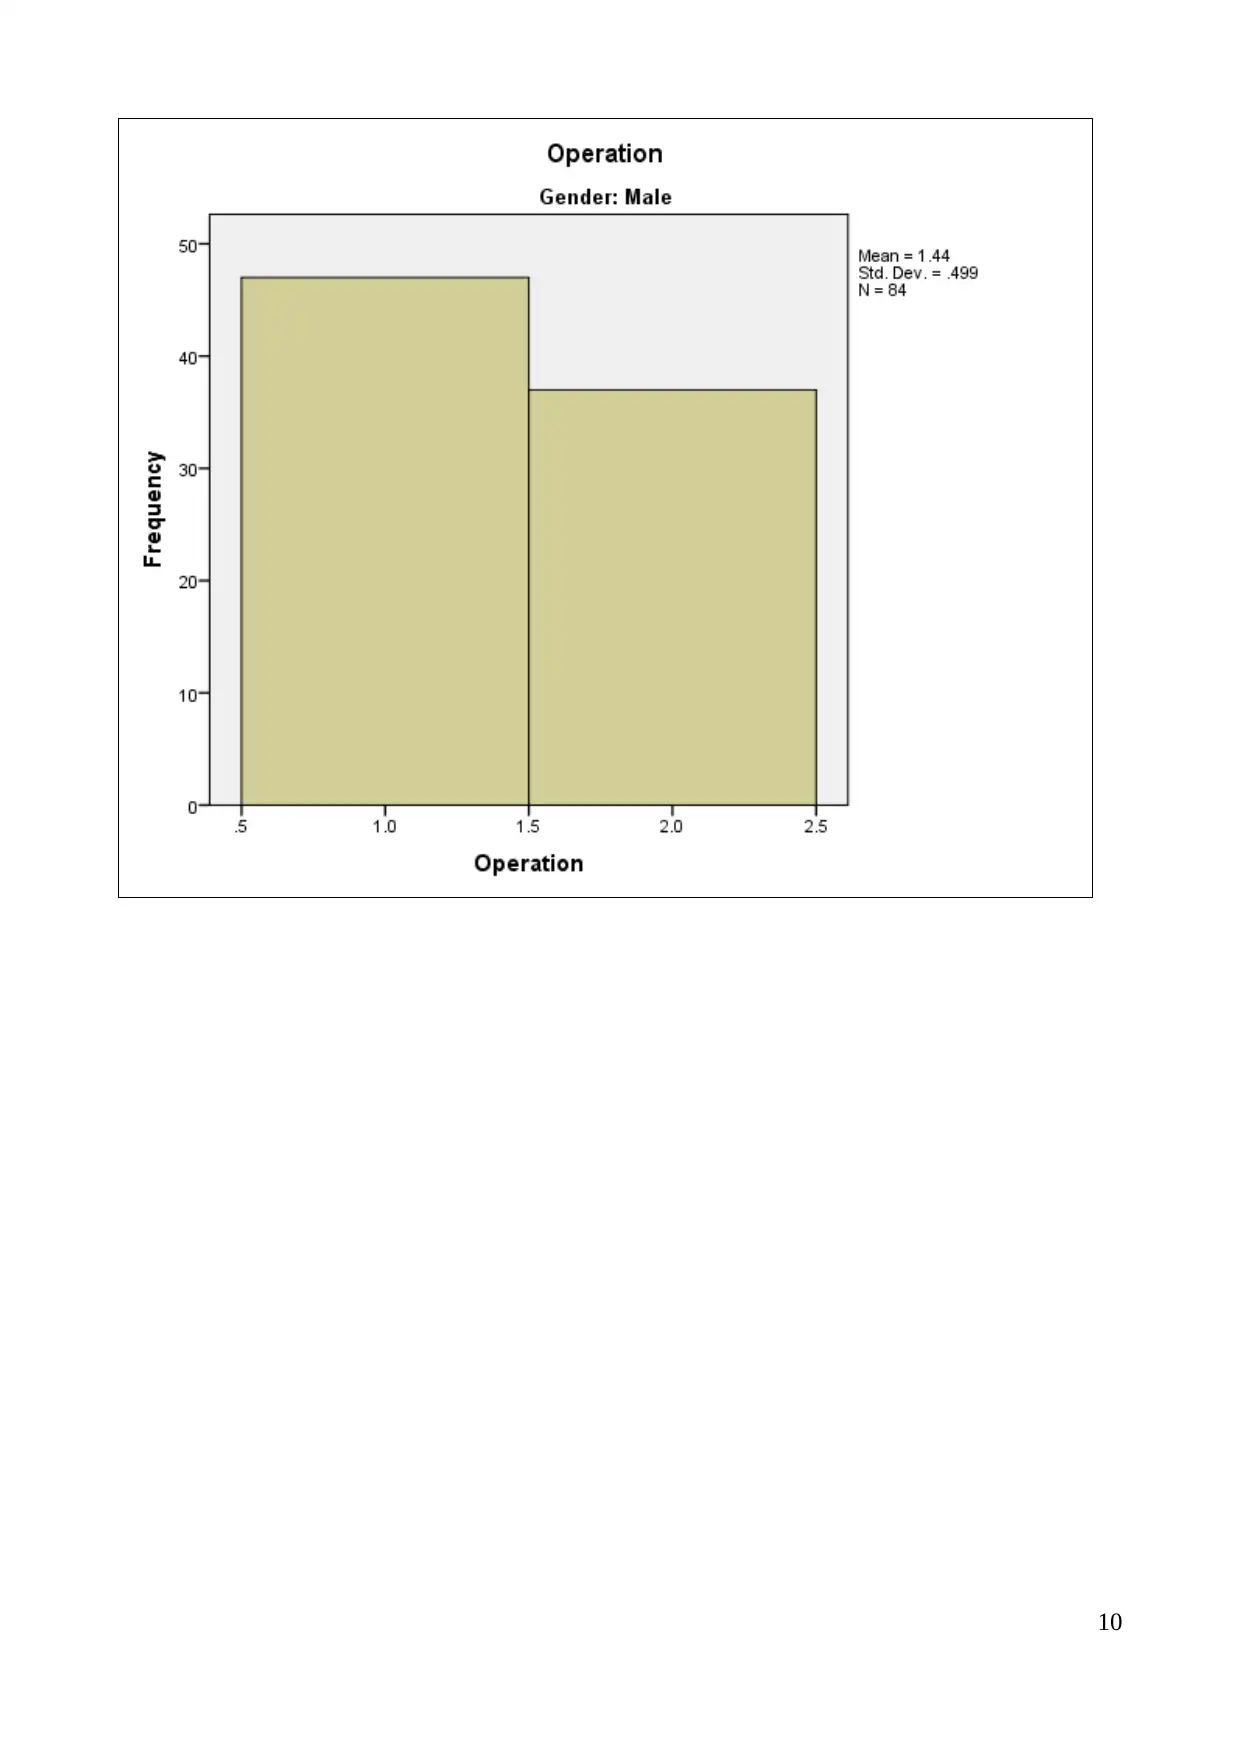
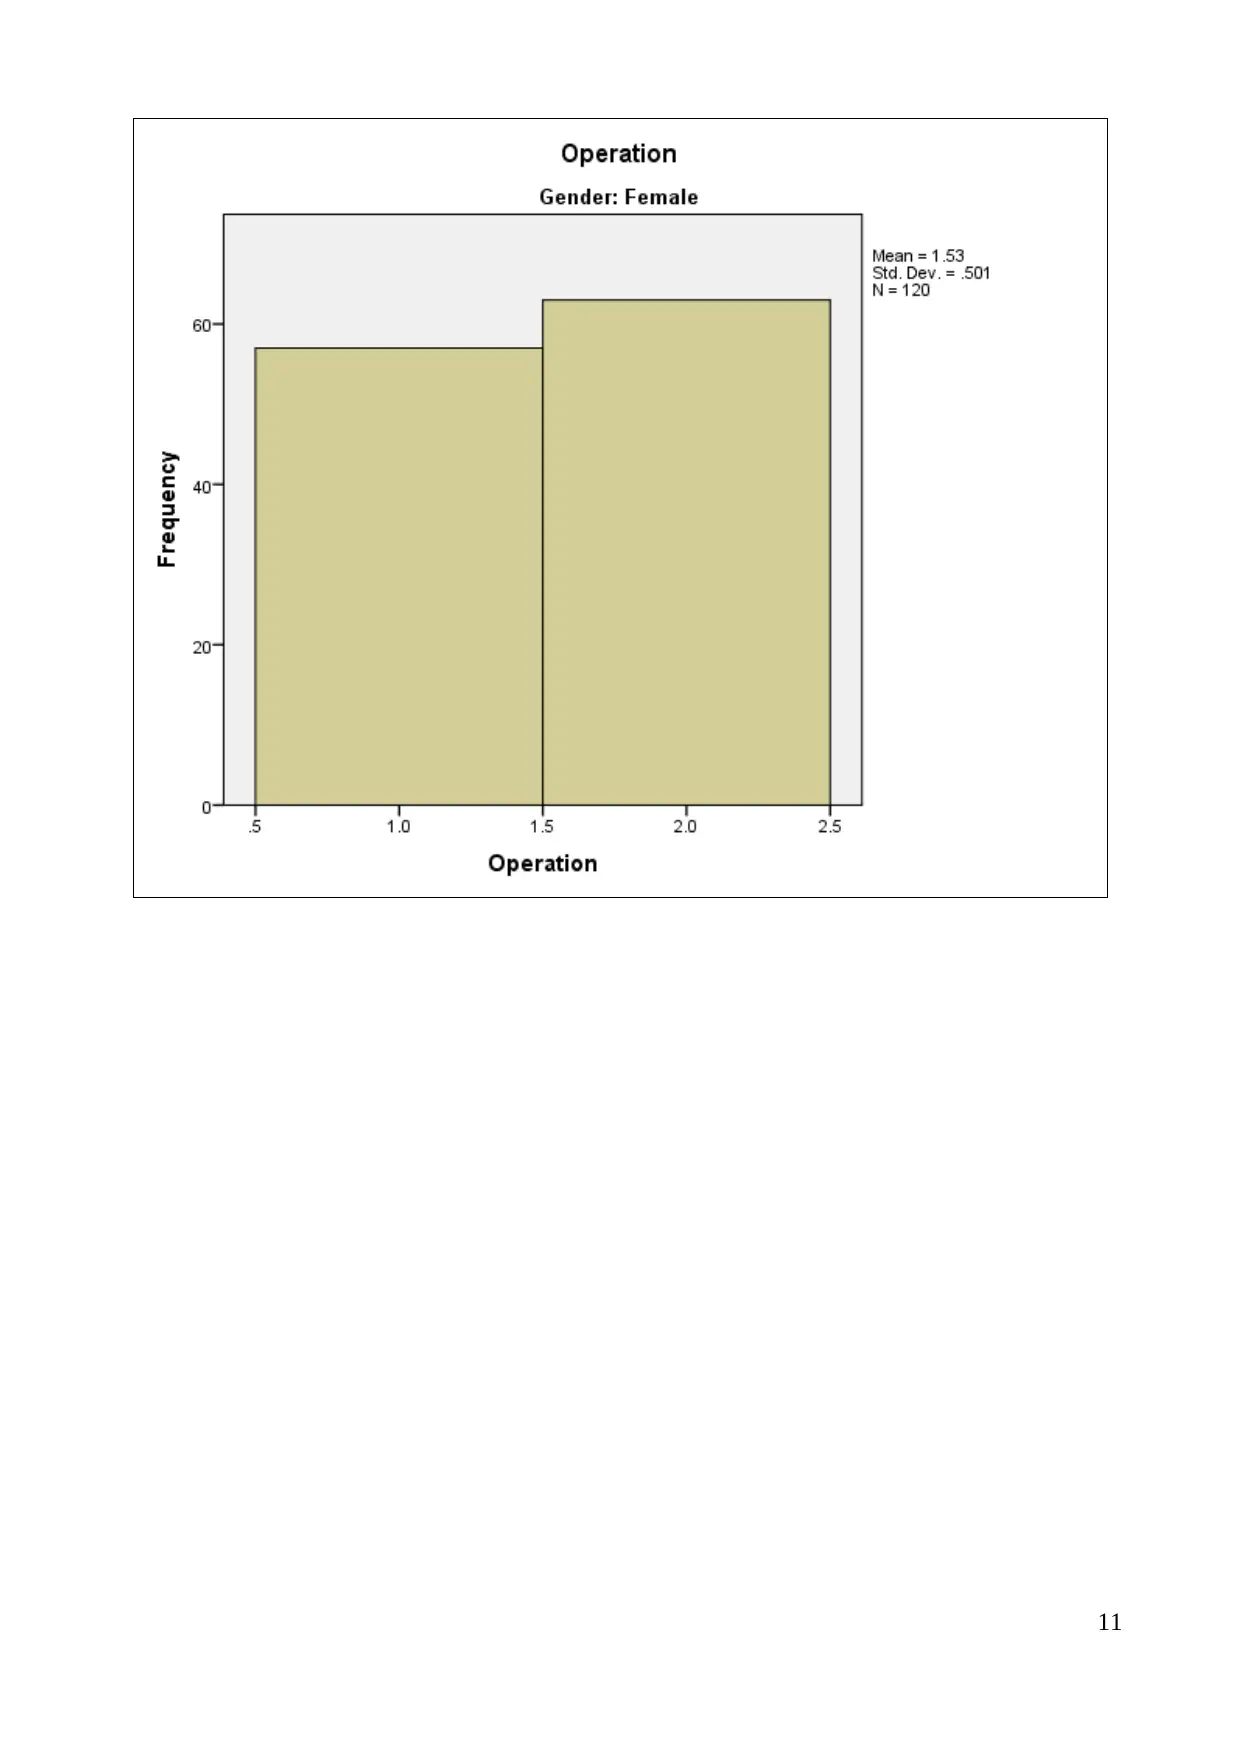
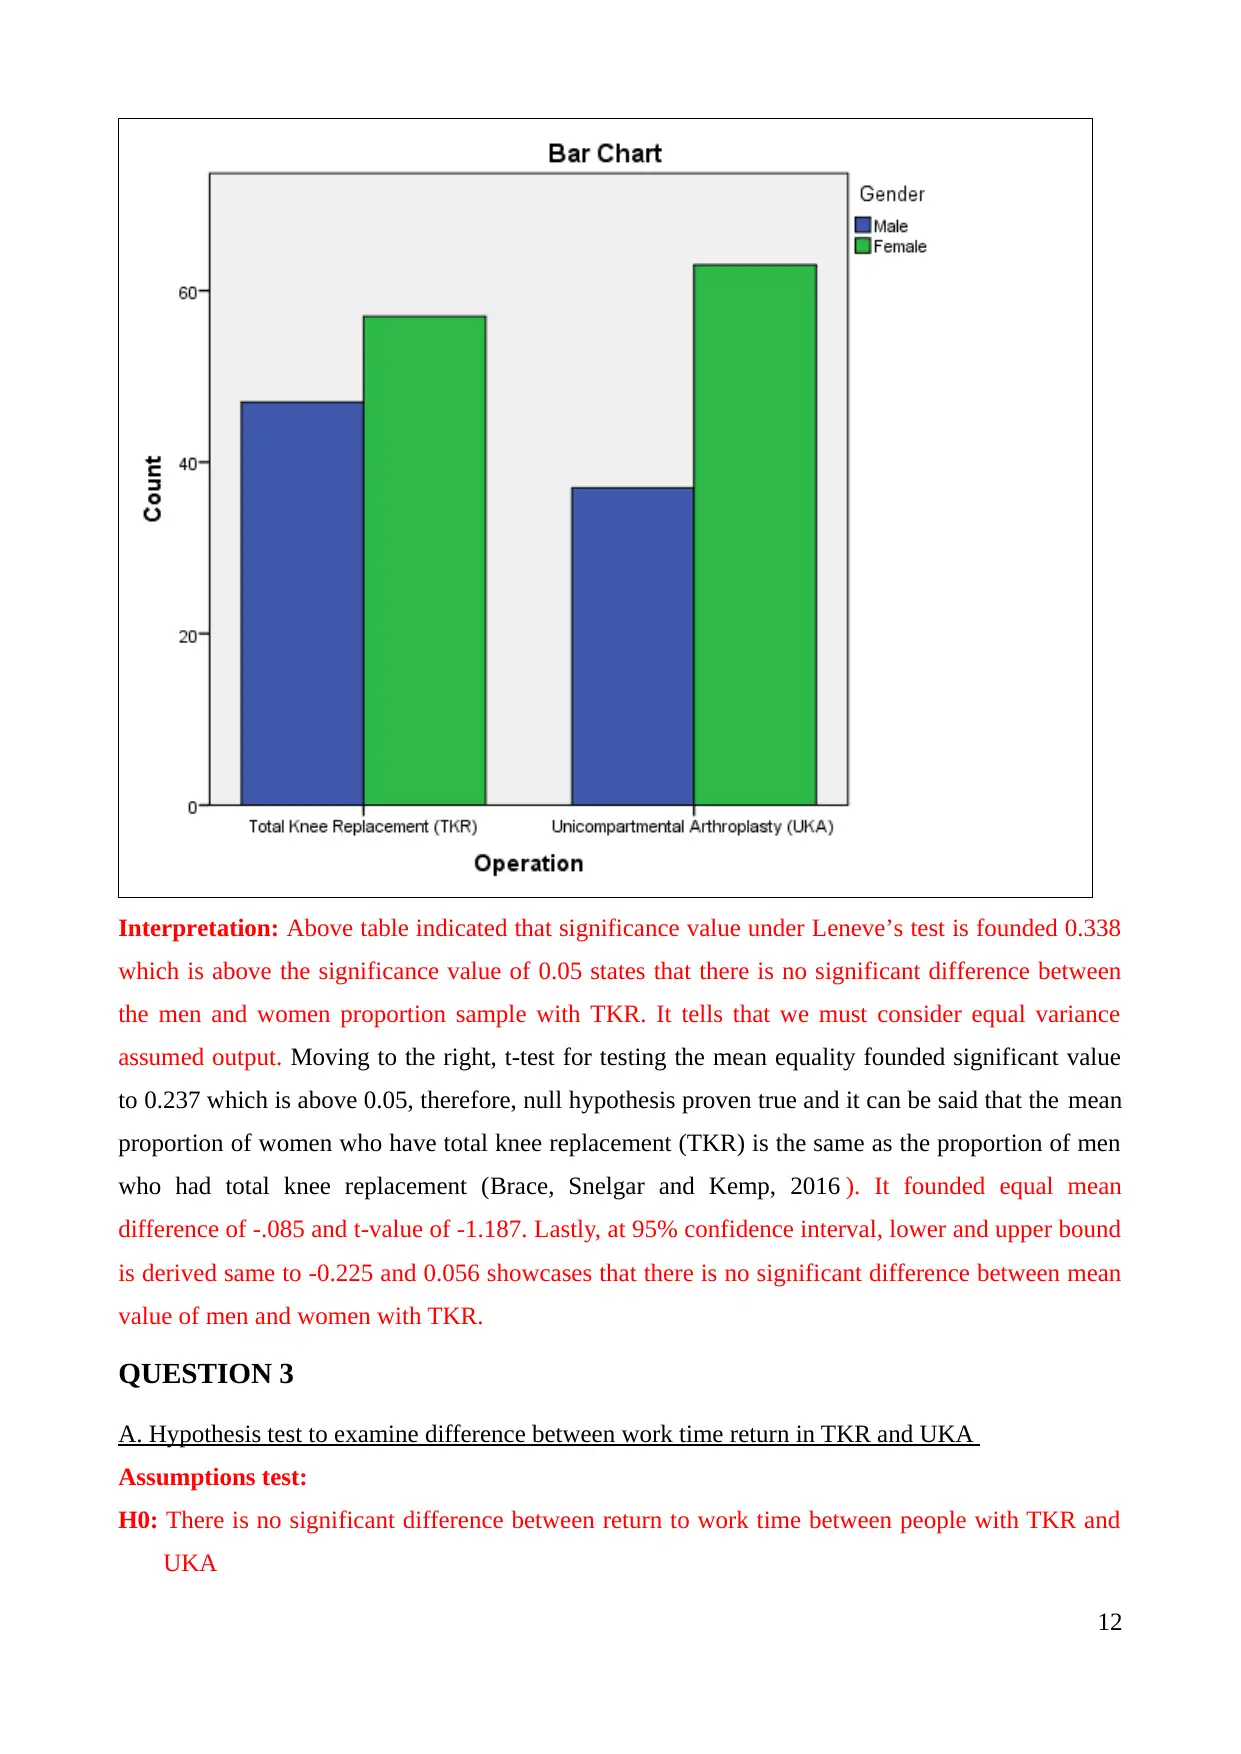
This statistics assignment utilizes SPSS software to analyze a dataset, covering descriptive statistics, graphical representations, and hypothesis testing. The assignment explores job classifications and age distributions, employing frequency tables and graphical interpretations. It delves into hypothesis tests comparing the mean weight of men and women with knee surgery. Further analysis includes tests on the proportion of people with knee replacements and comparisons of return-to-work times and mean weight differences between TKR and UKA patients. The solution also addresses the sample size required for 90% power and concludes with a short report summarizing the findings. The analysis involves t-tests, chi-square tests, and interpretations of confidence intervals and p-values. The assignment demonstrates the application of statistical tools and techniques in data analysis, providing insights into the analysis of medical and demographic data.
1 out of 17
Related Documents


Your All-in-One AI-Powered Toolkit for Academic Success.
+13062052269
info@desklib.com
Available 24*7 on WhatsApp / Email
![[object Object]](/_next/static/media/star-bottom.7253800d.svg)
Copyright © 2020–2026 A2Z Services. All Rights Reserved. Developed and managed by ZUCOL.