Analysis of Dataset in Biostatistics
Added on 2023-01-19
23 Pages4406 Words97 Views
End of preview
Want to access all the pages? Upload your documents or become a member.
Analysis of Dataset in Biostatistics
|37
|7095
|30
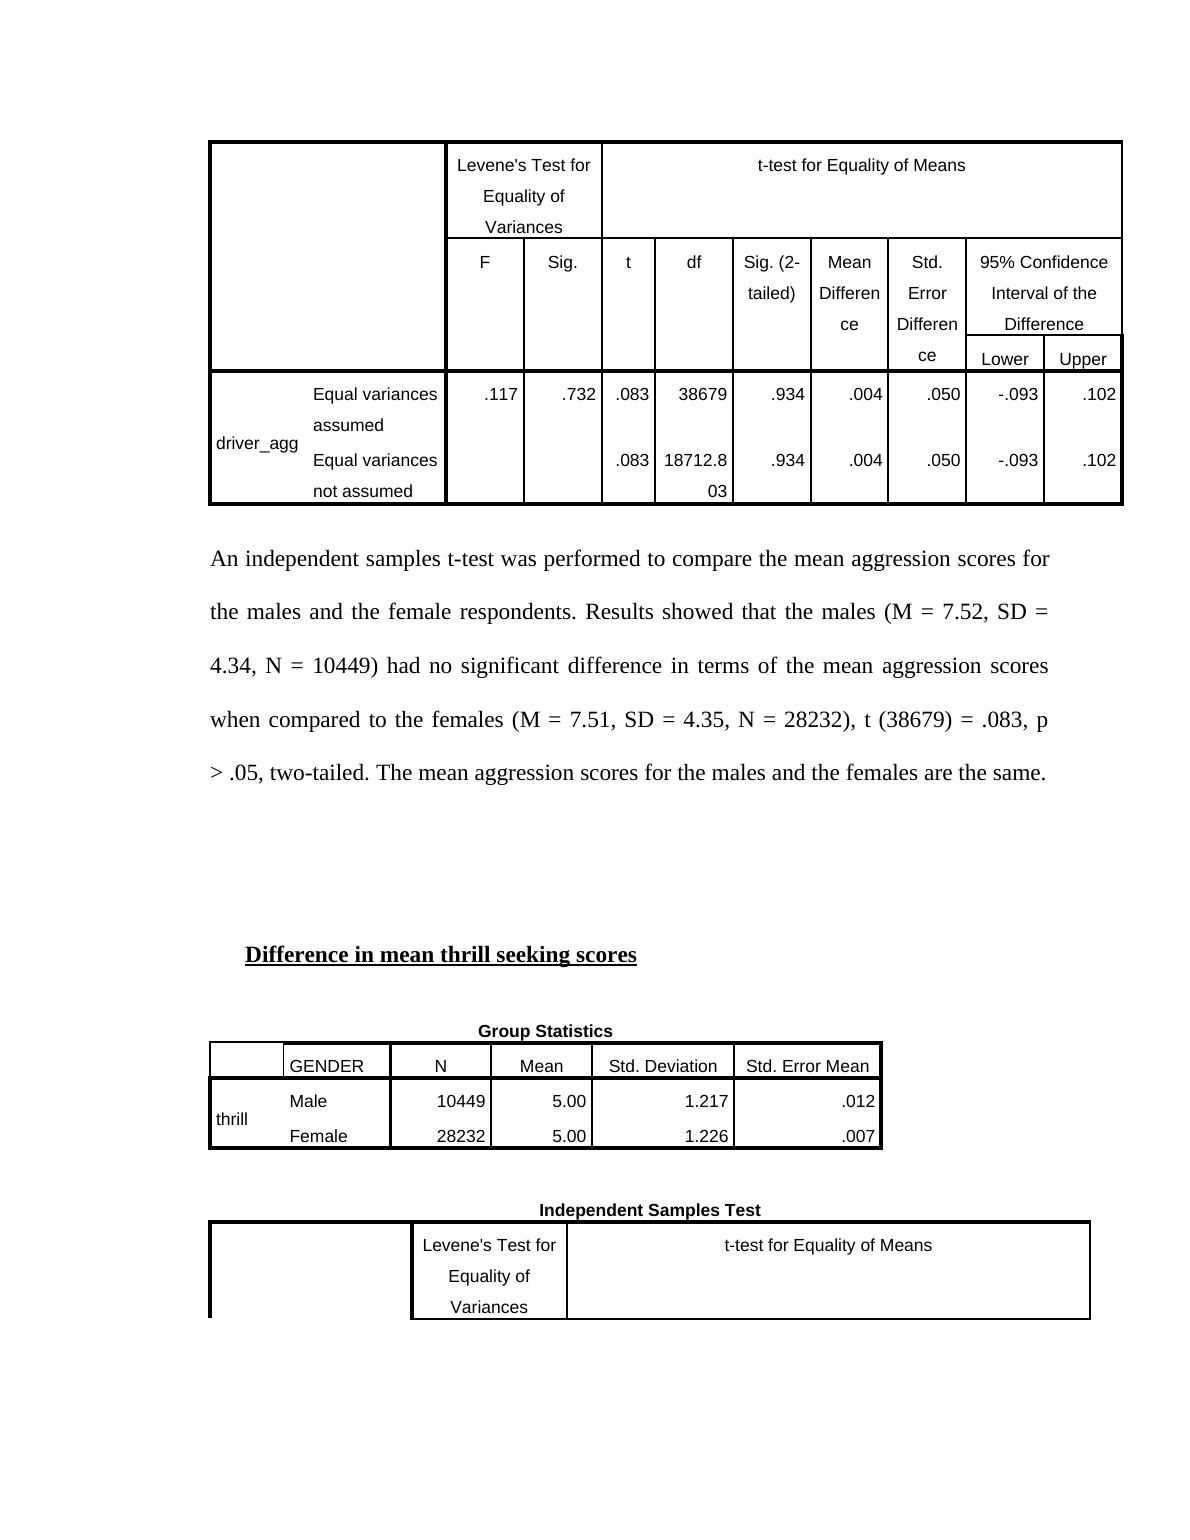
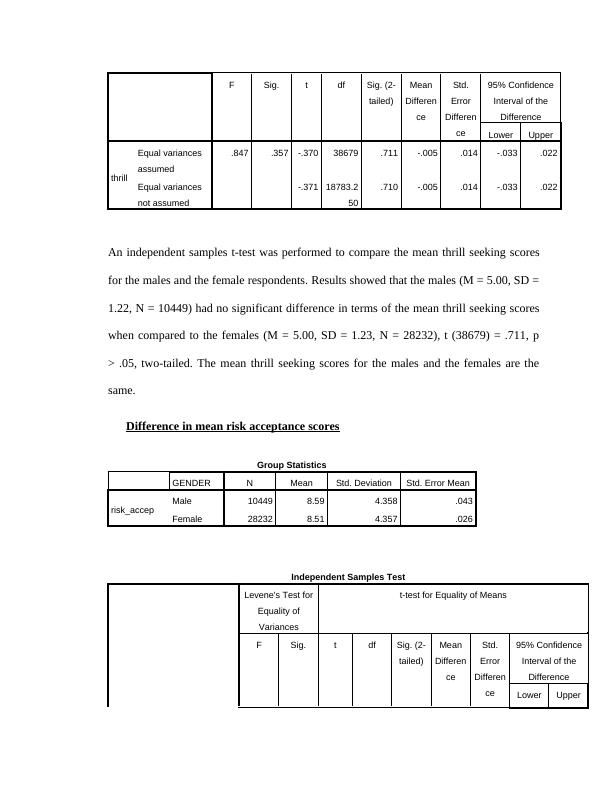
Difference in Mean Aggression, Thrill Seeking, and Risk Accepting between Genders, Metropolitan Backgrounds, and Study Modes
|16
|2947
|51
Difference in Mean Aggression, Thrill Seeking, and Risk Accepting between Genders, Metropolitan Backgrounds, and Study Modes
|15
|2774
|55
Data Analysis: Descriptive Statistics and Tests for Mean Differences
|15
|2791
|155
Difference in Mean Aggression, Thrill Seeking, and Risk Accepting between Genders, Metropolitan Backgrounds, and Study Modes
|16
|2232
|87
Test for Difference in Mean Aggression, Thrill Seeking, and Risk Accepting
|19
|3679
|60