Statistical Analysis of Management Pays
Added on 2020-06-06
18 Pages3592 Words347 Views
Statistics for Management
TABLE OF CONTENTS
INTRODUCTION ..........................................................................................................................4
TASK 1............................................................................................................................................4
A. Determining whether significant difference takes place in the earnings of men and women
in public sector .....................................................................................................................4
B. Assessing the extent to which significant difference takes place in the earnings of men and
women in private sector ........................................................................................................5
C. Presenting earnings – time chart using excel ....................................................................6
D. Determining annual growth rates in earnings ...................................................................6
TASK 2............................................................................................................................................7
SECTION A.....................................................................................................................................7
1. Presenting data in a comprehensive format .......................................................................7
2. (i) and (ii) Evaluating data set by calculating mean and using measures of dispersion ....7
1. Computation of mean.........................................................................................................7
2. Computation of variance and standard deviation ..............................................................8
2.3 Preparing report by taking into account outcome determined above...............................9
SECTION B ..................................................................................................................................10
2.4 Producing a scatter diagram and line of best fit to describe relationship which takes place
between age & weight of babies ..........................................................................................10
TASK 3 .........................................................................................................................................11
A. Analyzing the number of deliveries made in each day of the current year.....................11
b. Analyzing the number of bottles to be delivered by the suppliers...................................12
c. Computation of economic order quantity.........................................................................12
d............................................................................................................................................13
TASK 4..........................................................................................................................................14
4.1 Presenting the number of bedrooms in the number of houses in each street with the help of
pictorial presentation............................................................................................................14
4.2 Determining the relationship between the prices of houses as per number of bedrooms15
CONCLUSION..............................................................................................................................16
REFERENCES..............................................................................................................................18
INTRODUCTION
In the recent times, business units tend to make more focus on undertaking statistical
tools and techniques for managing operations more effectually. Tools and techniques of statistics
are highly significant which in turn assists in both summarizing as well as evaluating data set in a
structured way. The present report is based on varied case scenarios which will provide deeper
insight about hypothesis testing. Further, report will shed light on the manner in which graphical
presentation facilitates better understanding pertaining to data set.
TASK 1
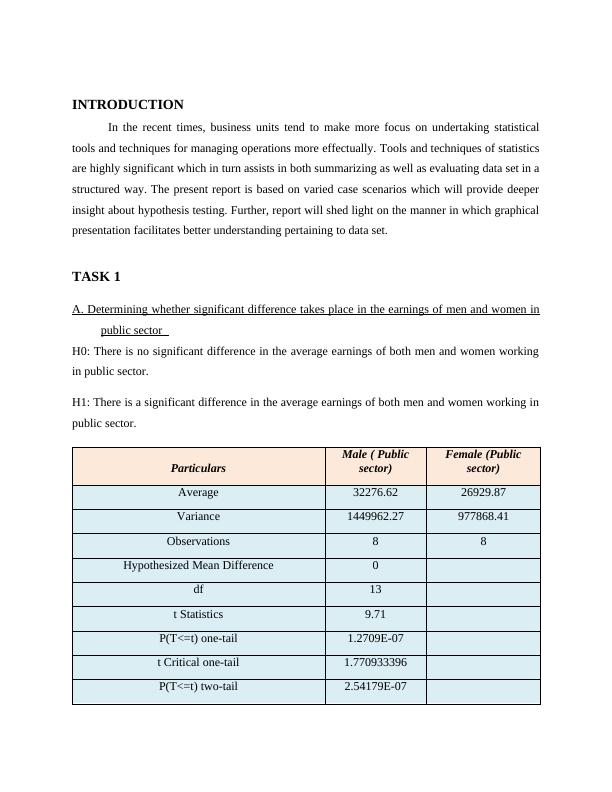
A. Determining whether significant difference takes place in the earnings of men and women in
public sector
H0: There is no significant difference in the average earnings of both men and women working
in public sector.
H1: There is a significant difference in the average earnings of both men and women working in
public sector.
Particulars
Male ( Public
sector)
Female (Public
sector)
Average 32276.62 26929.87
Variance 1449962.27 977868.41
Observations 8 8
Hypothesized Mean Difference 0
df 13
t Statistics 9.71
P(T<=t) one-tail 1.2709E-07
t Critical one-tail 1.770933396
P(T<=t) two-tail 2.54179E-07
In the recent times, business units tend to make more focus on undertaking statistical
tools and techniques for managing operations more effectually. Tools and techniques of statistics
are highly significant which in turn assists in both summarizing as well as evaluating data set in a
structured way. The present report is based on varied case scenarios which will provide deeper
insight about hypothesis testing. Further, report will shed light on the manner in which graphical
presentation facilitates better understanding pertaining to data set.
TASK 1
A. Determining whether significant difference takes place in the earnings of men and women in
public sector
H0: There is no significant difference in the average earnings of both men and women working
in public sector.
H1: There is a significant difference in the average earnings of both men and women working in
public sector.
Particulars
Male ( Public
sector)
Female (Public
sector)
Average 32276.62 26929.87
Variance 1449962.27 977868.41
Observations 8 8
Hypothesized Mean Difference 0
df 13
t Statistics 9.71
P(T<=t) one-tail 1.2709E-07
t Critical one-tail 1.770933396
P(T<=t) two-tail 2.54179E-07
End of preview
Want to access all the pages? Upload your documents or become a member.
Related Documents
Statistics Solution Assignmentlg...
|21
|2421
|84
Statistics for Management Assignmentlg...
|19
|3677
|54
Statistics for Management INTRODUCTION 2 MAIN BODY2 TASK 12 B. Analysis and evaluatiolg...
|27
|3973
|312
Statistics Financial in UKlg...
|28
|4065
|51
Assignment Statistics for Managementlg...
|22
|4725
|101
Statics Financial Induced Decisionlg...
|20
|3378
|379