Biostatistics Analysis of ACU Student Health and Wellbeing Data
VerifiedAdded on 2023/01/19
|37
|7095
|30
Homework Assignment
AI Summary
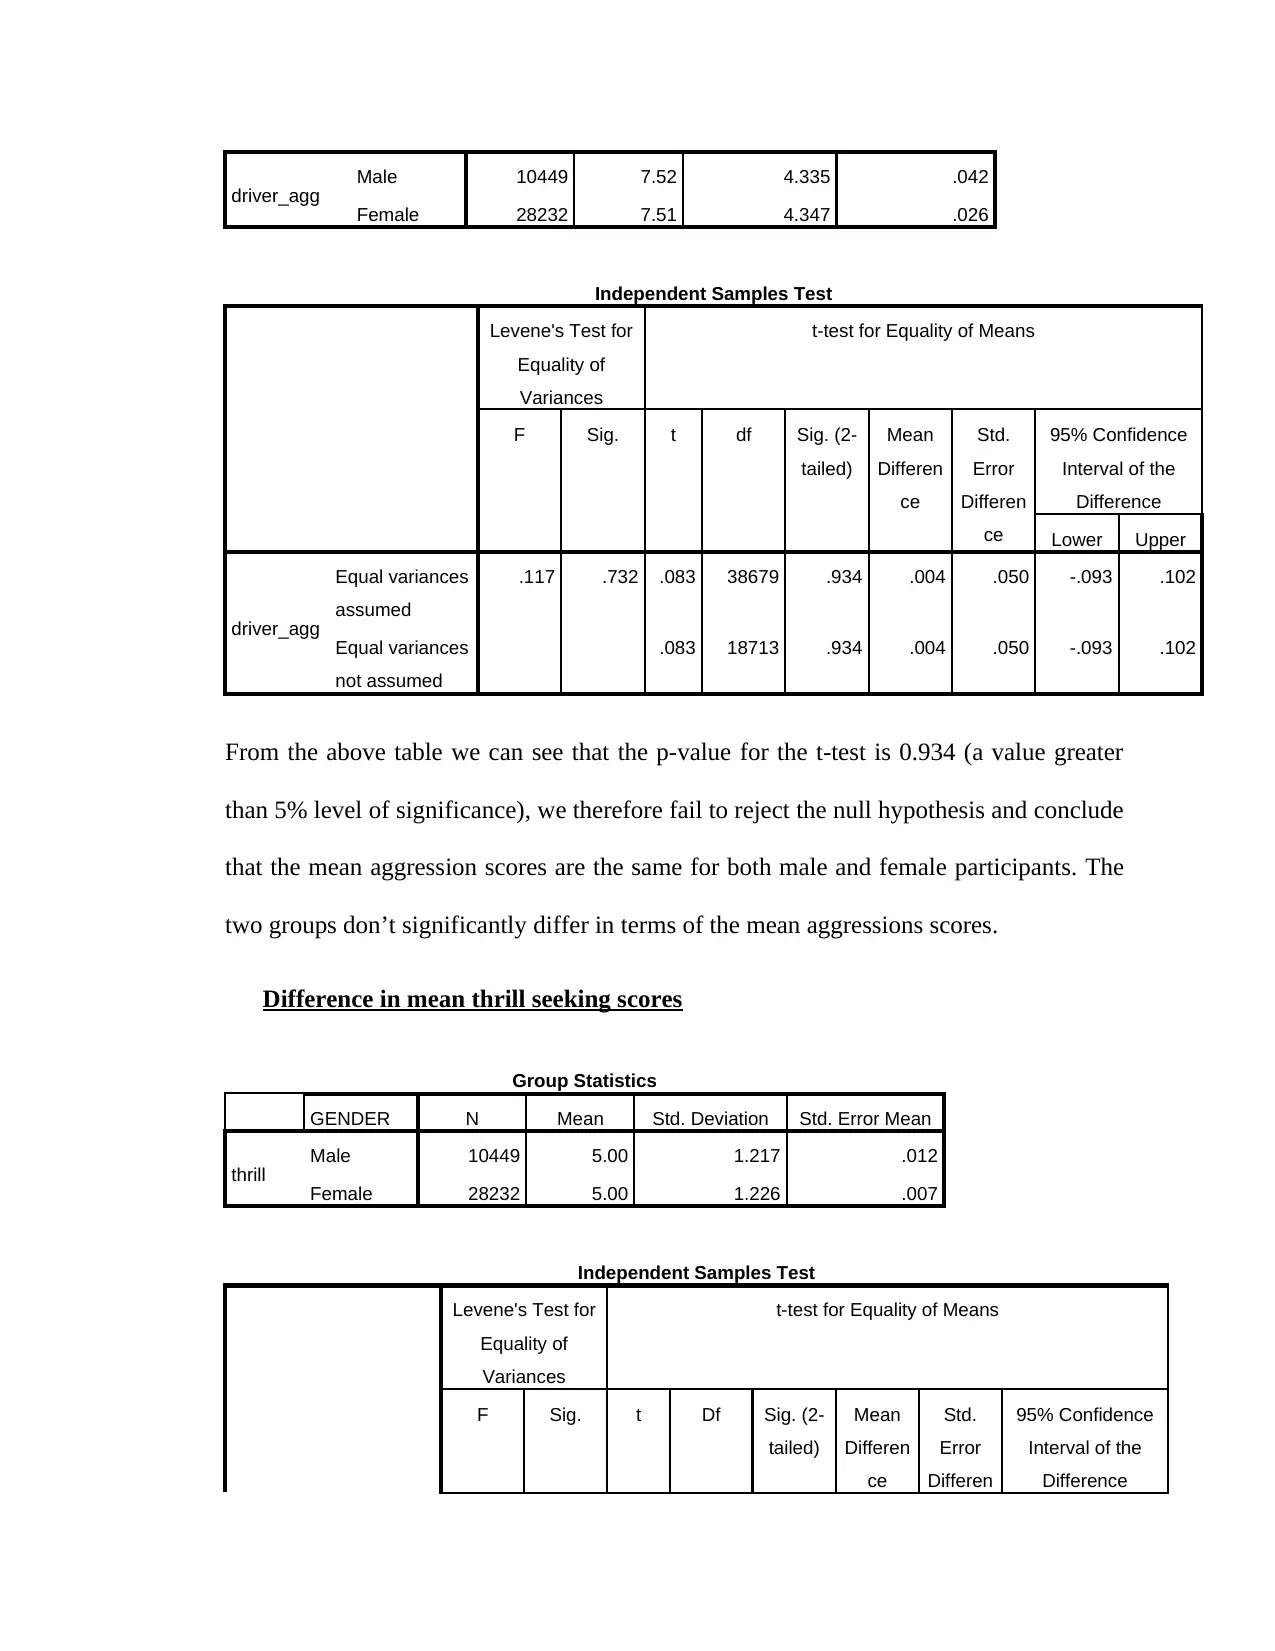
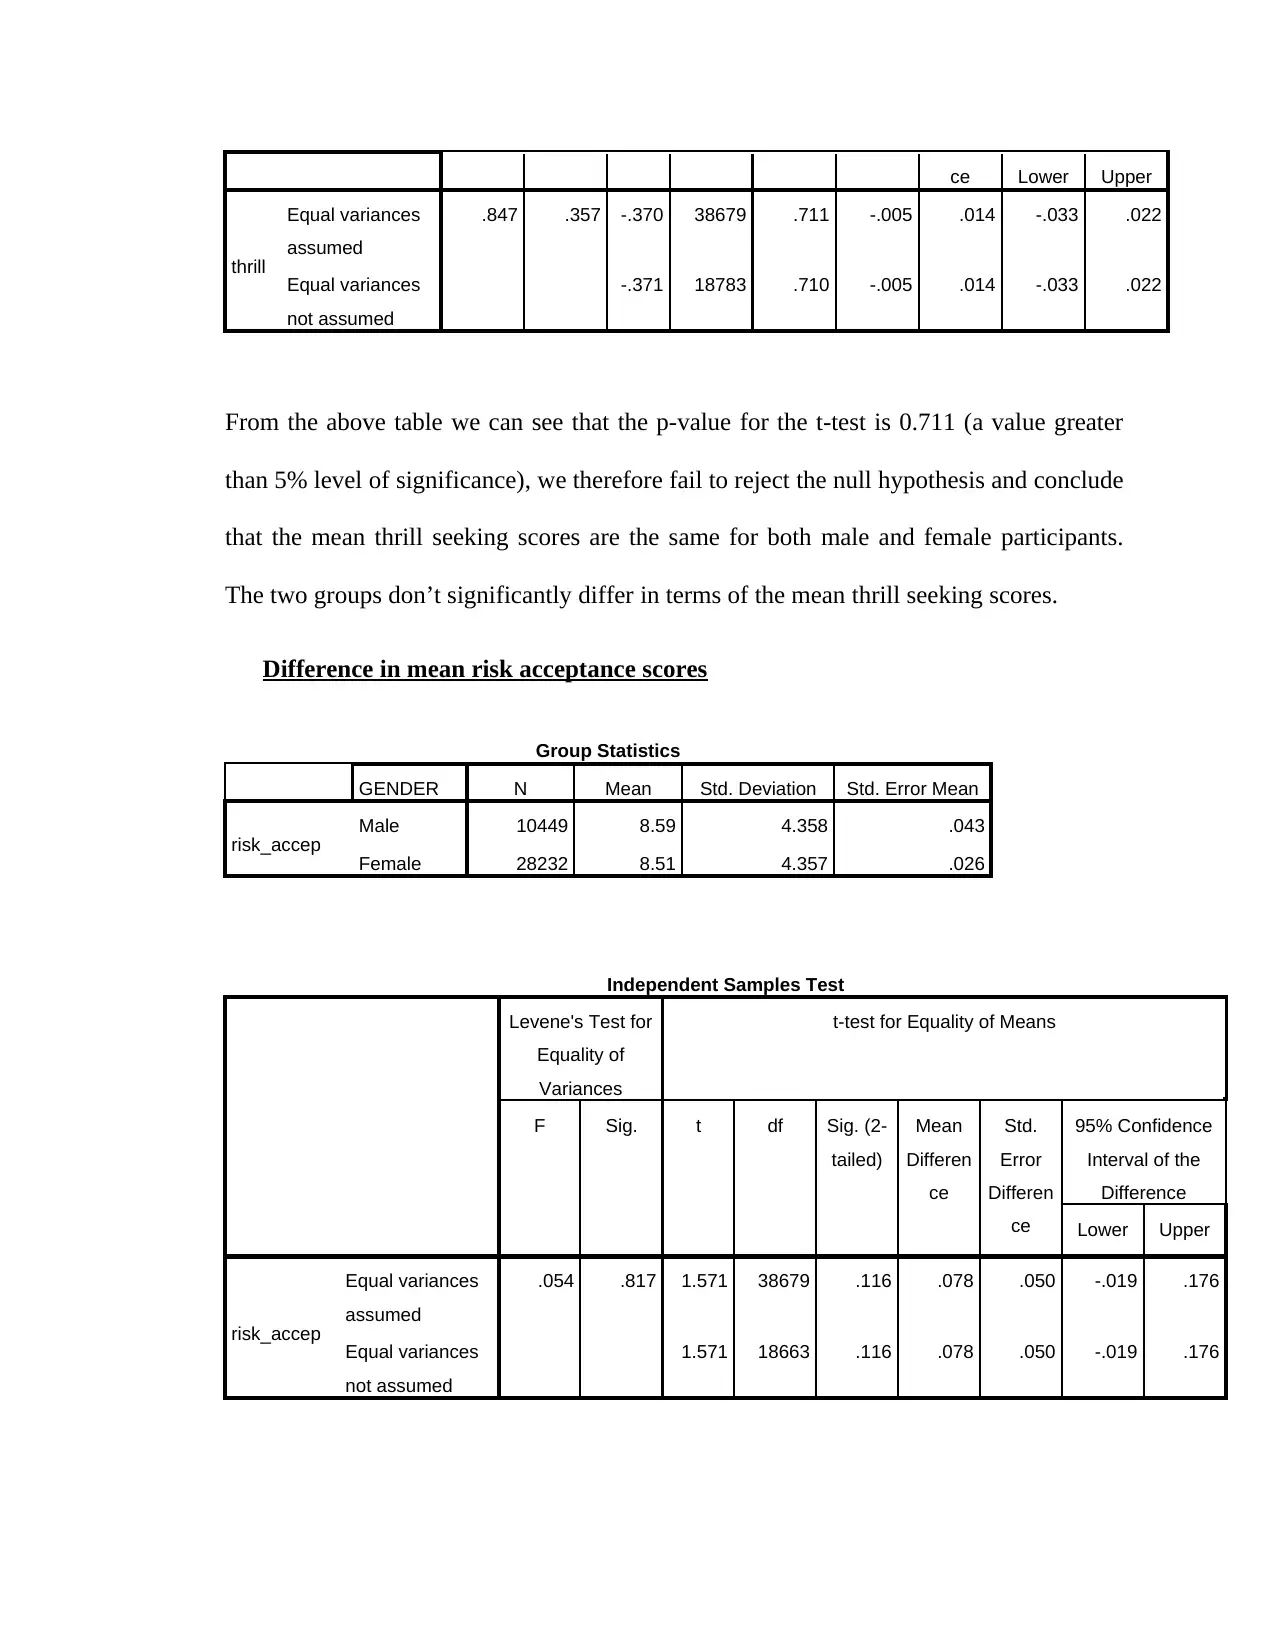
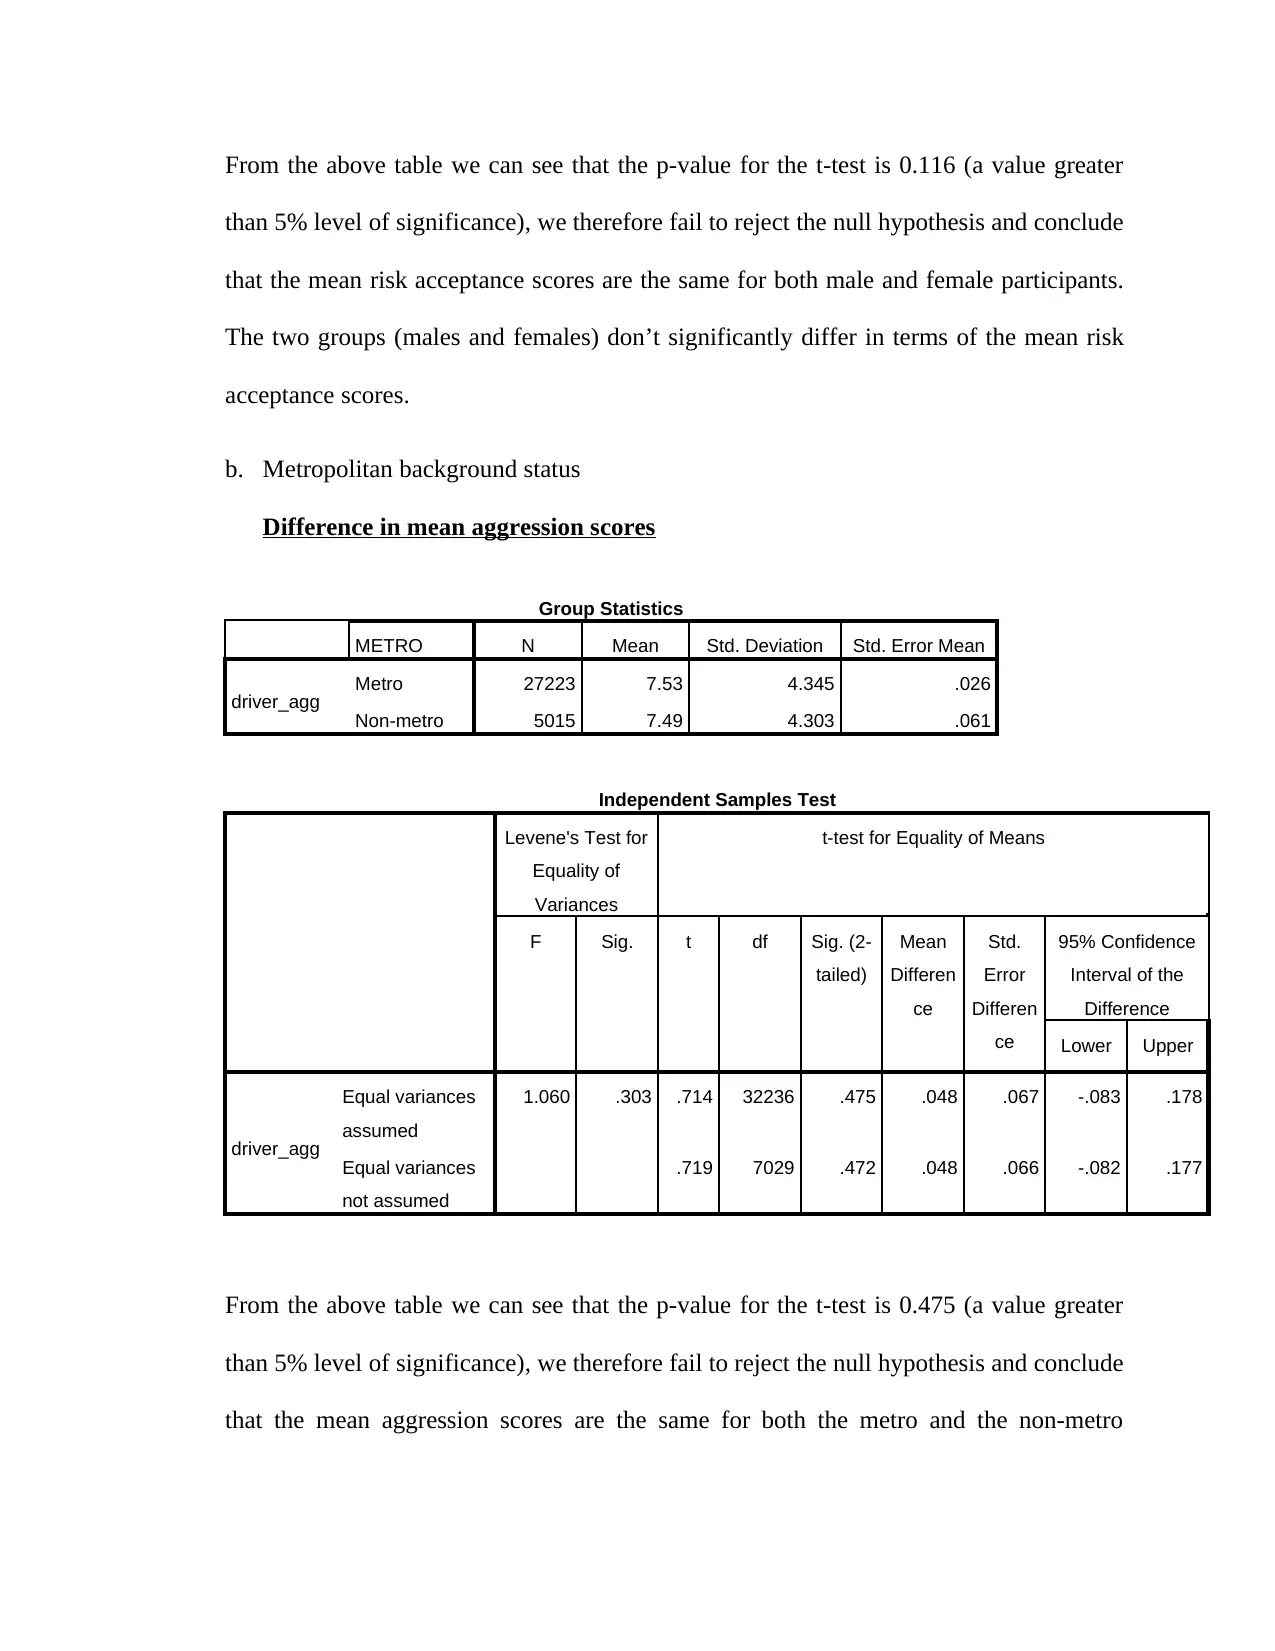
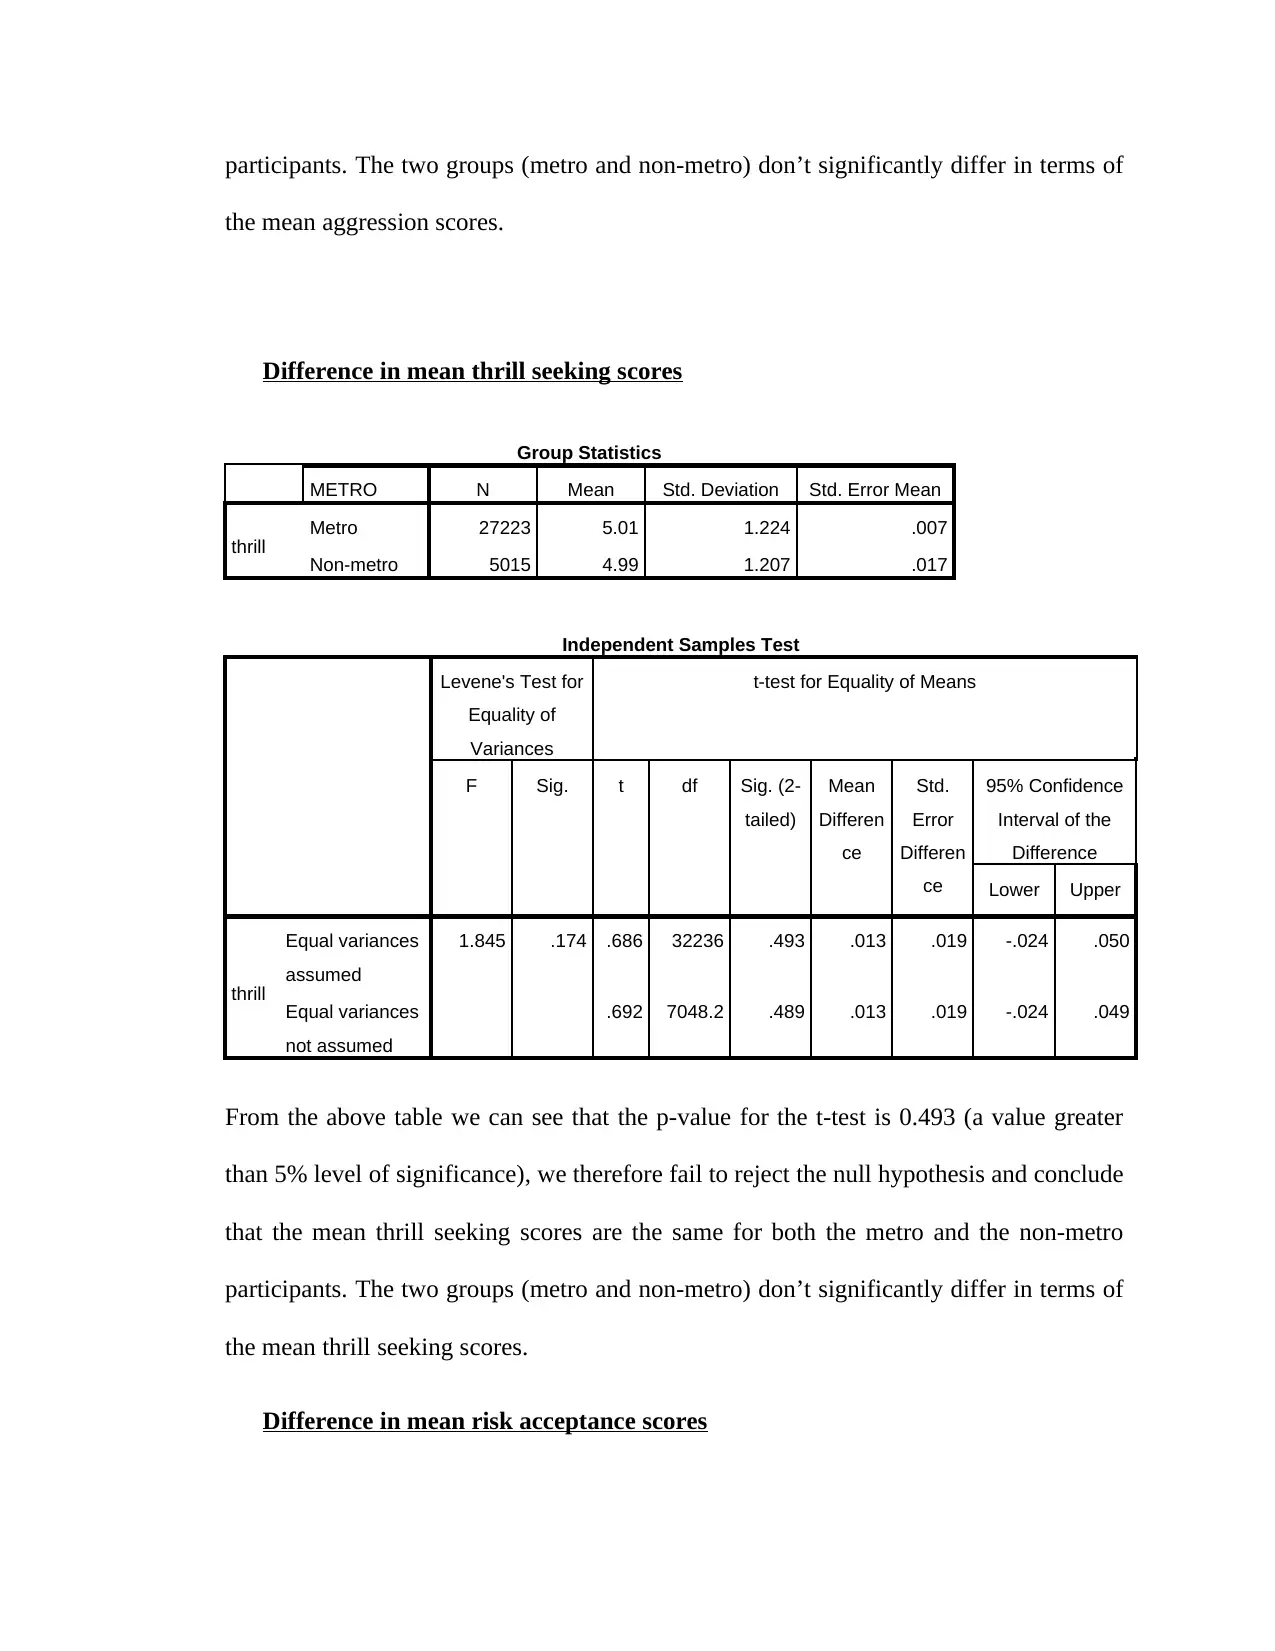
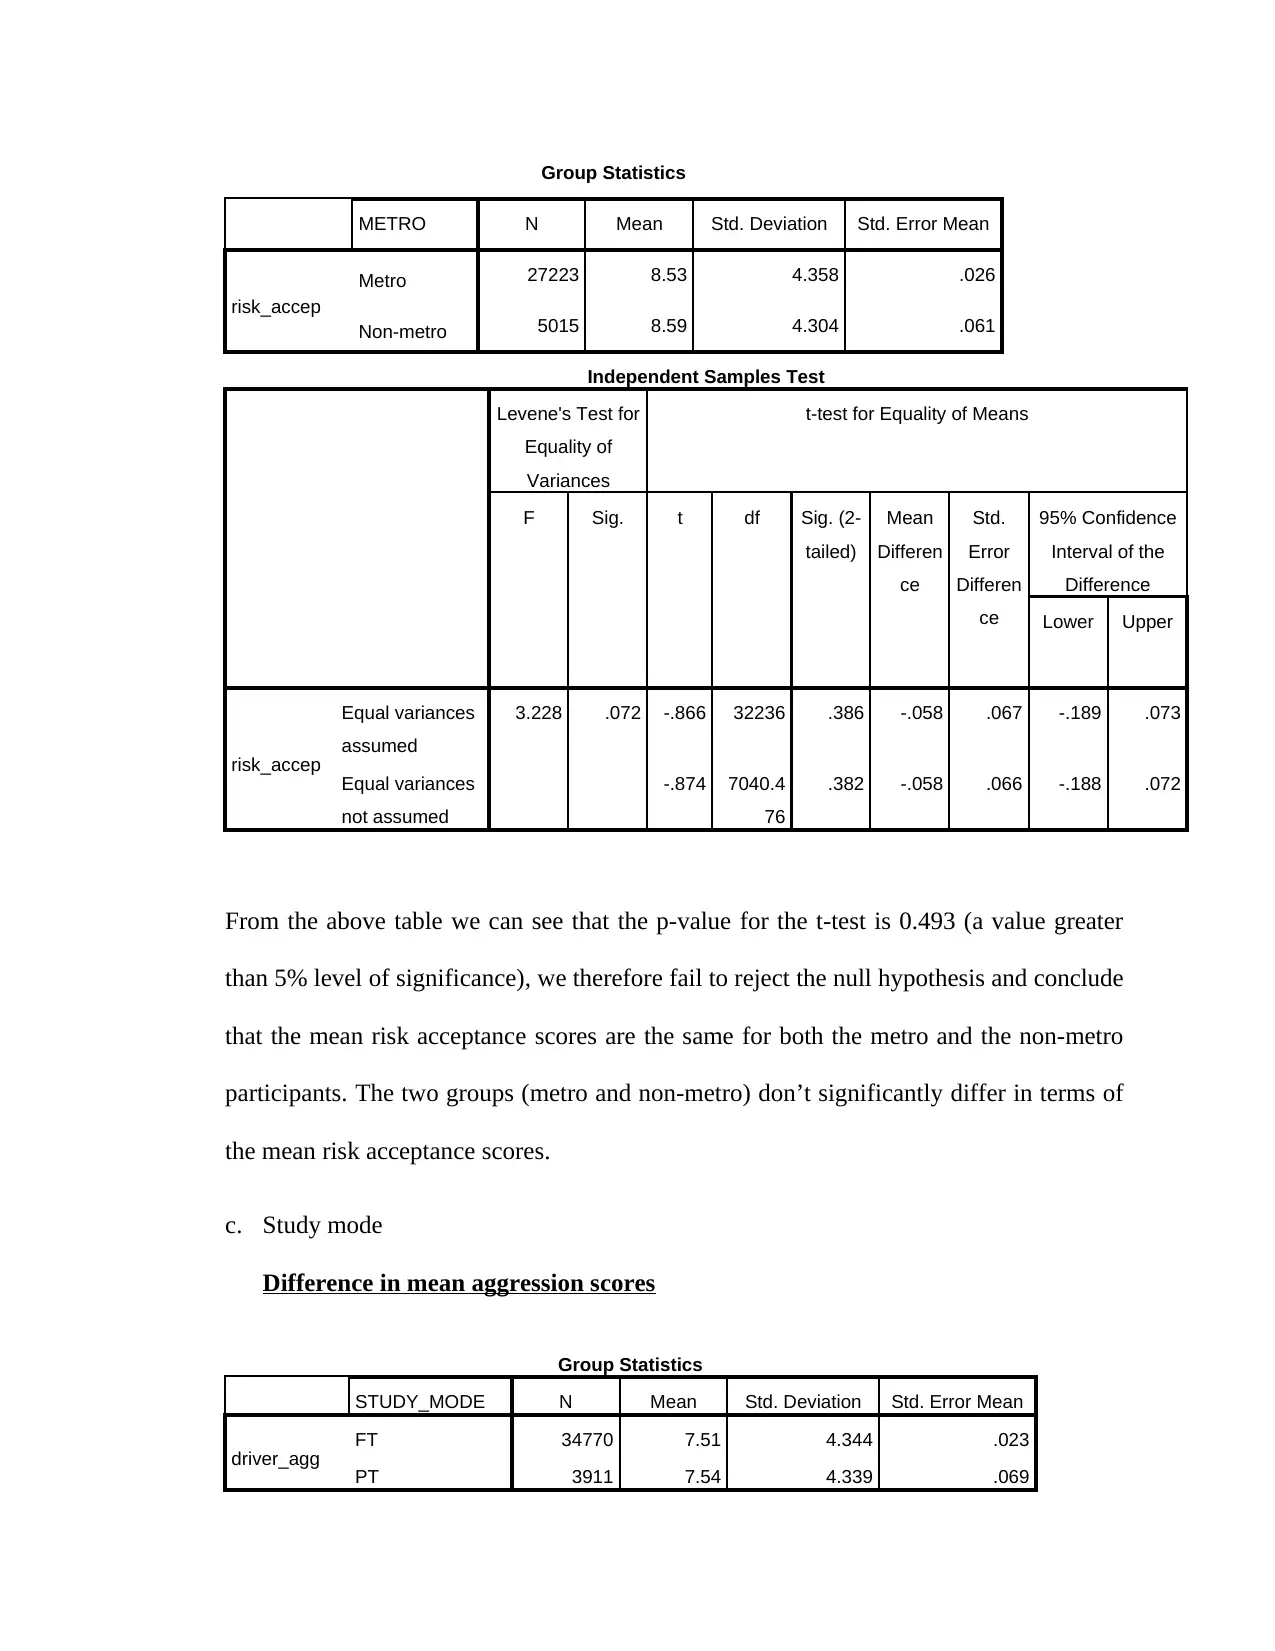
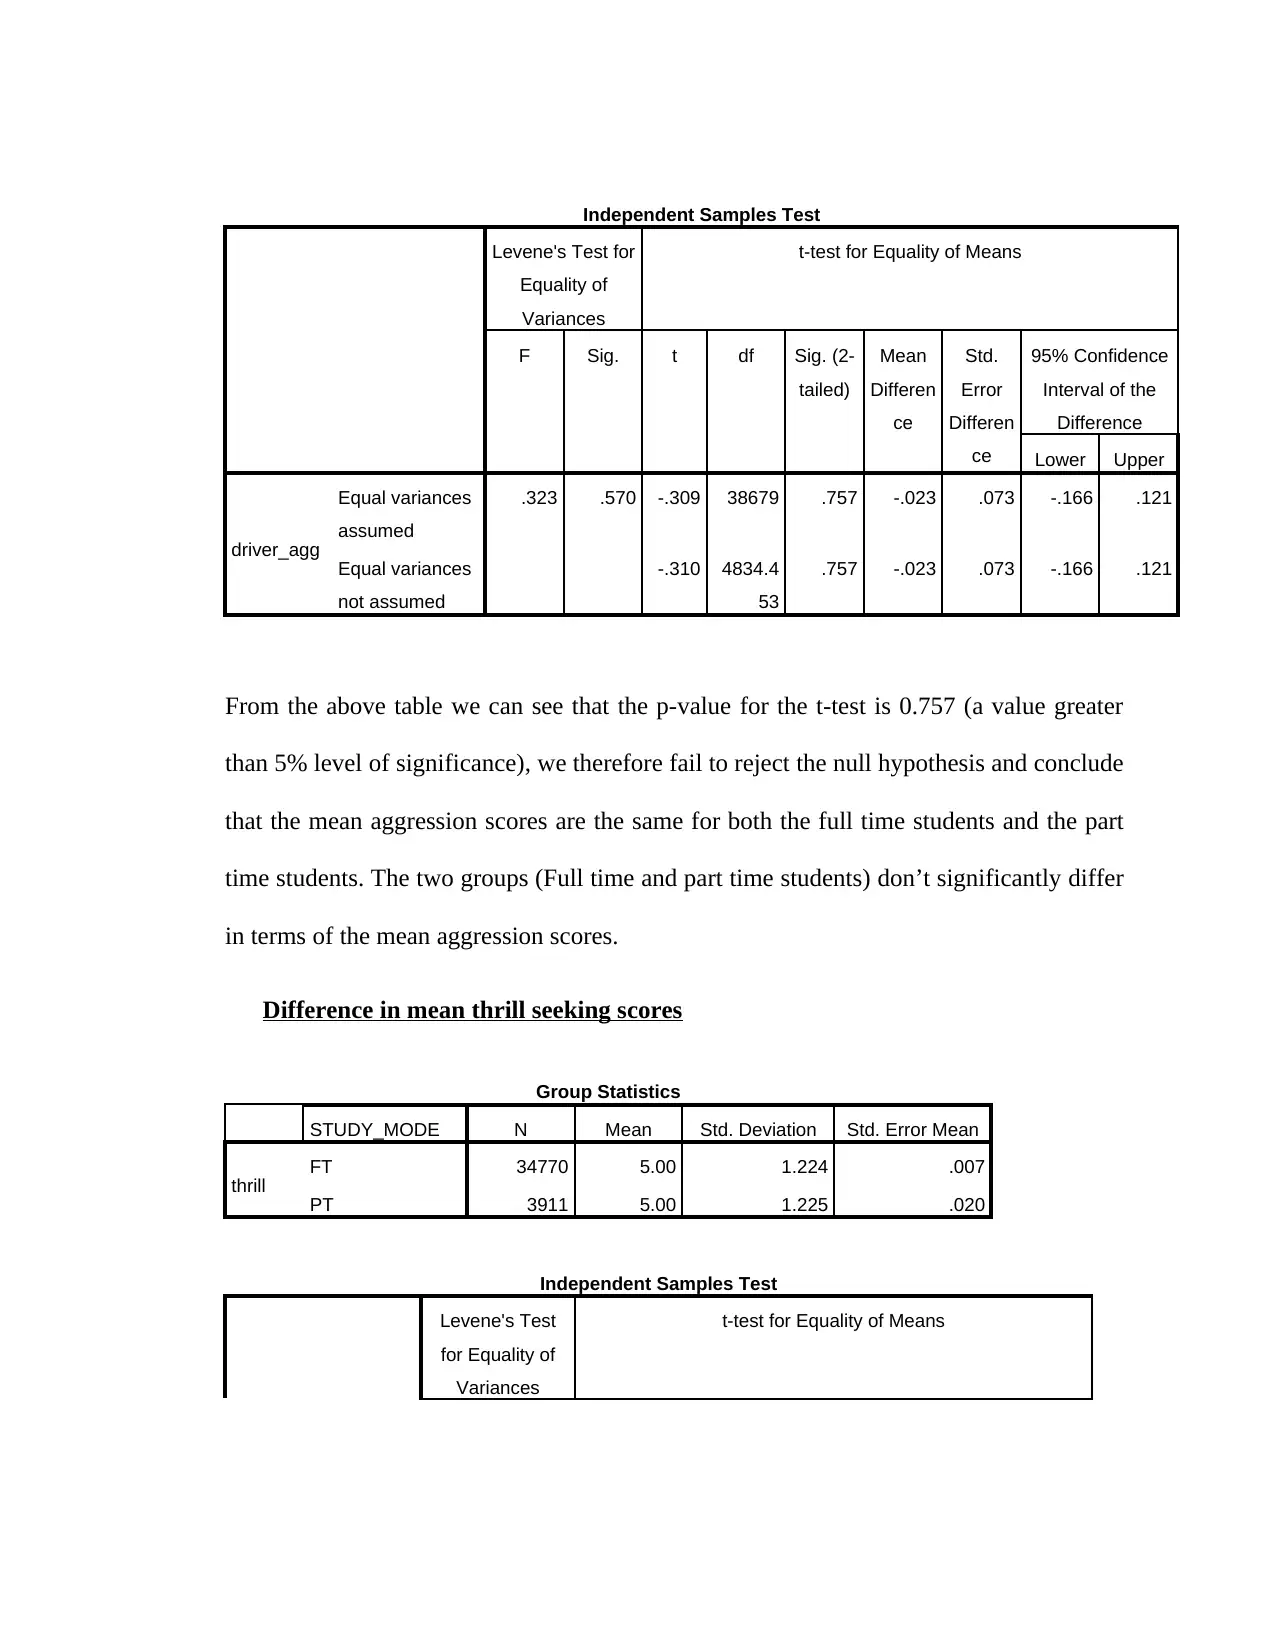
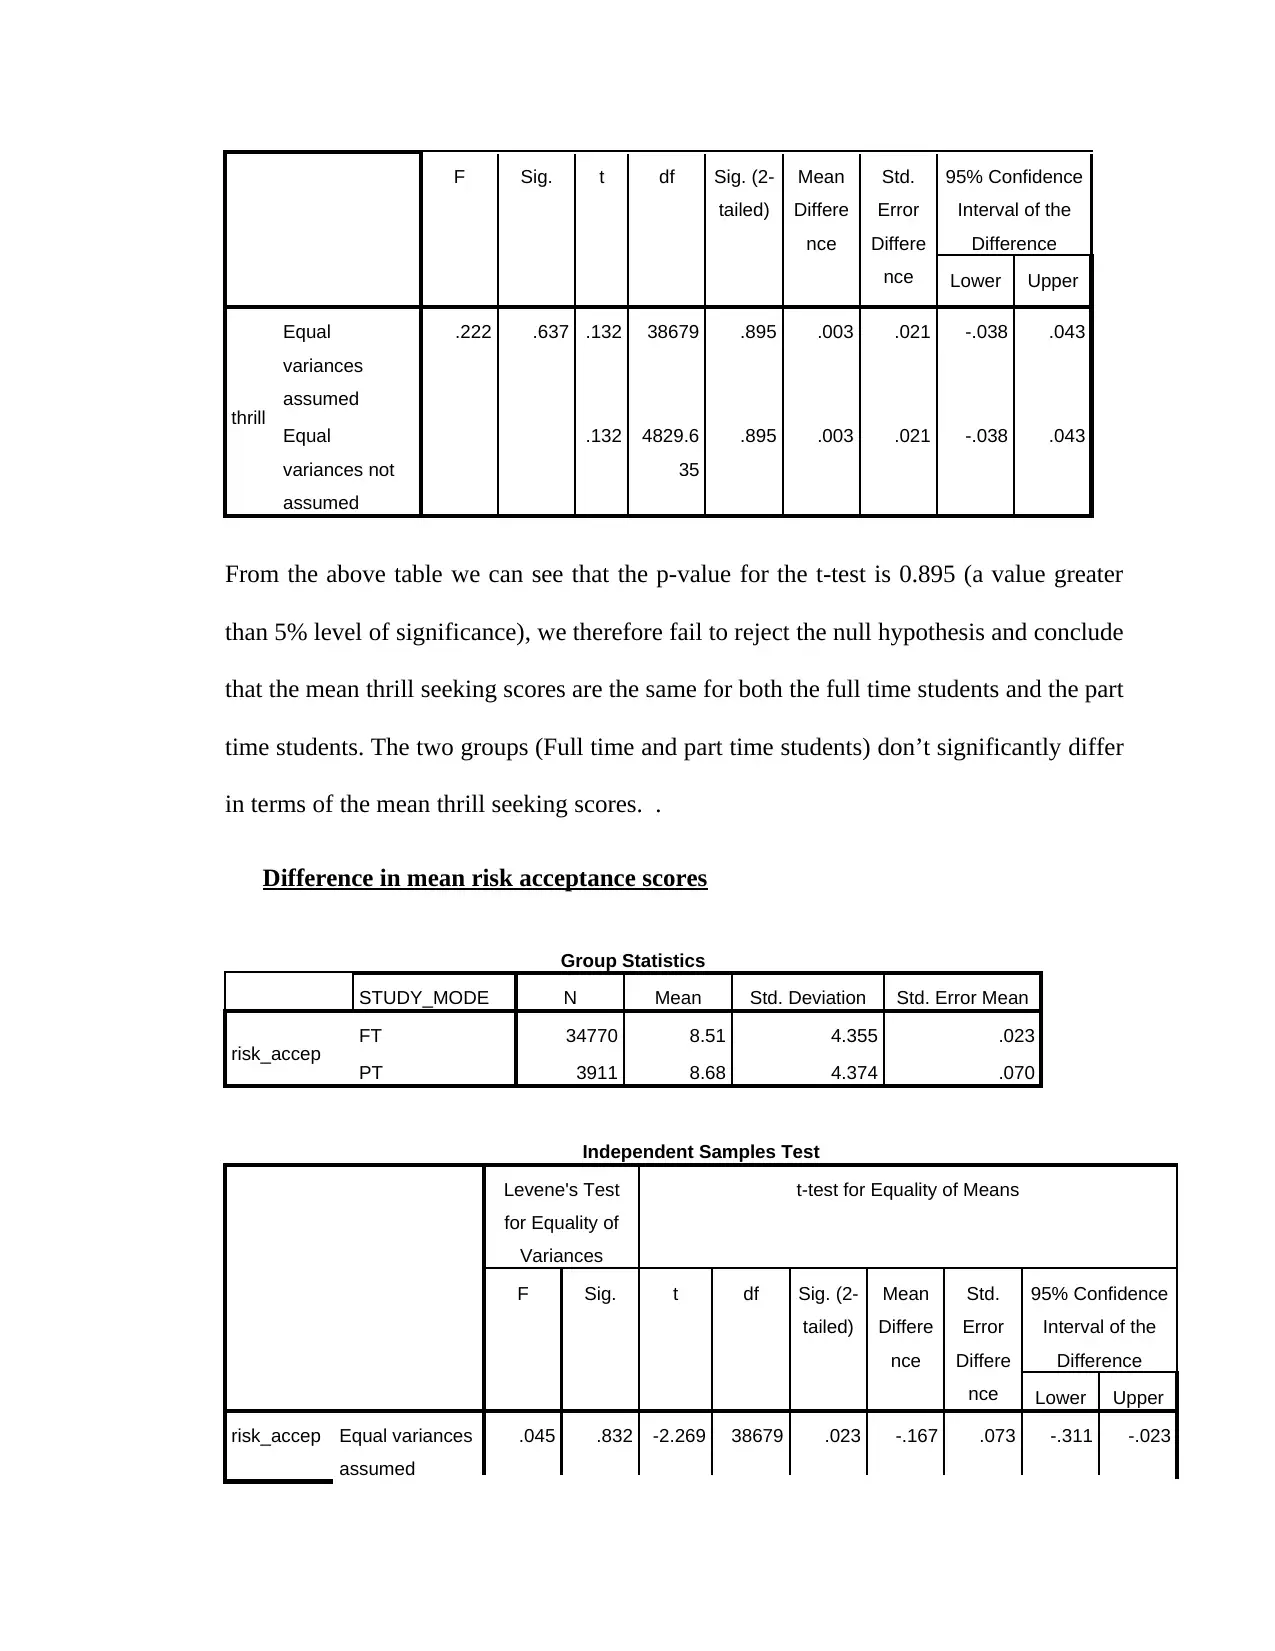
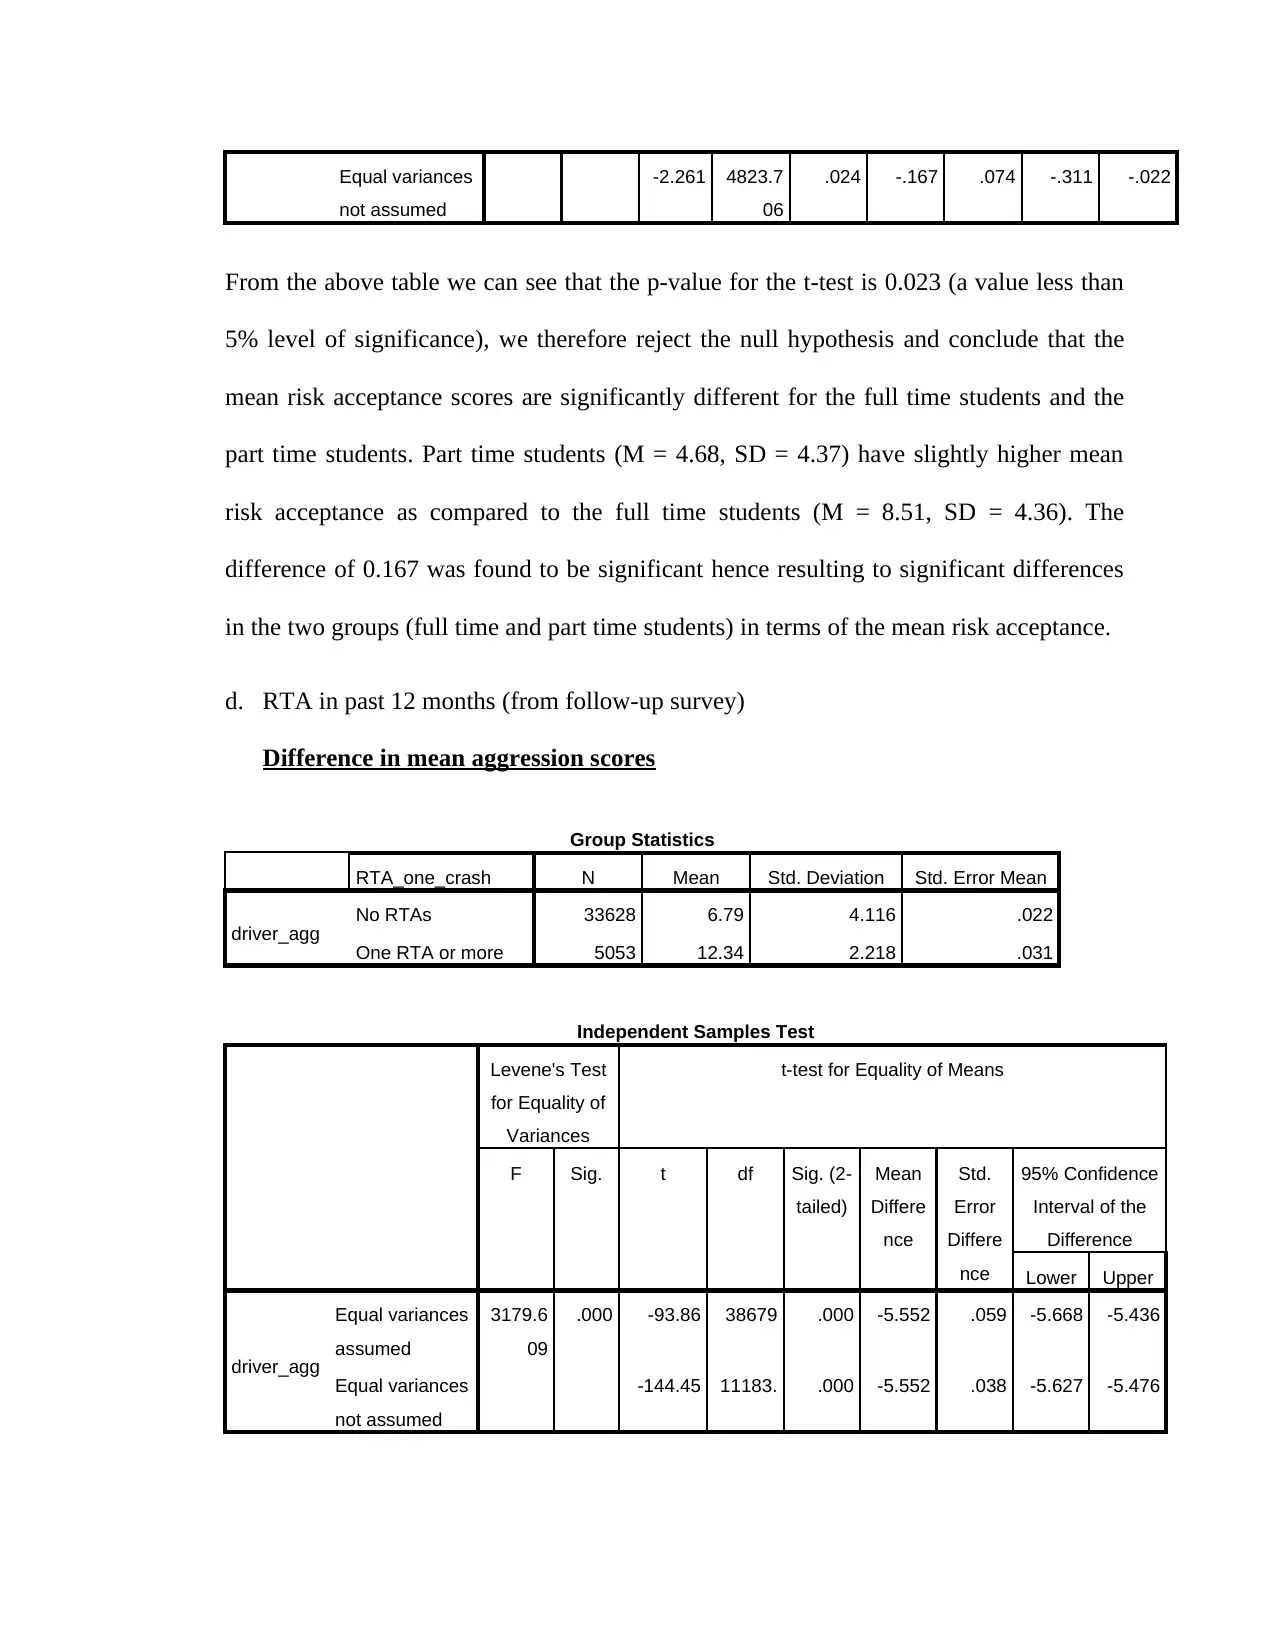
This assignment analyzes a dataset from the Longitudinal Survey of ACU Student Health and Wellbeing, focusing on baseline and follow-up data related to road traffic accidents, depression, and obesity. The analysis includes descriptive statistics for age, frequency distributions for age groups, and demographic characteristics. Furthermore, the assignment investigates differences in mean aggression, thrill-seeking, and risk acceptance scores across gender, metropolitan background, and study mode using t-tests. The findings reveal no significant differences in aggression, thrill-seeking, and risk acceptance scores between genders, metro and non-metro backgrounds, and full-time and part-time students, except for a significant difference in risk acceptance scores between full-time and part-time students. Additionally, the analysis explores the relationship between road traffic accidents and aggression scores.
1 out of 37
Related Documents


Your All-in-One AI-Powered Toolkit for Academic Success.
+13062052269
info@desklib.com
Available 24*7 on WhatsApp / Email
![[object Object]](/_next/static/media/star-bottom.7253800d.svg)
Copyright © 2020–2026 A2Z Services. All Rights Reserved. Developed and managed by ZUCOL.