logo

Comparison of Boeing Company (BA) and General Dynamics (GD) Stock Prices: Analysis and Findings

15 Pages4454 Words391 Views
   

Added on  2023-04-25

About This Document

In this document we will discuss about Comparison of Boeing Company (BA) and General Dynamics (GD) Stock Prices and below are the summary points of this document:-

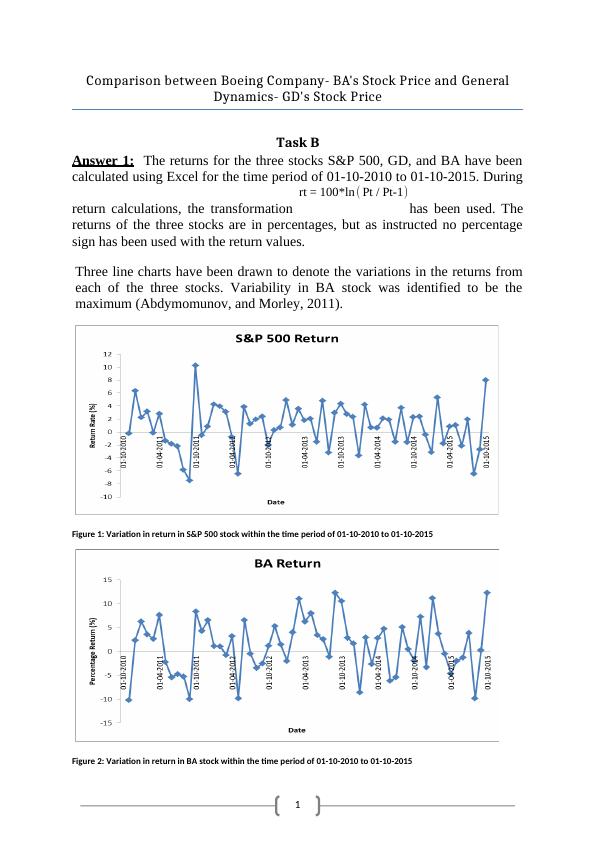
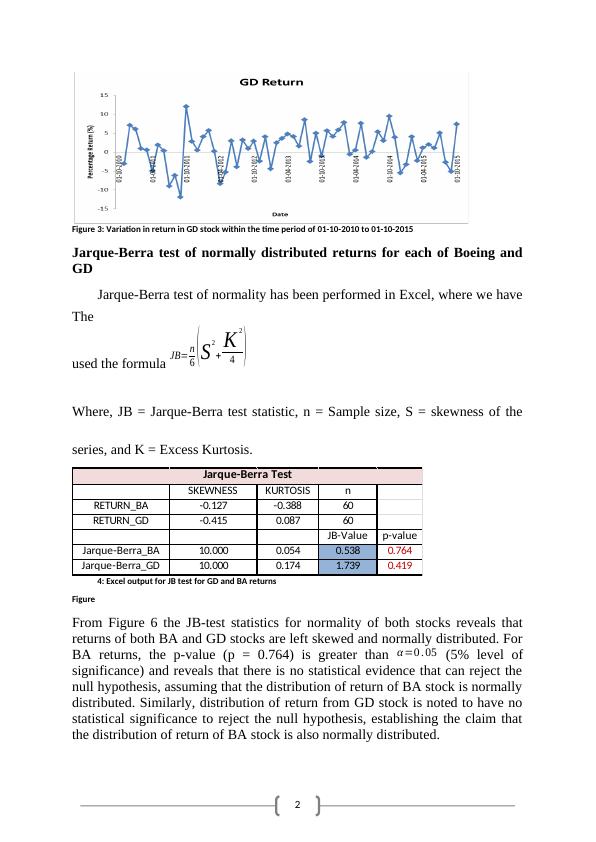
  • BA's stock price had the highest variability compared to GD and S&P 500.

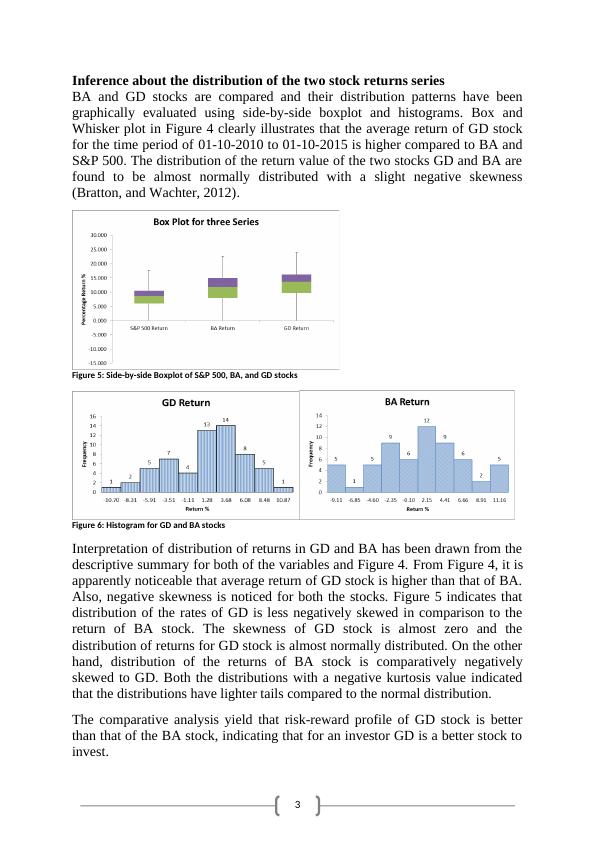
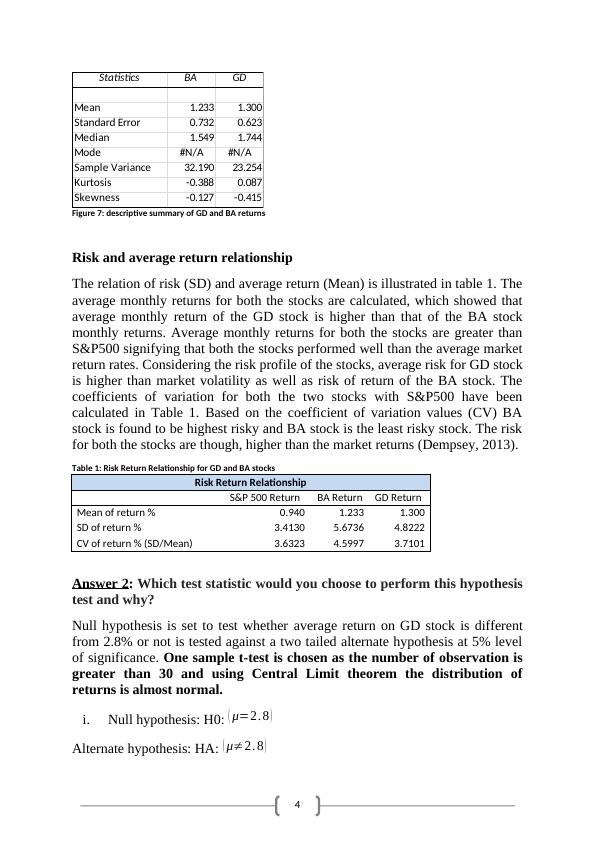
  • Both BA and GD stocks exhibited left-skewed and normally distributed returns.

  • GD stock had a higher average return compared to BA and showed a less negatively skewed distribution.

Comparison of Boeing Company (BA) and General Dynamics (GD) Stock Prices: Analysis and Findings

   Added on 2023-04-25

ShareRelated Documents
1
Comparison between Boeing Company- BA's Stock Price and General
Dynamics- GD's Stock Price
Task B
Answer 1: The returns for the three stocks S&P 500, GD, and BA have been
calculated using Excel for the time period of 01-10-2010 to 01-10-2015. During
return calculations, the transformation
rt = 100*ln ( Pt / Pt-1)
has been used. The
returns of the three stocks are in percentages, but as instructed no percentage
sign has been used with the return values.
Three line charts have been drawn to denote the variations in the returns from
each of the three stocks. Variability in BA stock was identified to be the
maximum (Abdymomunov, and Morley, 2011).
Figure 1: Variation in return in S&P 500 stock within the time period of 01-10-2010 to 01-10-2015
Figure 2: Variation in return in BA stock within the time period of 01-10-2010 to 01-10-2015
Comparison of Boeing Company (BA) and General Dynamics (GD) Stock Prices: Analysis and Findings_1
2
Figure 3: Variation in return in GD stock within the time period of 01-10-2010 to 01-10-2015
Jarque-Berra test of normally distributed returns for each of Boeing and
GD
The
Jarque-Berra test of normality has been performed in Excel, where we have
used the formula JB= n
6 ( S2
+
K 2
4 )
Where, JB = Jarque-Berra test statistic, n = Sample size, S = skewness of the
series, and K = Excess Kurtosis.
SKEWNESS KURTOSIS n
RETURN_BA -0.127 -0.388 60
RETURN_GD -0.415 0.087 60
JB-Value p-value
Jarque-Berra_BA 10.000 0.054 0.538 0.764
Jarque-Berra_GD 10.000 0.174 1.739 0.419
Jarque-Berra Test
Figure
4: Excel output for JB test for GD and BA returns
From Figure 6 the JB-test statistics for normality of both stocks reveals that
returns of both BA and GD stocks are left skewed and normally distributed. For
BA returns, the p-value (p = 0.764) is greater than α =0 . 05 (5% level of
significance) and reveals that there is no statistical evidence that can reject the
null hypothesis, assuming that the distribution of return of BA stock is normally
distributed. Similarly, distribution of return from GD stock is noted to have no
statistical significance to reject the null hypothesis, establishing the claim that
the distribution of return of BA stock is also normally distributed.
Comparison of Boeing Company (BA) and General Dynamics (GD) Stock Prices: Analysis and Findings_2
3
Inference about the distribution of the two stock returns series
BA and GD stocks are compared and their distribution patterns have been
graphically evaluated using side-by-side boxplot and histograms. Box and
Whisker plot in Figure 4 clearly illustrates that the average return of GD stock
for the time period of 01-10-2010 to 01-10-2015 is higher compared to BA and
S&P 500. The distribution of the return value of the two stocks GD and BA are
found to be almost normally distributed with a slight negative skewness
(Bratton, and Wachter, 2012).
Figure 5: Side-by-side Boxplot of S&P 500, BA, and GD stocks
Figure 6: Histogram for GD and BA stocks
Interpretation of distribution of returns in GD and BA has been drawn from the
descriptive summary for both of the variables and Figure 4. From Figure 4, it is
apparently noticeable that average return of GD stock is higher than that of BA.
Also, negative skewness is noticed for both the stocks. Figure 5 indicates that
distribution of the rates of GD is less negatively skewed in comparison to the
return of BA stock. The skewness of GD stock is almost zero and the
distribution of returns for GD stock is almost normally distributed. On the other
hand, distribution of the returns of BA stock is comparatively negatively
skewed to GD. Both the distributions with a negative kurtosis value indicated
that the distributions have lighter tails compared to the normal distribution.
The comparative analysis yield that risk-reward profile of GD stock is better
than that of the BA stock, indicating that for an investor GD is a better stock to
invest.
Comparison of Boeing Company (BA) and General Dynamics (GD) Stock Prices: Analysis and Findings_3
4
Statistics BA GD
Mean 1.233 1.300
Standard Error 0.732 0.623
Median 1.549 1.744
Mode #N/A #N/A
Sample Variance 32.190 23.254
Kurtosis -0.388 0.087
Skewness -0.127 -0.415
Figure 7: descriptive summary of GD and BA returns
Risk and average return relationship
The relation of risk (SD) and average return (Mean) is illustrated in table 1. The
average monthly returns for both the stocks are calculated, which showed that
average monthly return of the GD stock is higher than that of the BA stock
monthly returns. Average monthly returns for both the stocks are greater than
S&P500 signifying that both the stocks performed well than the average market
return rates. Considering the risk profile of the stocks, average risk for GD stock
is higher than market volatility as well as risk of return of the BA stock. The
coefficients of variation for both the two stocks with S&P500 have been
calculated in Table 1. Based on the coefficient of variation values (CV) BA
stock is found to be highest risky and BA stock is the least risky stock. The risk
for both the stocks are though, higher than the market returns (Dempsey, 2013).
Table 1: Risk Return Relationship for GD and BA stocks
Risk Return Relationship
S&P 500 Return BA Return GD Return
Mean of return % 0.940 1.233 1.300
SD of return % 3.4130 5.6736 4.8222
CV of return % (SD/Mean) 3.6323 4.5997 3.7101
Answer 2: Which test statistic would you choose to perform this hypothesis
test and why?
Null hypothesis is set to test whether average return on GD stock is different
from 2.8% or not is tested against a two tailed alternate hypothesis at 5% level
of significance. One sample t-test is chosen as the number of observation is
greater than 30 and using Central Limit theorem the distribution of
returns is almost normal.
i. Null hypothesis: H0: ( μ=2. 8 )
Alternate hypothesis: HA: ( μ2. 8 )
Comparison of Boeing Company (BA) and General Dynamics (GD) Stock Prices: Analysis and Findings_4

End of preview

Want to access all the pages? Upload your documents or become a member.

Related Documents
Statistical Analysis and Comparison between Stock Prices of Boeing Company and General Dynamics
|12
|4094
|443

Statistics for Business and Finance Assignment
|15
|3064
|264

Which Stock Should I Invest In PHUONG THAO BUI
|11
|2540
|64

Stock Returns: Boeing & IBM Analysis Report
|14
|2616
|155

Statistics for Business: Statistical Inference and Simple Regression Analysis
|9
|1819
|319

Statistics of Business and Finance
|9
|1388
|439