Statistical Analysis and Comparison between Stock Prices of Boeing Company and General Dynamics
12 Pages4094 Words443 Views
Added on 2023-04-20
About This Document
This document provides a statistical analysis and comparison between the stock prices of Boeing Company and General Dynamics. The analysis includes volatility and market returns assessment, risk and average return relationship analysis, and hypothesis testing to compare average market returns and market risks.
Statistical Analysis and Comparison between Stock Prices of Boeing Company and General Dynamics
Added on 2023-04-20
ShareRelated Documents
Statistical Analysis and Comparison between Stock Prices of the
Boeing Company and the General Dynamics
Assignment 2: Which stock should be invested in?
ANS 1: The comparative analysis of stock prices of Boeing Company (BA) and General
Dynamics (GD) has been compared, especially with S&P500 stock. The software used for the
statistical analysis was MS Excel. Historical monthly data for BA, GD, S&P 500, and US TN
(10 Year) were downloaded for the period 01/03/2012 to 31/03/2017 (ID: 19616181). The
percentage returns (without the signs) for the said period were calculated using the formula
rt=100 *ln ( Pt
Pt −1 ) where “rt” denotes the monthly return of a stock.
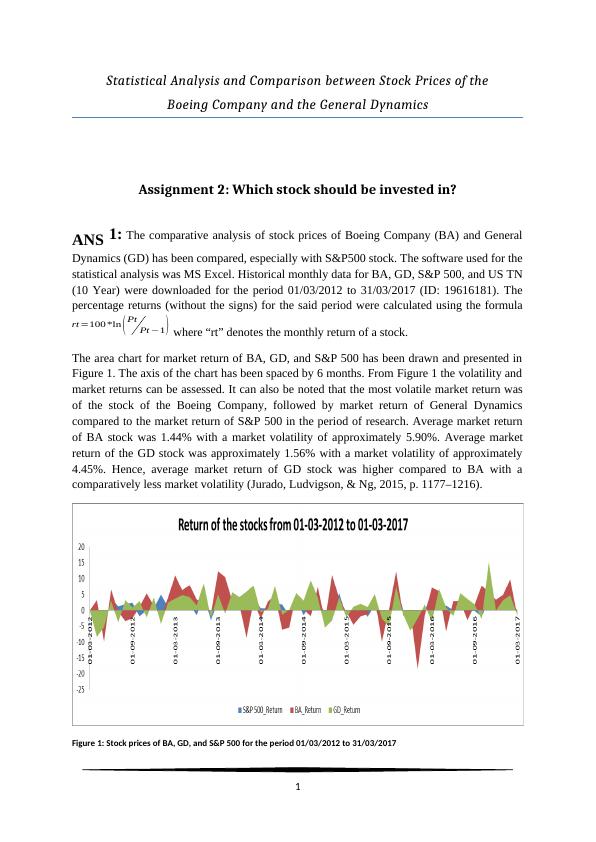
The area chart for market return of BA, GD, and S&P 500 has been drawn and presented in
Figure 1. The axis of the chart has been spaced by 6 months. From Figure 1 the volatility and
market returns can be assessed. It can also be noted that the most volatile market return was
of the stock of the Boeing Company, followed by market return of General Dynamics
compared to the market return of S&P 500 in the period of research. Average market return
of BA stock was 1.44% with a market volatility of approximately 5.90%. Average market
return of the GD stock was approximately 1.56% with a market volatility of approximately
4.45%. Hence, average market return of GD stock was higher compared to BA with a
comparatively less market volatility (Jurado, Ludvigson, & Ng, 2015, p. 1177–1216).
Figure 1: Stock prices of BA, GD, and S&P 500 for the period 01/03/2012 to 31/03/2017
1
Boeing Company and the General Dynamics
Assignment 2: Which stock should be invested in?
ANS 1: The comparative analysis of stock prices of Boeing Company (BA) and General
Dynamics (GD) has been compared, especially with S&P500 stock. The software used for the
statistical analysis was MS Excel. Historical monthly data for BA, GD, S&P 500, and US TN
(10 Year) were downloaded for the period 01/03/2012 to 31/03/2017 (ID: 19616181). The
percentage returns (without the signs) for the said period were calculated using the formula
rt=100 *ln ( Pt
Pt −1 ) where “rt” denotes the monthly return of a stock.
The area chart for market return of BA, GD, and S&P 500 has been drawn and presented in
Figure 1. The axis of the chart has been spaced by 6 months. From Figure 1 the volatility and
market returns can be assessed. It can also be noted that the most volatile market return was
of the stock of the Boeing Company, followed by market return of General Dynamics
compared to the market return of S&P 500 in the period of research. Average market return
of BA stock was 1.44% with a market volatility of approximately 5.90%. Average market
return of the GD stock was approximately 1.56% with a market volatility of approximately
4.45%. Hence, average market return of GD stock was higher compared to BA with a
comparatively less market volatility (Jurado, Ludvigson, & Ng, 2015, p. 1177–1216).
Figure 1: Stock prices of BA, GD, and S&P 500 for the period 01/03/2012 to 31/03/2017
1
Test of Normality of the BA and GD market returns using Jarque-Berra test of
normality
The market returns for the time period of 01/03/2012 to 31/03/2017 were tested for
normality. The primary aim was to select the best stock out of these two stocks, and test of
normality was required to assess the volatility in market return throughout the period of
research. Jarque-Berra test of normality was used with calculation of skewness (S) and excess
kurtosis (K) of market returns for the BA and GD stocks for the time period of 60 months (n).
The calculation has been presented in Table 1. The significance level for the test was
considered to be α =0 . 05 (Kim, 2016, p. 48–52).
Formula for Jarque-Berra test of normality:
JB= n
6 ( S2+ K2
4 )
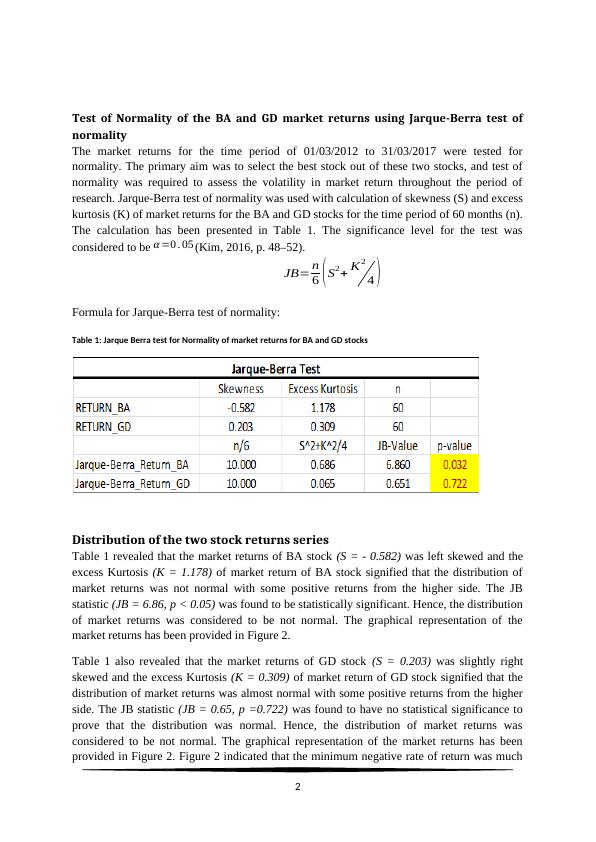
Table 1: Jarque Berra test for Normality of market returns for BA and GD stocks
Distribution of the two stock returns series
Table 1 revealed that the market returns of BA stock (S = - 0.582) was left skewed and the
excess Kurtosis (K = 1.178) of market return of BA stock signified that the distribution of
market returns was not normal with some positive returns from the higher side. The JB
statistic (JB = 6.86, p < 0.05) was found to be statistically significant. Hence, the distribution
of market returns was considered to be not normal. The graphical representation of the
market returns has been provided in Figure 2.
Table 1 also revealed that the market returns of GD stock (S = 0.203) was slightly right
skewed and the excess Kurtosis (K = 0.309) of market return of GD stock signified that the
distribution of market returns was almost normal with some positive returns from the higher
side. The JB statistic (JB = 0.65, p =0.722) was found to have no statistical significance to
prove that the distribution was normal. Hence, the distribution of market returns was
considered to be not normal. The graphical representation of the market returns has been
provided in Figure 2. Figure 2 indicated that the minimum negative rate of return was much
2
normality
The market returns for the time period of 01/03/2012 to 31/03/2017 were tested for
normality. The primary aim was to select the best stock out of these two stocks, and test of
normality was required to assess the volatility in market return throughout the period of
research. Jarque-Berra test of normality was used with calculation of skewness (S) and excess
kurtosis (K) of market returns for the BA and GD stocks for the time period of 60 months (n).
The calculation has been presented in Table 1. The significance level for the test was
considered to be α =0 . 05 (Kim, 2016, p. 48–52).
Formula for Jarque-Berra test of normality:
JB= n
6 ( S2+ K2
4 )
Table 1: Jarque Berra test for Normality of market returns for BA and GD stocks
Distribution of the two stock returns series
Table 1 revealed that the market returns of BA stock (S = - 0.582) was left skewed and the
excess Kurtosis (K = 1.178) of market return of BA stock signified that the distribution of
market returns was not normal with some positive returns from the higher side. The JB
statistic (JB = 6.86, p < 0.05) was found to be statistically significant. Hence, the distribution
of market returns was considered to be not normal. The graphical representation of the
market returns has been provided in Figure 2.
Table 1 also revealed that the market returns of GD stock (S = 0.203) was slightly right
skewed and the excess Kurtosis (K = 0.309) of market return of GD stock signified that the
distribution of market returns was almost normal with some positive returns from the higher
side. The JB statistic (JB = 0.65, p =0.722) was found to have no statistical significance to
prove that the distribution was normal. Hence, the distribution of market returns was
considered to be not normal. The graphical representation of the market returns has been
provided in Figure 2. Figure 2 indicated that the minimum negative rate of return was much
2
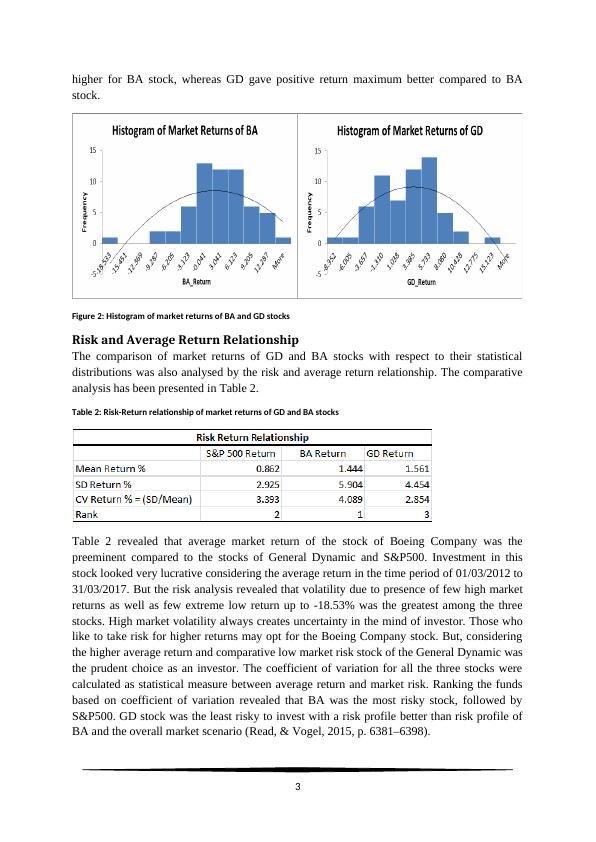
higher for BA stock, whereas GD gave positive return maximum better compared to BA
stock.
Figure 2: Histogram of market returns of BA and GD stocks
Risk and Average Return Relationship
The comparison of market returns of GD and BA stocks with respect to their statistical
distributions was also analysed by the risk and average return relationship. The comparative
analysis has been presented in Table 2.
Table 2: Risk-Return relationship of market returns of GD and BA stocks
Table 2 revealed that average market return of the stock of Boeing Company was the
preeminent compared to the stocks of General Dynamic and S&P500. Investment in this
stock looked very lucrative considering the average return in the time period of 01/03/2012 to
31/03/2017. But the risk analysis revealed that volatility due to presence of few high market
returns as well as few extreme low return up to -18.53% was the greatest among the three
stocks. High market volatility always creates uncertainty in the mind of investor. Those who
like to take risk for higher returns may opt for the Boeing Company stock. But, considering
the higher average return and comparative low market risk stock of the General Dynamic was
the prudent choice as an investor. The coefficient of variation for all the three stocks were
calculated as statistical measure between average return and market risk. Ranking the funds
based on coefficient of variation revealed that BA was the most risky stock, followed by
S&P500. GD stock was the least risky to invest with a risk profile better than risk profile of
BA and the overall market scenario (Read, & Vogel, 2015, p. 6381–6398).
3
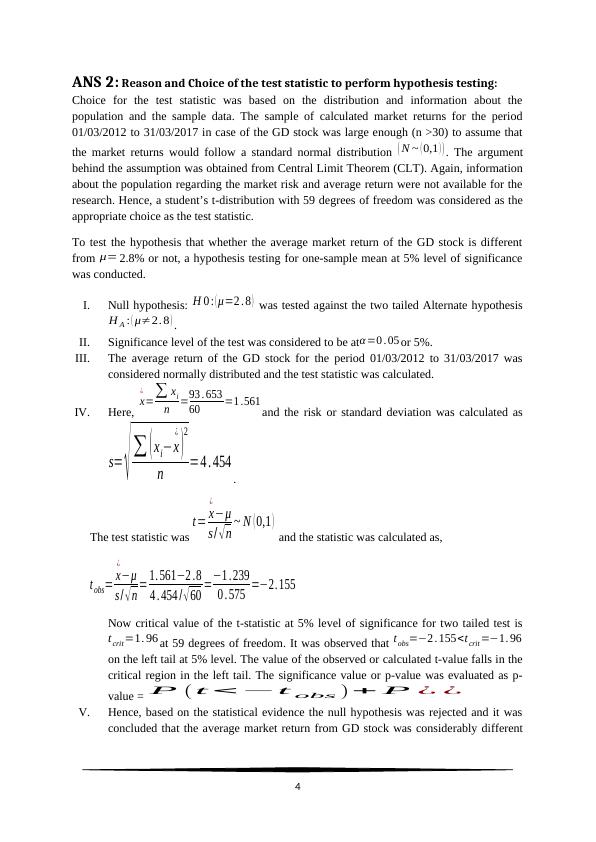
ANS 2: Reason and Choice of the test statistic to perform hypothesis testing:
Choice for the test statistic was based on the distribution and information about the
population and the sample data. The sample of calculated market returns for the period
01/03/2012 to 31/03/2017 in case of the GD stock was large enough (n >30) to assume that
the market returns would follow a standard normal distribution ( N ~ ( 0,1 ) ) . The argument
behind the assumption was obtained from Central Limit Theorem (CLT). Again, information
about the population regarding the market risk and average return were not available for the
research. Hence, a student’s t-distribution with 59 degrees of freedom was considered as the
appropriate choice as the test statistic.
To test the hypothesis that whether the average market return of the GD stock is different
from μ= 2.8% or not, a hypothesis testing for one-sample mean at 5% level of significance
was conducted.
I. Null hypothesis: H 0 : ( μ=2 . 8 ) was tested against the two tailed Alternate hypothesis
H A : ( μ≠2. 8 ) .
II. Significance level of the test was considered to be at α =0 . 05 or 5%.
III. The average return of the GD stock for the period 01/03/2012 to 31/03/2017 was
considered normally distributed and the test statistic was calculated.
IV. Here, x
¿
=∑ xi
n =93 . 653
60 =1 .561 and the risk or standard deviation was calculated as
s= √ ∑ ( xi−x
¿
)
2
n =4 . 454 .
The test statistic was
t= x
¿
−μ
s / √ n ~ N ( 0,1 ) and the statistic was calculated as,
t obs= x
¿
−μ
s / √ n = 1. 561−2 .8
4 . 454 / √ 60 =−1 . 239
0 . 575 =−2. 155
Now critical value of the t-statistic at 5% level of significance for two tailed test is
t crit =1. 96 at 59 degrees of freedom. It was observed that tobs=−2 . 155<tcrit =−1. 96
on the left tail at 5% level. The value of the observed or calculated t-value falls in the
critical region in the left tail. The significance value or p-value was evaluated as p-
value = P ( t<−tobs ) + P ¿ ¿
V. Hence, based on the statistical evidence the null hypothesis was rejected and it was
concluded that the average market return from GD stock was considerably different
4
End of preview
Want to access all the pages? Upload your documents or become a member.
Related Documents
Comparison of Boeing Company (BA) and General Dynamics (GD) Stock Prices: Analysis and Findingslg...
|15
|4454
|391
Statistics for Business and Finance Assignmentlg...
|15
|3064
|264
Which Stock Should I Invest In PHUONG THAO BUIlg...
|11
|2540
|64
Statistics for Business: Statistical Inference and Simple Regression Analysislg...
|9
|1819
|319
Stock Returns: Boeing & IBM Analysis Reportlg...
|14
|2616
|155
Statistics of Business and Financelg...
|9
|1388
|439