ISY310 Business Analyses of Data Mining Report
6 Pages1882 Words203 Views
Data Mining and Business Intelligence (ISY310/)
Added on 2020-05-08
ISY310 Business Analyses of Data Mining Report
Data Mining and Business Intelligence (ISY310/)
Added on 2020-05-08
ShareRelated Documents
BUSINESS ANALYSIS REPORT USING WEKA TOOLINTRODUCTIONIn this project, we create a business analysis report, typically a data mining report, on the set of data for the company that is engaged in providing loans to students studying for their degrees in Universities. The tool used to mine the data is the WEKA tool, an open source tool from the University of Waikato, New Zealand. We analyse the different parameters of the data using the tool and make a brief report of the same.Keywords:Business Analysis, WEKA, Data mining, Data AnalysisDATA MINING BASICSData Mining is the process of extracting useful information from a set of data using statistical procedures and techniques that helps us to better understand the data quantitatively as well qualitatively. This helps us make useful decisions regarding the outputs associated with the data, like improving the Business output, reducing necessary costs or resources, efficient manangement tof the processes involved, etc. Data Mining could be classified into broadly two types-Directed, and , Undirected. In Directed Data Mining, we try to predict the outcome of a particular variable vis-a-vis other parameters and factors; whereas in Undirected Data Mining, we try to predict general patterns and interrelationships amongst the variables or quantities. The techniques used to do both these types of analyses are various, amongst them, a few primary and important ones wouldbe, for example, descriptive statistics(Box Plot, Histogram, Bar plot, Scatter plot, Pie chart etc.), Cluster Analysis(k-means clustering, hierarchial clustering), Classification(Nearest Neighbours, Naive-Bayes, Decision trees, Loistic Regression), ANOVA, ANCOVA etc. In this project, we try toperform both types of Data Mining to build useful conclusions.DATA VISUALIZATION AND PREPROCESSINGIn the first step, we look at the data visualization. The WEKA tool (Hall,M., Frank,E., Holmes,G., Reutemann, B.P.P., and Witten, I.H. 2009) plots the scatter matrix for all the 17 attributes against each other which can be seen partially in the below screenshot:Partial plot description in WEKA ToolAs we can see, there are a lot of plots to consider, and some are nominal or categorical variables, thus, the descriptive plotting dosent give us much explanation and description of the data on hand.
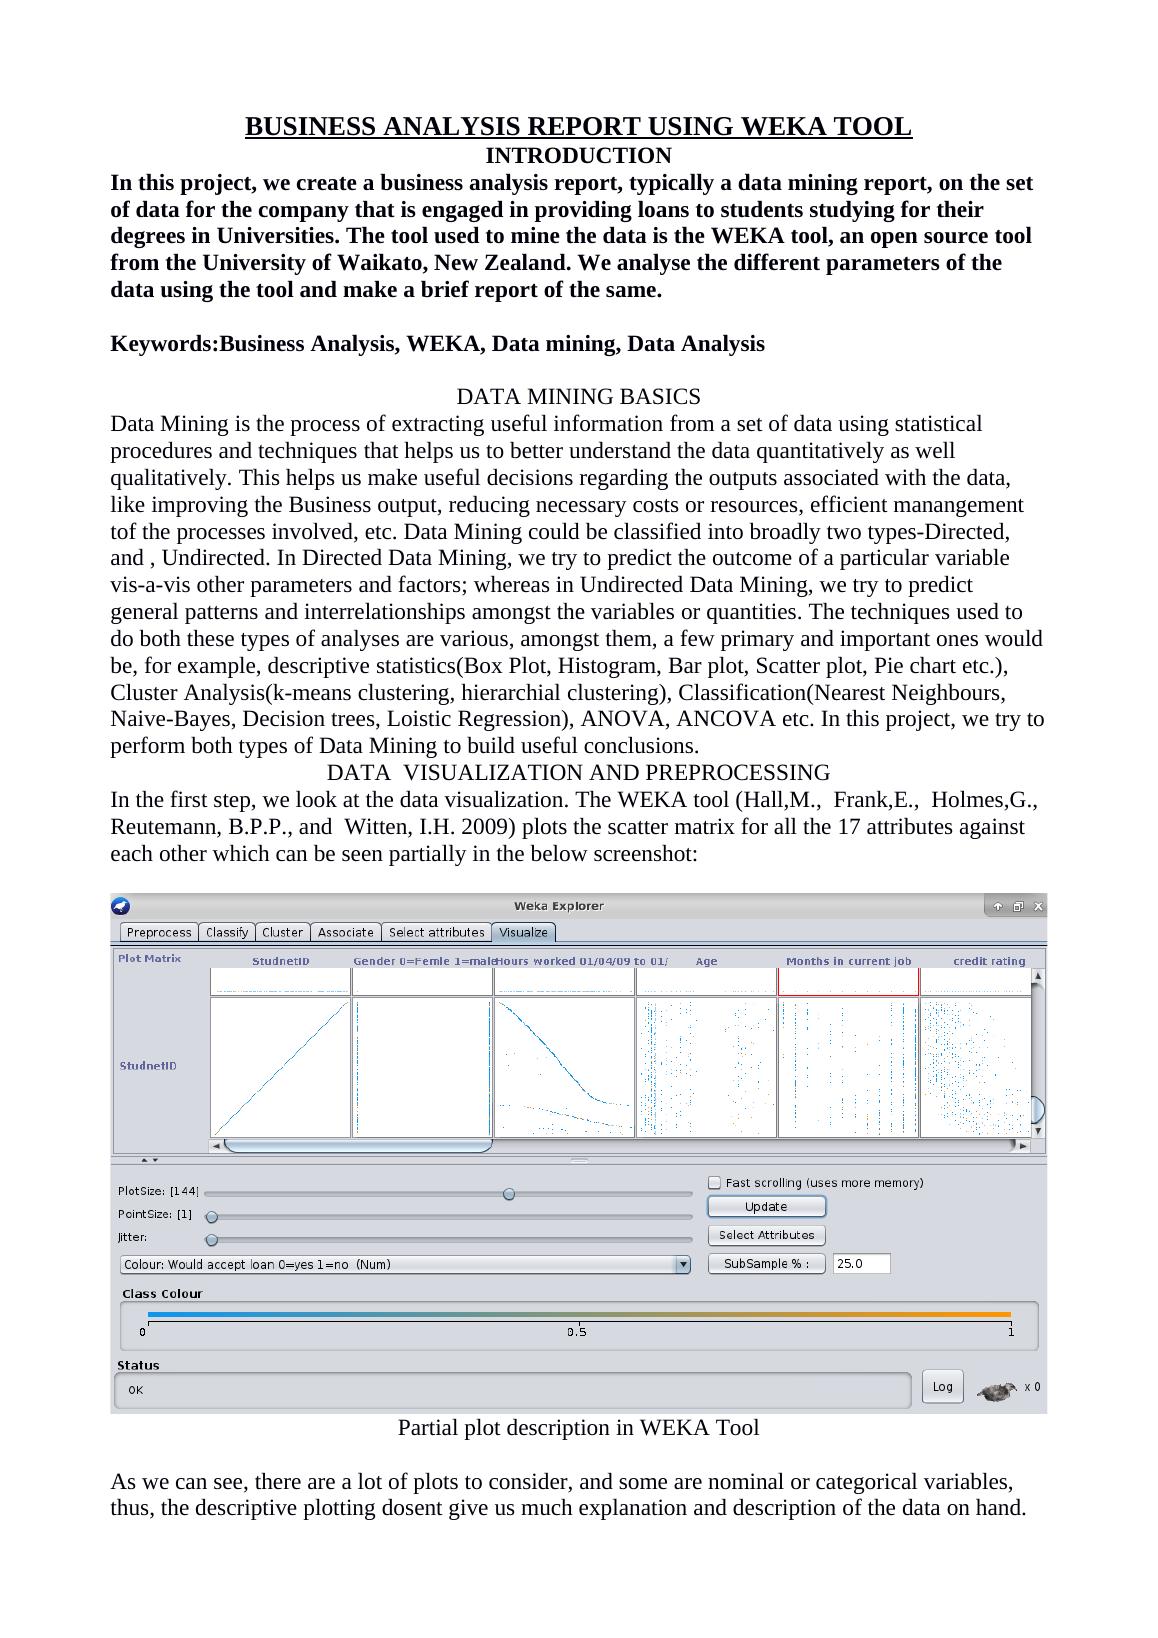
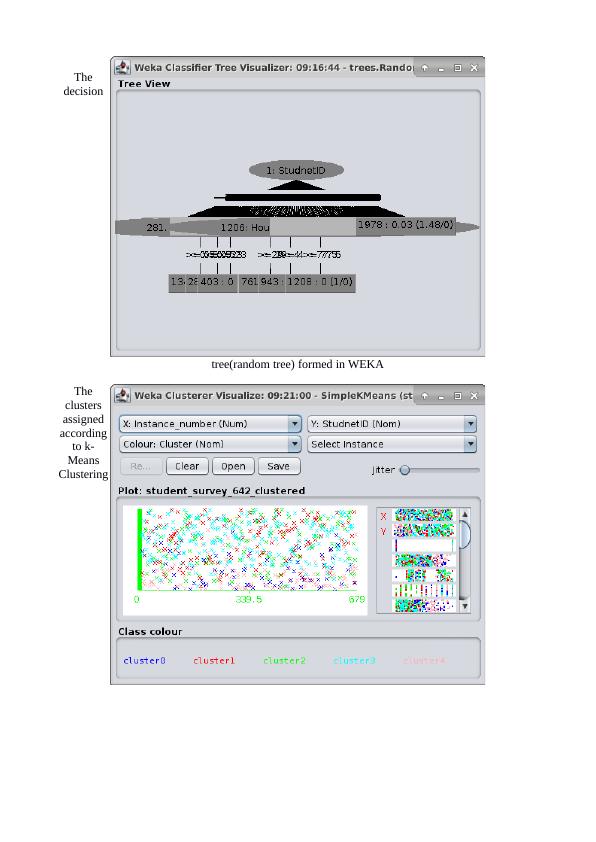
Though it may tell us some dependencies and interrelationships amongst the variables, the description is insufficient to predict anything conclusively for the company. Hence, apriori, we cannot neglect any attribute for further analysis and consider all the attributes for further analysis.CHOOSING A DATA MINING MODEL The process of choosing an appropriate data mining model is very crucial as it is the one main step that decides the effectiveness of the decisions and conclusions made from the data. Among the various classification and mining methods like Linear Regression, Multiple Linear Regression, Logistic Regression, Naive- Bayes Classification, Decision tree modeling, k-Nearest Neighbour Modeling, k-Means Clustering, Principal Component Analysis, four deserve special mention because of their wide applicability in our case and ease of understanding the algorithm.( Abernethy,M.. April 27, 2010), (Deng,H.; Runger, G.; Tuv, E. 2011) The first, and most common used is linear regression. This is the algorithm which does a simple prediction of the value of a dependent variable(numerical) on the basis of the data on independent variable(s).This is useful, in say predicting the price of a typical commodity or the rate of a gadget etc. The next useful data mining technique that desrves mention is the decision tree classification. (Abernethy,M.. May 11, 2010)This algorithm works by creating a tree of dependencies between the various nodes(independent variables) and chooses the best outcome using the greedy algorithm in giving us an estimate for possiblity for the independent variable, which is typically a binary nominal variable.This is useful in say, for example, to decide whether a person would buy a gadget given a data set on the record of customers buying the gadget with respect to their age, gender , qualifications etc. The last two data mining techniques that we would focus on, are k-means Clustering and k-Nearest Neighbours. (Abernethy,M. June 08, 2010). Whereas the former technique is useful in clustering or grouping the data set into useful patterns which help us to predict the most important attributes fromseveral attributes affecting the dependent variable; the latter is a combination of both the classification and clustering, which helps us predict the closeness, or the extent of dependency of a certain group of data with respect to other data. In our present case, since we are intersted in determing wheter a student accepts a loan or not from the comapny, which is categorical variable, therefore we have to go for clustering and/or classification techniques like Decision trees or k-Nearest Neighbours algorithm. We perform all the three analyses, the random tree, k-Means Clustering and k-Nearest Neighbours respectively, and choose the best one according to its errors and outputs for our data set. The linear regression is unsuitable for our purpose, as we are mainly interested in the outcome of the categorical binary variable of the student accepting or rejecting a loan. GENERATING TEST DESIGNIn order to build the model, we split the data into trianing and testing sets with 66% of data into the training set and the remaining into the test dataset. This is performed using WEKA tool’s inbuilt splitting mechanism. Now, we run the decision tree(random tree), k-Means Clustering with k=5 and the k-Nearest Neighbours Algorithm using k=5 on our data set using the WEKA tool and see the outputs. The screenshots of the processes in WEKA are provided below:
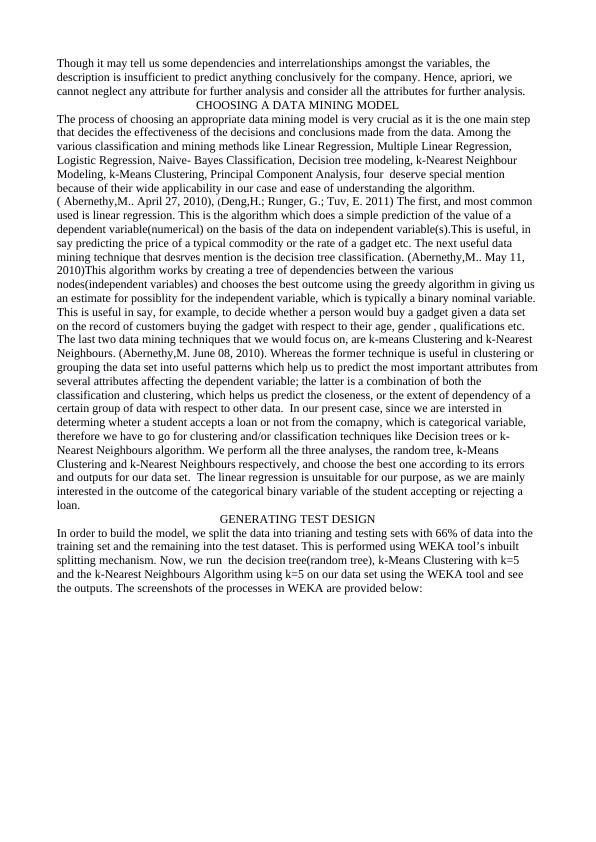
Thedecisiontree(random tree) formed in WEKATheclustersassignedaccordingto k-MeansClustering
End of preview
Want to access all the pages? Upload your documents or become a member.
Related Documents
Data Mining and Visualization: Performance Comparison of Classification Algorithmslg...
|6
|956
|66
Comparative Exploration of KNN, J48 and Lazy IBK Classifiers in Wekalg...
|19
|2887
|140
Object and Data Modellinglg...
|30
|2071
|459
Assignment on Intelligent Systems for Analyticslg...
|47
|6004
|28
Data Mining and Visualization for Business Intelligencelg...
|14
|1554
|444
Data Mining in Wekalg...
|27
|6973
|174