Clinical Research Skills
Added on 2023-01-13
11 Pages1807 Words25 Views
Clinical Research Skills

Table of Contents
TASK ..............................................................................................................................................1
Question 1) SPSS file LBP_Final.sav ........................................................................................1
Question 2) Creating a new variable...........................................................................................1
Question 3) New variable called DIFFERENCE........................................................................1
Question 4) Quality table summarizing the demographic and clinical variables........................1
Question 5) Comments on above calculation..............................................................................2
Question 6. (i) Publication quality bar chart of mean.................................................................2
(ii) Alternative, publication quality plot......................................................................................4
Question 7) Justification for choice of plot ................................................................................4
Question 8) Suitable statistical test.............................................................................................4
Question 9) Assess the relationship between VAS2CAT and GROUP .....................................6
Question 10). Suitable regression model....................................................................................7
Question 11) Statistical methods.................................................................................................8
Question 12) Finding...................................................................................................................8
In this report, analysis of the data for those subjects who returned for the 3-month assessment that is
available in the SPSS file.
TASK
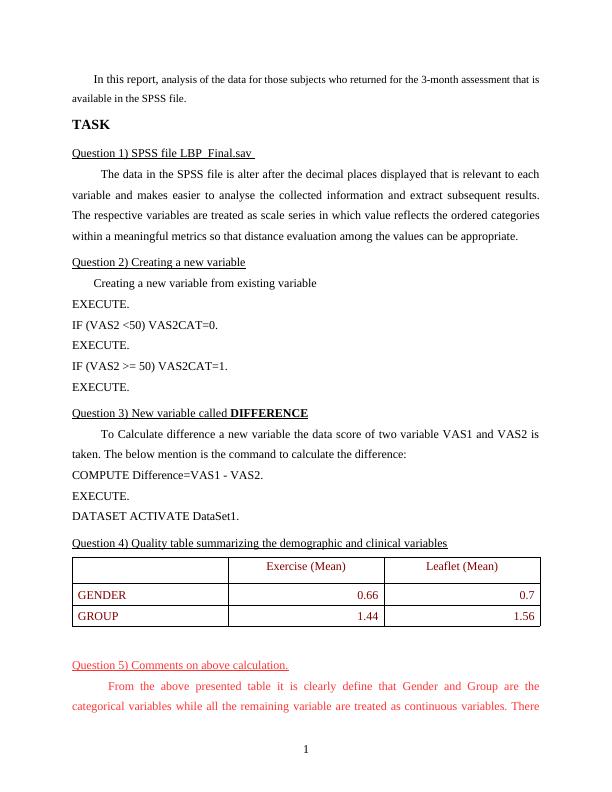
Question 1) SPSS file LBP_Final.sav
The data in the SPSS file is alter after the decimal places displayed that is relevant to each
variable and makes easier to analyse the collected information and extract subsequent results.
The respective variables are treated as scale series in which value reflects the ordered categories
within a meaningful metrics so that distance evaluation among the values can be appropriate.
Question 2) Creating a new variable
Creating a new variable from existing variable
EXECUTE.
IF (VAS2 <50) VAS2CAT=0.
EXECUTE.
IF (VAS2 >= 50) VAS2CAT=1.
EXECUTE.
Question 3) New variable called DIFFERENCE
To Calculate difference a new variable the data score of two variable VAS1 and VAS2 is
taken. The below mention is the command to calculate the difference:
COMPUTE Difference=VAS1 - VAS2.
EXECUTE.
DATASET ACTIVATE DataSet1.
Question 4) Quality table summarizing the demographic and clinical variables
Exercise (Mean) Leaflet (Mean)
GENDER 0.66 0.7
GROUP 1.44 1.56
Question 5) Comments on above calculation.
From the above presented table it is clearly define that Gender and Group are the
categorical variables while all the remaining variable are treated as continuous variables. There
1
available in the SPSS file.
TASK
Question 1) SPSS file LBP_Final.sav
The data in the SPSS file is alter after the decimal places displayed that is relevant to each
variable and makes easier to analyse the collected information and extract subsequent results.
The respective variables are treated as scale series in which value reflects the ordered categories
within a meaningful metrics so that distance evaluation among the values can be appropriate.
Question 2) Creating a new variable
Creating a new variable from existing variable
EXECUTE.
IF (VAS2 <50) VAS2CAT=0.
EXECUTE.
IF (VAS2 >= 50) VAS2CAT=1.
EXECUTE.
Question 3) New variable called DIFFERENCE
To Calculate difference a new variable the data score of two variable VAS1 and VAS2 is
taken. The below mention is the command to calculate the difference:
COMPUTE Difference=VAS1 - VAS2.
EXECUTE.
DATASET ACTIVATE DataSet1.
Question 4) Quality table summarizing the demographic and clinical variables
Exercise (Mean) Leaflet (Mean)
GENDER 0.66 0.7
GROUP 1.44 1.56
Question 5) Comments on above calculation.
From the above presented table it is clearly define that Gender and Group are the
categorical variables while all the remaining variable are treated as continuous variables. There
1
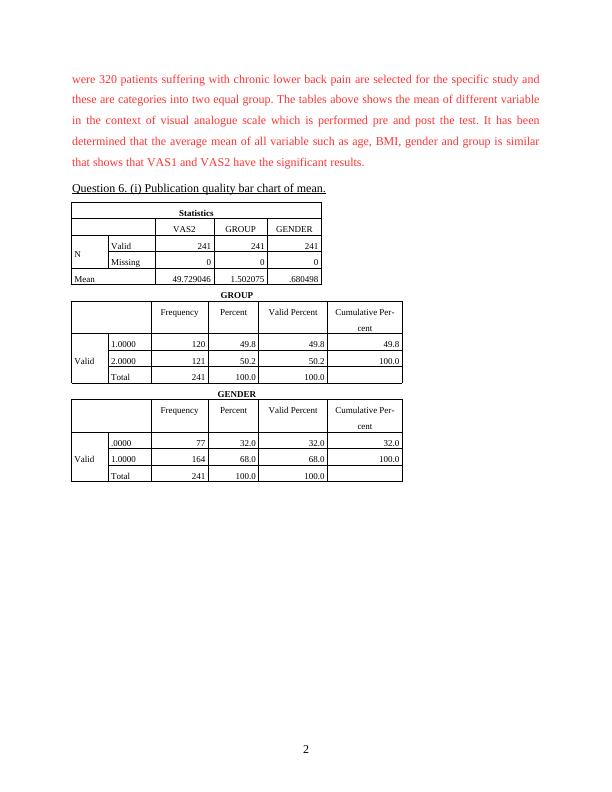
were 320 patients suffering with chronic lower back pain are selected for the specific study and
these are categories into two equal group. The tables above shows the mean of different variable
in the context of visual analogue scale which is performed pre and post the test. It has been
determined that the average mean of all variable such as age, BMI, gender and group is similar
that shows that VAS1 and VAS2 have the significant results.
Question 6. (i) Publication quality bar chart of mean.
Statistics
VAS2 GROUP GENDER
N Valid 241 241 241
Missing 0 0 0
Mean 49.729046 1.502075 .680498
GROUP
Frequency Percent Valid Percent Cumulative Per-
cent
Valid
1.0000 120 49.8 49.8 49.8
2.0000 121 50.2 50.2 100.0
Total 241 100.0 100.0
GENDER
Frequency Percent Valid Percent Cumulative Per-
cent
Valid
.0000 77 32.0 32.0 32.0
1.0000 164 68.0 68.0 100.0
Total 241 100.0 100.0
2
End of preview
Want to access all the pages? Upload your documents or become a member.
Related Documents
Applied Business Research: Data Analysis, Descriptive Statistics, and Correlation Matrixlg...
|21
|3914
|42
Statistical Analysis of Sexual Health: A Case Studylg...
|33
|4139
|410
Analysis of the participants' data incorporated by SPSSlg...
|19
|6803
|499
Basic Data Analysis for Quantitative Research using SPSS and Deli Depot databaselg...
|7
|1609
|392
(PDF) Data Analysis in Management with SPSS Softwarelg...
|22
|4907
|368