Impact of Hot Coffee on Blood Pressure of Humans
VerifiedAdded on 2023/06/03
|47
|5531
|107
AI Summary
The academic attempted to evaluate the effect of coffee consumption on blood pressure in humans. The researcher selected controlled studies in which coffee consumption was the only difference between the intervention group and the control group. The change in blood pressure was reported for each group or period and the treatment lasted 12 hours.
Contribute Materials
Your contribution can guide someone’s learning journey. Share your
documents today.
Impact of Hot Coffee on Blood Pressure of Humans
1
1
Secure Best Marks with AI Grader
Need help grading? Try our AI Grader for instant feedback on your assignments.
Abstract
The academic attempted to evaluate the effect of coffee consumption on blood pressure in
humans. The researcher selected controlled studies in which coffee consumption was the only
difference between the intervention group and the control group. The change in blood pressure
was reported for each group or period and the treatment lasted 12 hours. The mean systolic and
diastolic blood pressures were 124.4 mm Hg (SD = 12.05) and 79.64 mm Hg (SD = 7.44,
respectively). For coffee treatment, systolic and diastolic blood pressures increased by 124.58
mm Hg (SD = 7.52) and 80.12 mm Hg (SD = 7.59) respectively. Linear regression analysis
revealed a positive relationship between pre- and post-systolic blood pressure and diastolic blood
pressure, regardless of the age of the study participants. The effect of coffee consumption on
systolic and diastolic blood pressure was found to be not significant in the present work. The
research could not confirm a link between coffee consumption and high blood pressure.
2
Table of Contents
Abstract.......................................................................................................................................................2
Introduction.................................................................................................................................................4
Research Methodology................................................................................................................................5
Participants..............................................................................................................................................5
Design......................................................................................................................................................6
Method....................................................................................................................................................6
Results.........................................................................................................................................................7
Descriptive Analysis.................................................................................................................................7
Inferential Analysis................................................................................................................................12
Discussion..................................................................................................................................................15
References.................................................................................................................................................17
Appendices (Raw SPSS outputs)................................................................................................................19
3
Introduction
It's been a long time since the problem could have a negative impact on the cardiovascular
system. Some transversal studies have shown a positive trend in coffee consumption and blood
pressure. At least one prospective study involved increased blood pressure. However, inferences
should be cautious about causality due to other factors arising from observational studies.
Experimental studies are the best way to determine if there is a relationship and it is an
intervention, relevant therapeutic effect of coffee was researched by Lopez-Garcia et al [1].
However, most of these studies were small and could not deliver results to the final, to find the
effect of coffee on the subject and whether drinking amount is controversial [2, 3]. The
combination of clinical trial in the present work allows for the investigation of the results of
gender and age of the participants [4]. In this context, the scholar presented the results of a meta-
analysis of 50 clinical studies on the impact of coffee. The present research scrutinized the effect
of coffee on participants by investigating two following hypotheses.
i. H0: Coffee drinking does not have any significant impact on Systolic blood pressure.
HA: Coffee drinking has significant impact on Systolic blood pressure.
ii. H0: Coffee drinking does not have any significant impact on Diastolic blood pressure.
HA: Coffee drinking has significant impact on Diastolic blood pressure.
4
Secure Best Marks with AI Grader
Need help grading? Try our AI Grader for instant feedback on your assignments.
iii. H0: Age of the participants and difference in Diastolic blood pressure do not impact the
change in Systolic blood pressure.
HA: Age of the participants and difference in Diastolic blood pressure significantly
impact the change in Systolic blood pressure.
iv. H0: Gender of the participants and difference in Diastolic blood pressure do not impact
the change in Systolic blood pressure.
HA: Gender of the participants and difference in Diastolic blood pressure significantly
impact the change in Systolic blood pressure.
Research Methodology
Participants
The scholar advertised the research plan in the University notice board. A pre-formatted form
with information fields on biological vitals were circulated to the enrolled applicants through
emails. Finally, the participants were selected from total 89 applicants. Applicants with high or
low blood pressure were excluded from the study. The scholar also tracked the profile of the
applicants and excluded alcohol or substance addicted candidates. At last, 50 participants were
selected with average systolic and diastolic blood pressures as 124.4 mm Hg (SD = 12.05) and
79.64 mm Hg (SD = 7.44). Average age of the participants was 25.36 years (SD = 7.03), where
females were aged between 19 – 62 years (N = 23, M = 26.78, SD = 9.13), and males were aged
between 14 – 38 years (N = 27, M = 24.15, SD = 4.38).
5
Design
Experiment was introduced after signing of a university approved ethics form. Information about
age, gender, primary blood pressure, coffee consumption, coffee volume, and final blood
pressure were recorded. Each participant drank a 250 ml hot coffee, and after 3 minutes blood
pressure was recorded.
Method
A quantitative analysis of pre and post coffee administration blood pressures by paired t-test was
done in SPSS 20 software. The initial blood pressures were considered as control measures,
whereas post coffee drinking blood pressures were considered as experimental measures.
Correlation between the Systolic and Diastolic pressures was evaluated with linear regression
model describing the structure of the relation.
6
Results
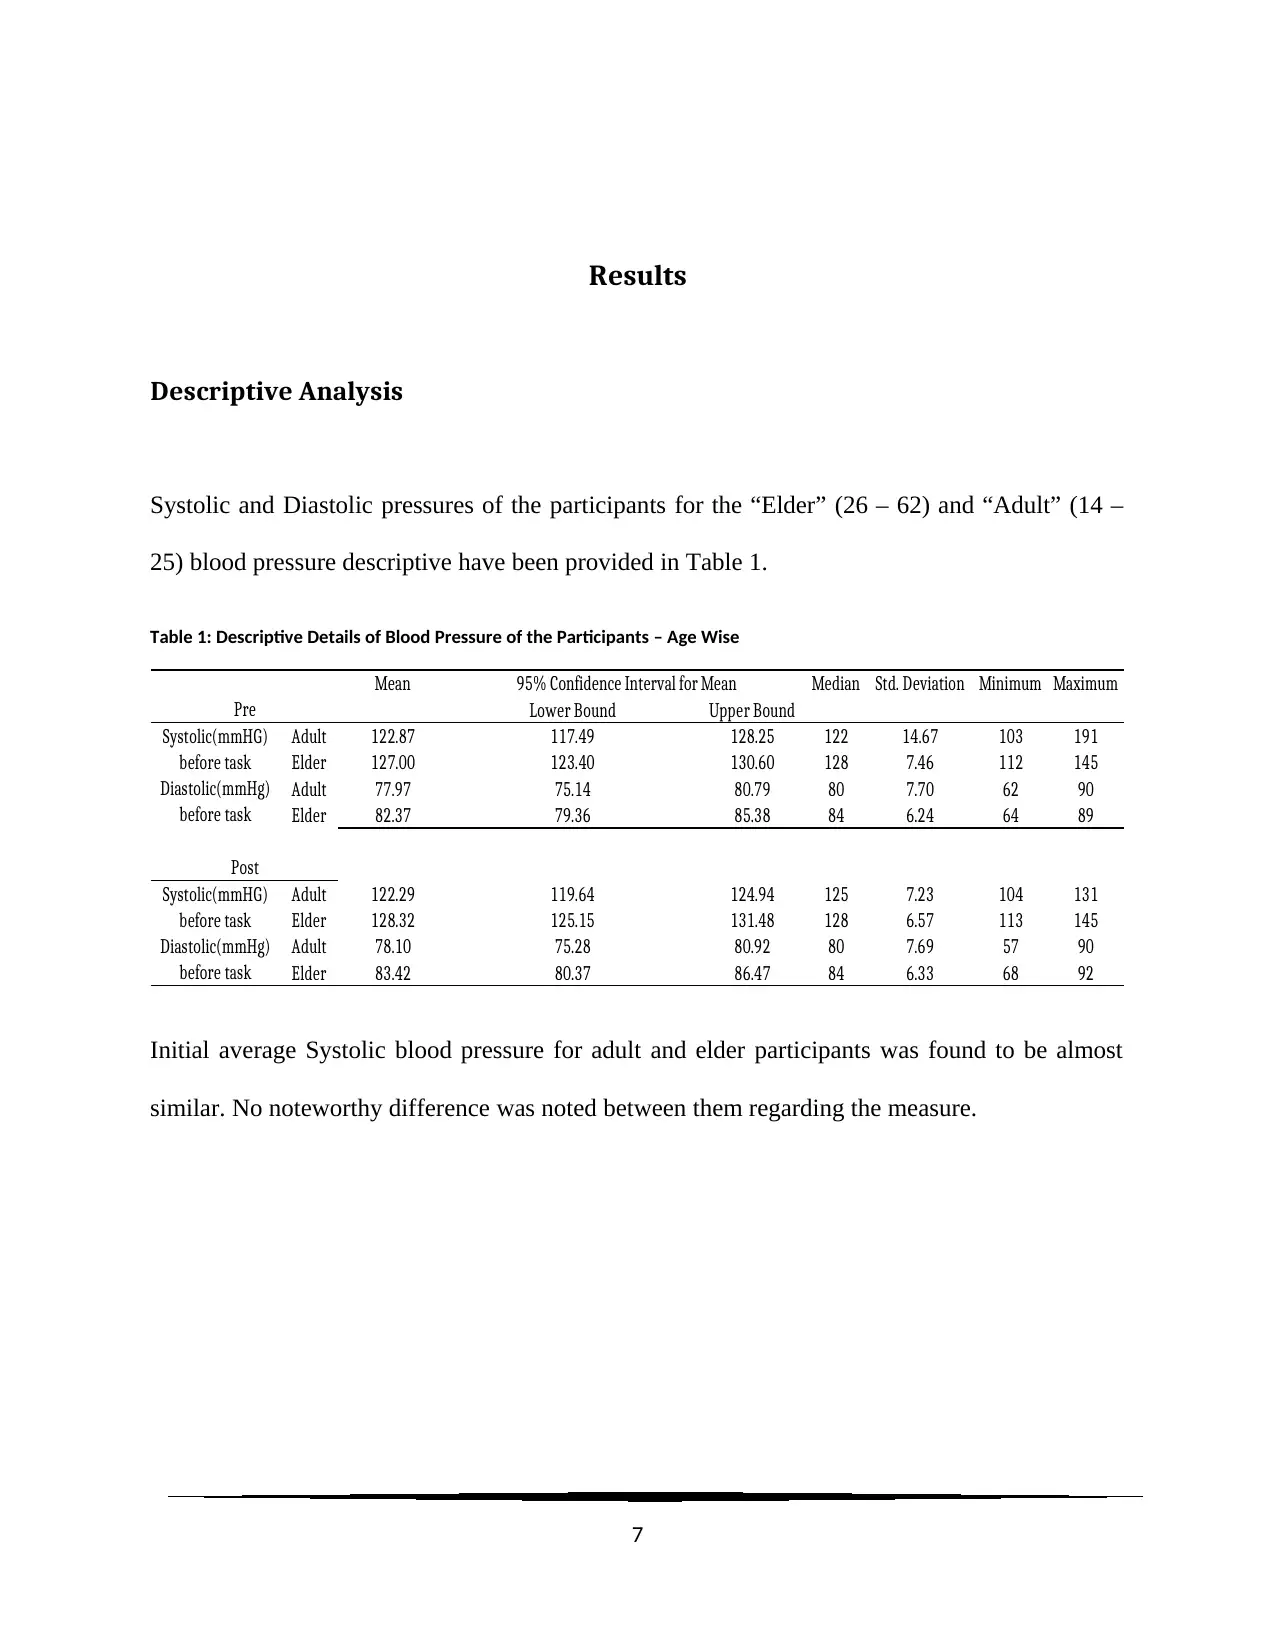
Descriptive Analysis
Systolic and Diastolic pressures of the participants for the “Elder” (26 – 62) and “Adult” (14 –
25) blood pressure descriptive have been provided in Table 1.
Table 1: Descriptive Details of Blood Pressure of the Participants – Age Wise
Mean Median Std. Deviation Minimum Maximum
Lower Bound Upper Bound
Adult 122.87 117.49 128.25 122 14.67 103 191
Elder 127.00 123.40 130.60 128 7.46 112 145
Adult 77.97 75.14 80.79 80 7.70 62 90
Elder 82.37 79.36 85.38 84 6.24 64 89
Adult 122.29 119.64 124.94 125 7.23 104 131
Elder 128.32 125.15 131.48 128 6.57 113 145
Adult 78.10 75.28 80.92 80 7.69 57 90
Elder 83.42 80.37 86.47 84 6.33 68 92
Systolic(mmHG)
before task
Diastolic(mmHg)
before task
95% Confidence Interval for Mean
Pre
Systolic(mmHG)
before task
Diastolic(mmHg)
before task
Post
Initial average Systolic blood pressure for adult and elder participants was found to be almost
similar. No noteworthy difference was noted between them regarding the measure.
7
Paraphrase This Document
Need a fresh take? Get an instant paraphrase of this document with our AI Paraphraser
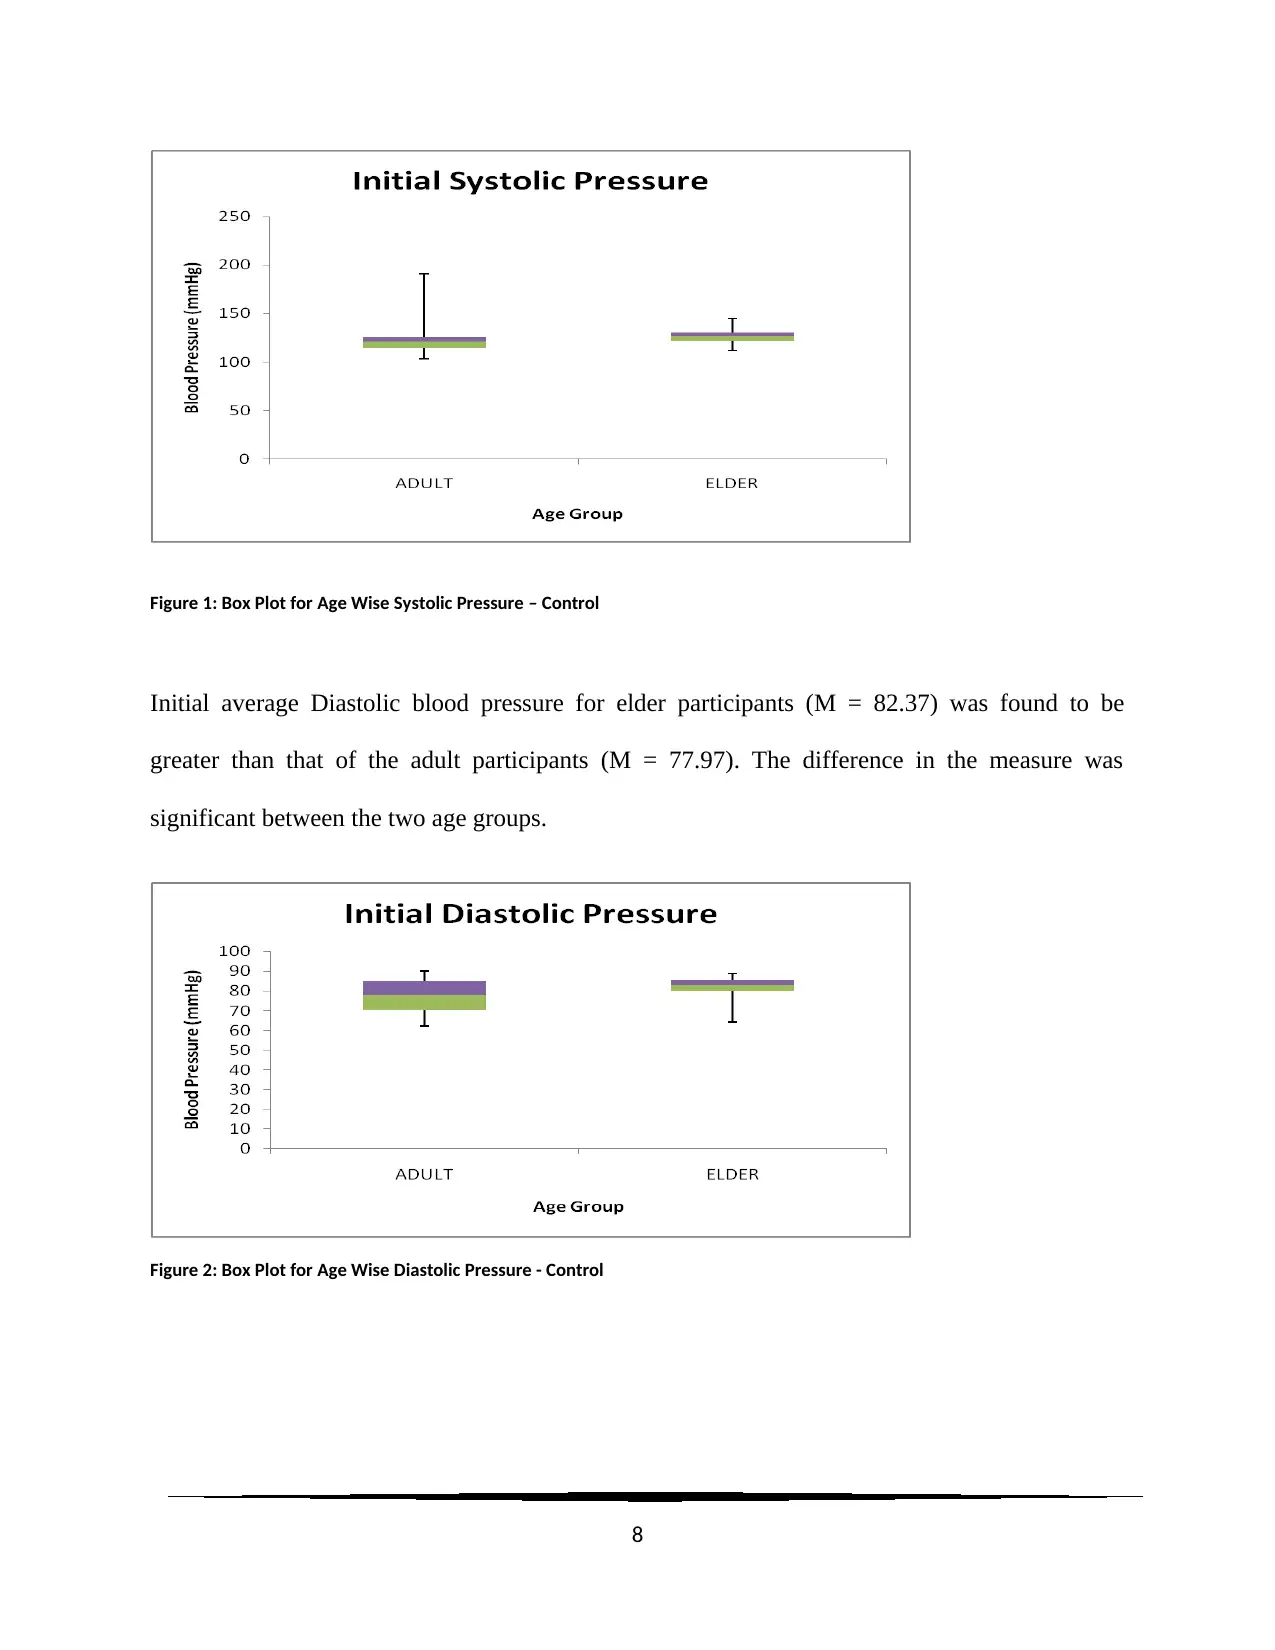
Figure 1: Box Plot for Age Wise Systolic Pressure – Control
Initial average Diastolic blood pressure for elder participants (M = 82.37) was found to be
greater than that of the adult participants (M = 77.97). The difference in the measure was
significant between the two age groups.
Figure 2: Box Plot for Age Wise Diastolic Pressure - Control
8
Initial average Diastolic blood pressure for elder participants (M = 82.37) was found to be
greater than that of the adult participants (M = 77.97). The difference in the measure was
significant between the two age groups.
Figure 2: Box Plot for Age Wise Diastolic Pressure - Control
8
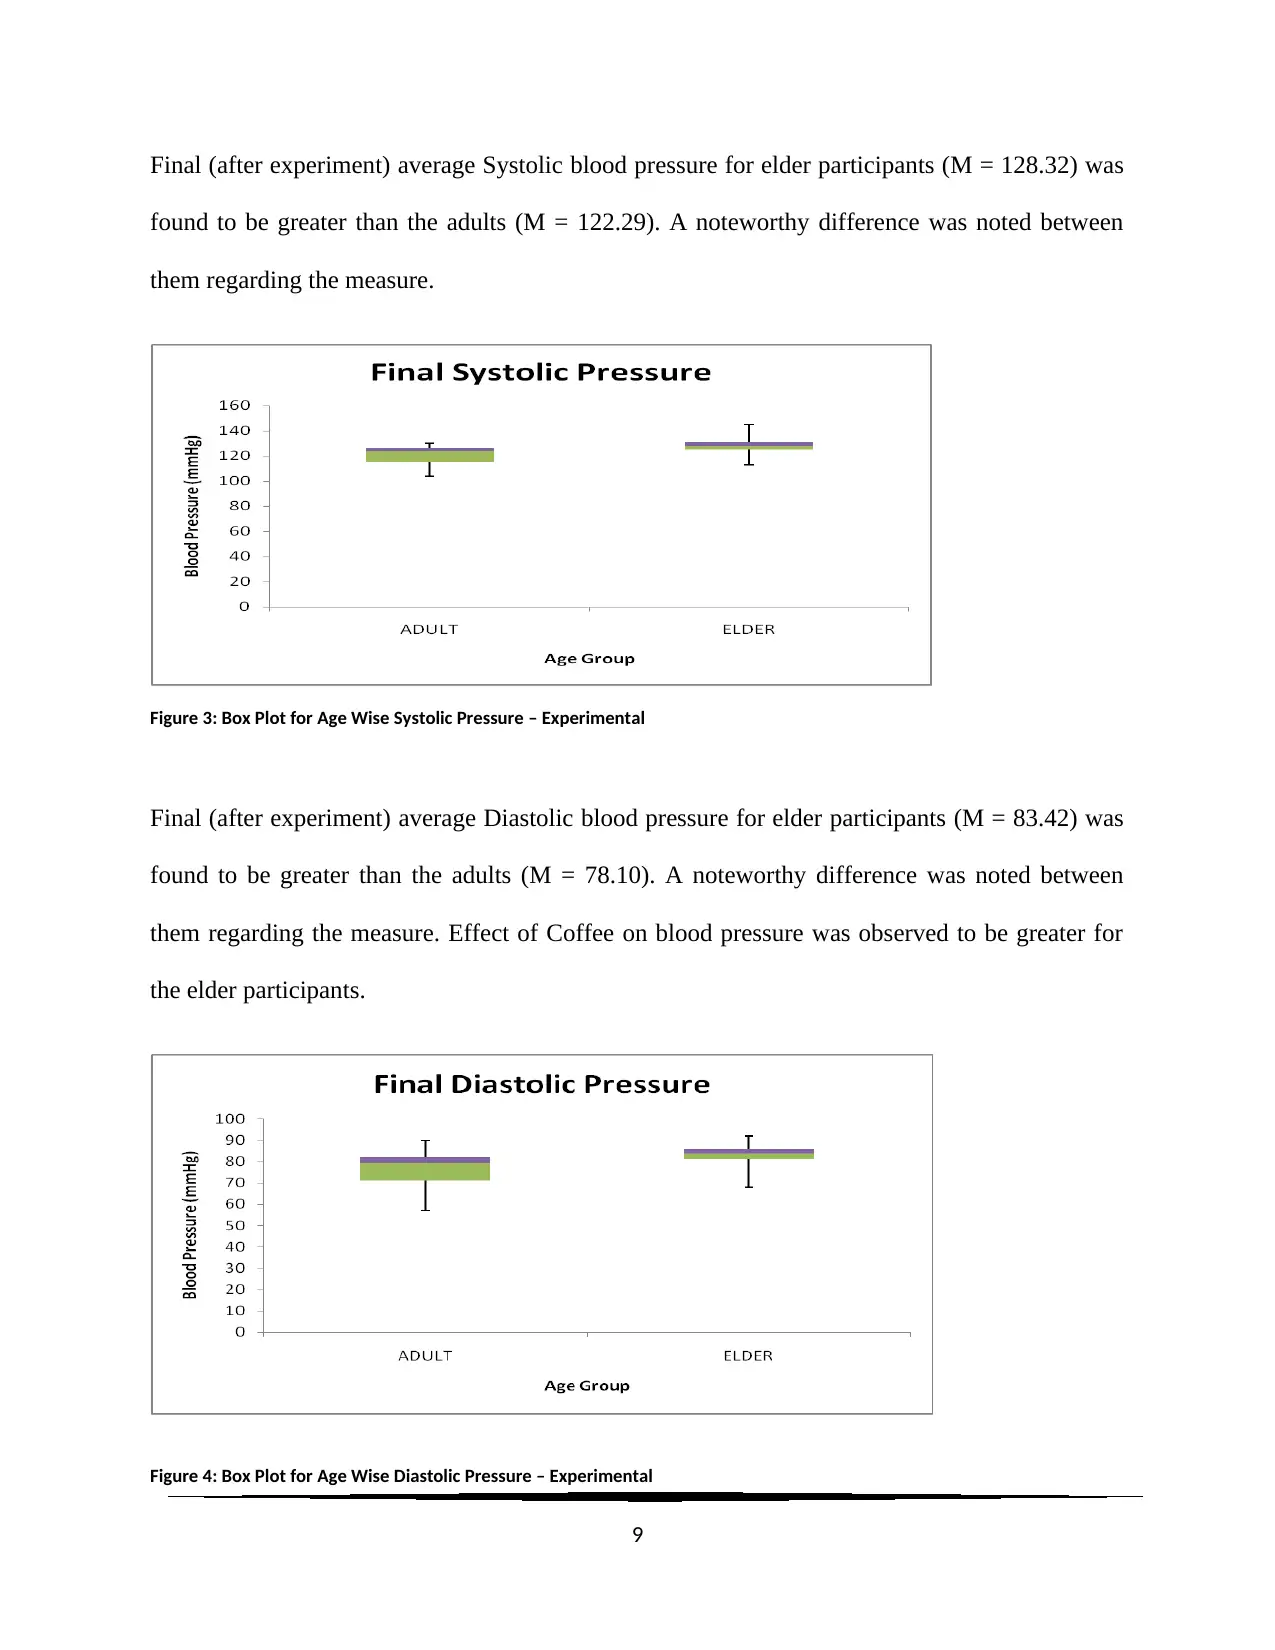
Final (after experiment) average Systolic blood pressure for elder participants (M = 128.32) was
found to be greater than the adults (M = 122.29). A noteworthy difference was noted between
them regarding the measure.
Figure 3: Box Plot for Age Wise Systolic Pressure – Experimental
Final (after experiment) average Diastolic blood pressure for elder participants (M = 83.42) was
found to be greater than the adults (M = 78.10). A noteworthy difference was noted between
them regarding the measure. Effect of Coffee on blood pressure was observed to be greater for
the elder participants.
Figure 4: Box Plot for Age Wise Diastolic Pressure – Experimental
9
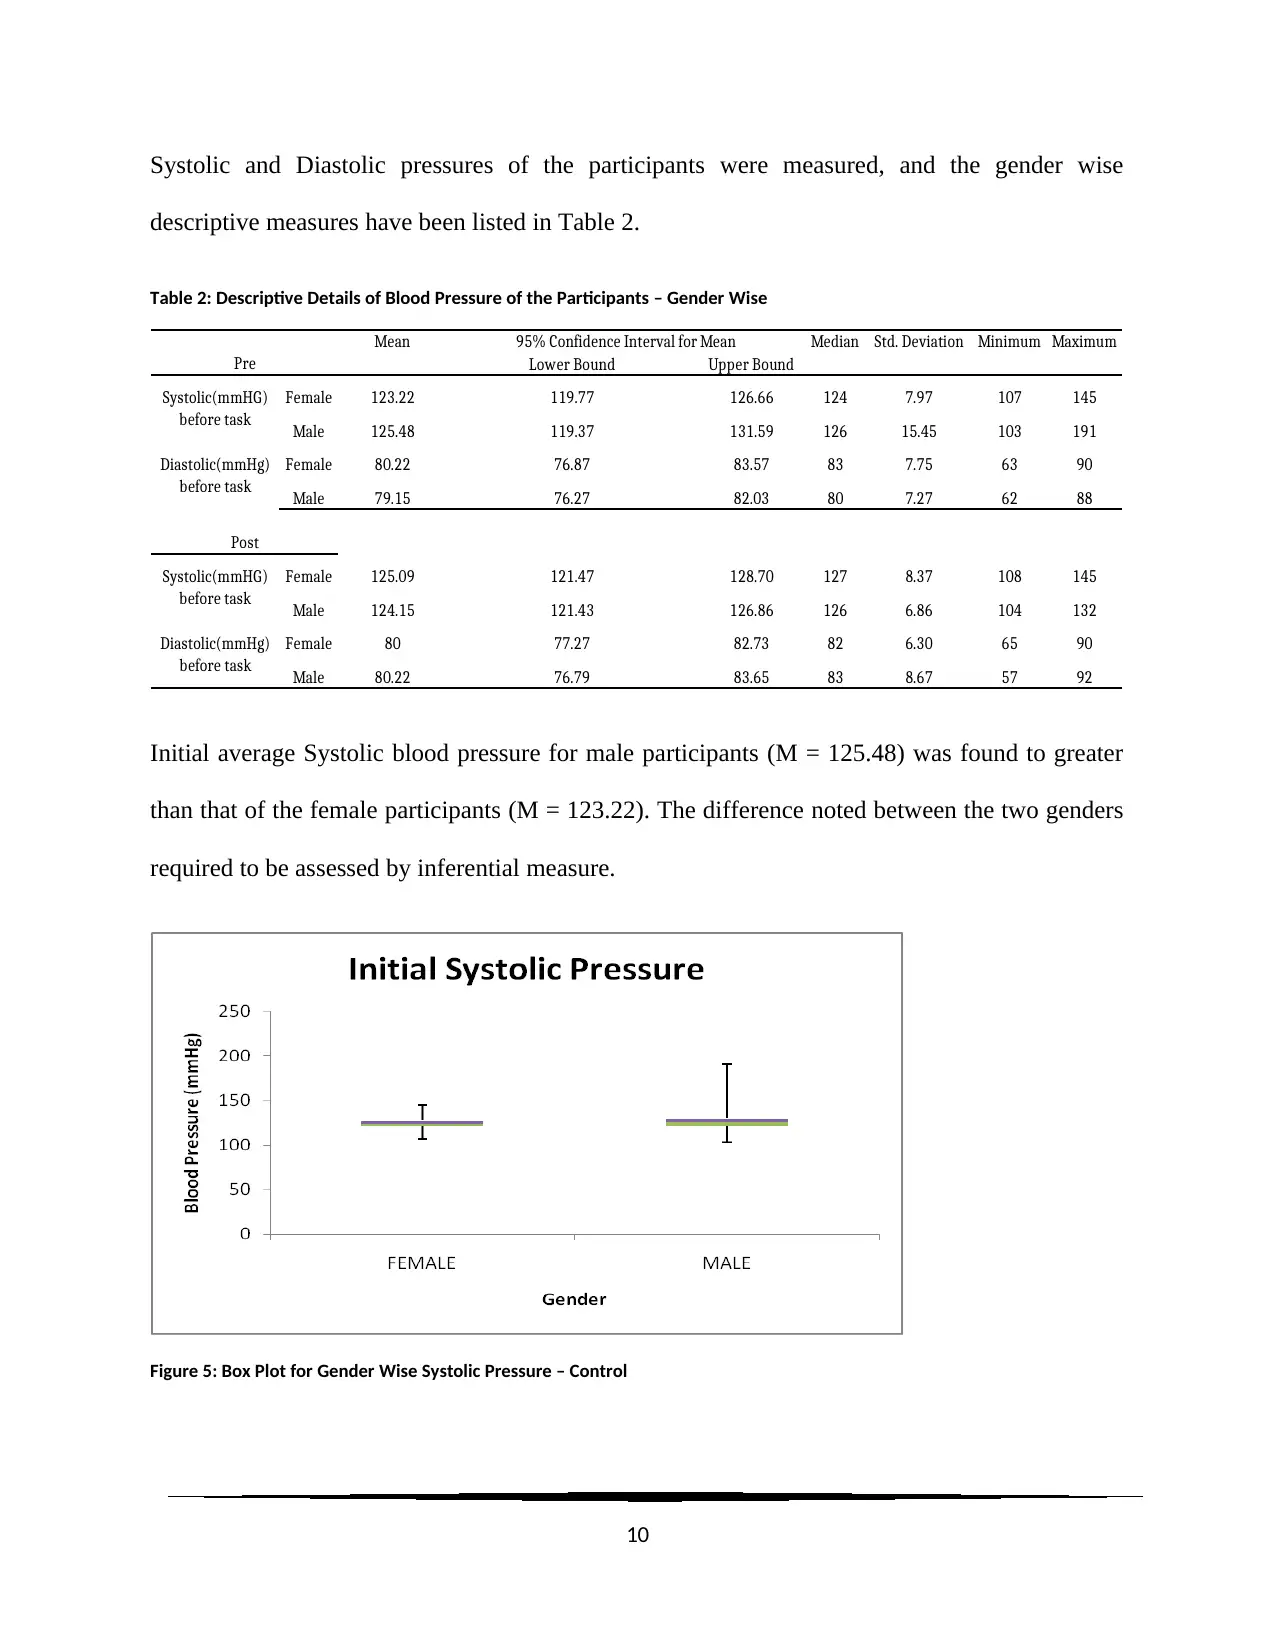
Systolic and Diastolic pressures of the participants were measured, and the gender wise
descriptive measures have been listed in Table 2.
Table 2: Descriptive Details of Blood Pressure of the Participants – Gender Wise
Mean Median Std. Deviation Minimum Maximum
Lower Bound Upper Bound
Female 123.22 119.77 126.66 124 7.97 107 145
Male 125.48 119.37 131.59 126 15.45 103 191
Female 80.22 76.87 83.57 83 7.75 63 90
Male 79.15 76.27 82.03 80 7.27 62 88
Female 125.09 121.47 128.70 127 8.37 108 145
Male 124.15 121.43 126.86 126 6.86 104 132
Female 80 77.27 82.73 82 6.30 65 90
Male 80.22 76.79 83.65 83 8.67 57 92
95% Confidence Interval for Mean
Pre
Post
Diastolic(mmHg)
before task
Systolic(mmHG)
before task
Diastolic(mmHg)
before task
Systolic(mmHG)
before task
Initial average Systolic blood pressure for male participants (M = 125.48) was found to greater
than that of the female participants (M = 123.22). The difference noted between the two genders
required to be assessed by inferential measure.
Figure 5: Box Plot for Gender Wise Systolic Pressure – Control
10
Secure Best Marks with AI Grader
Need help grading? Try our AI Grader for instant feedback on your assignments.
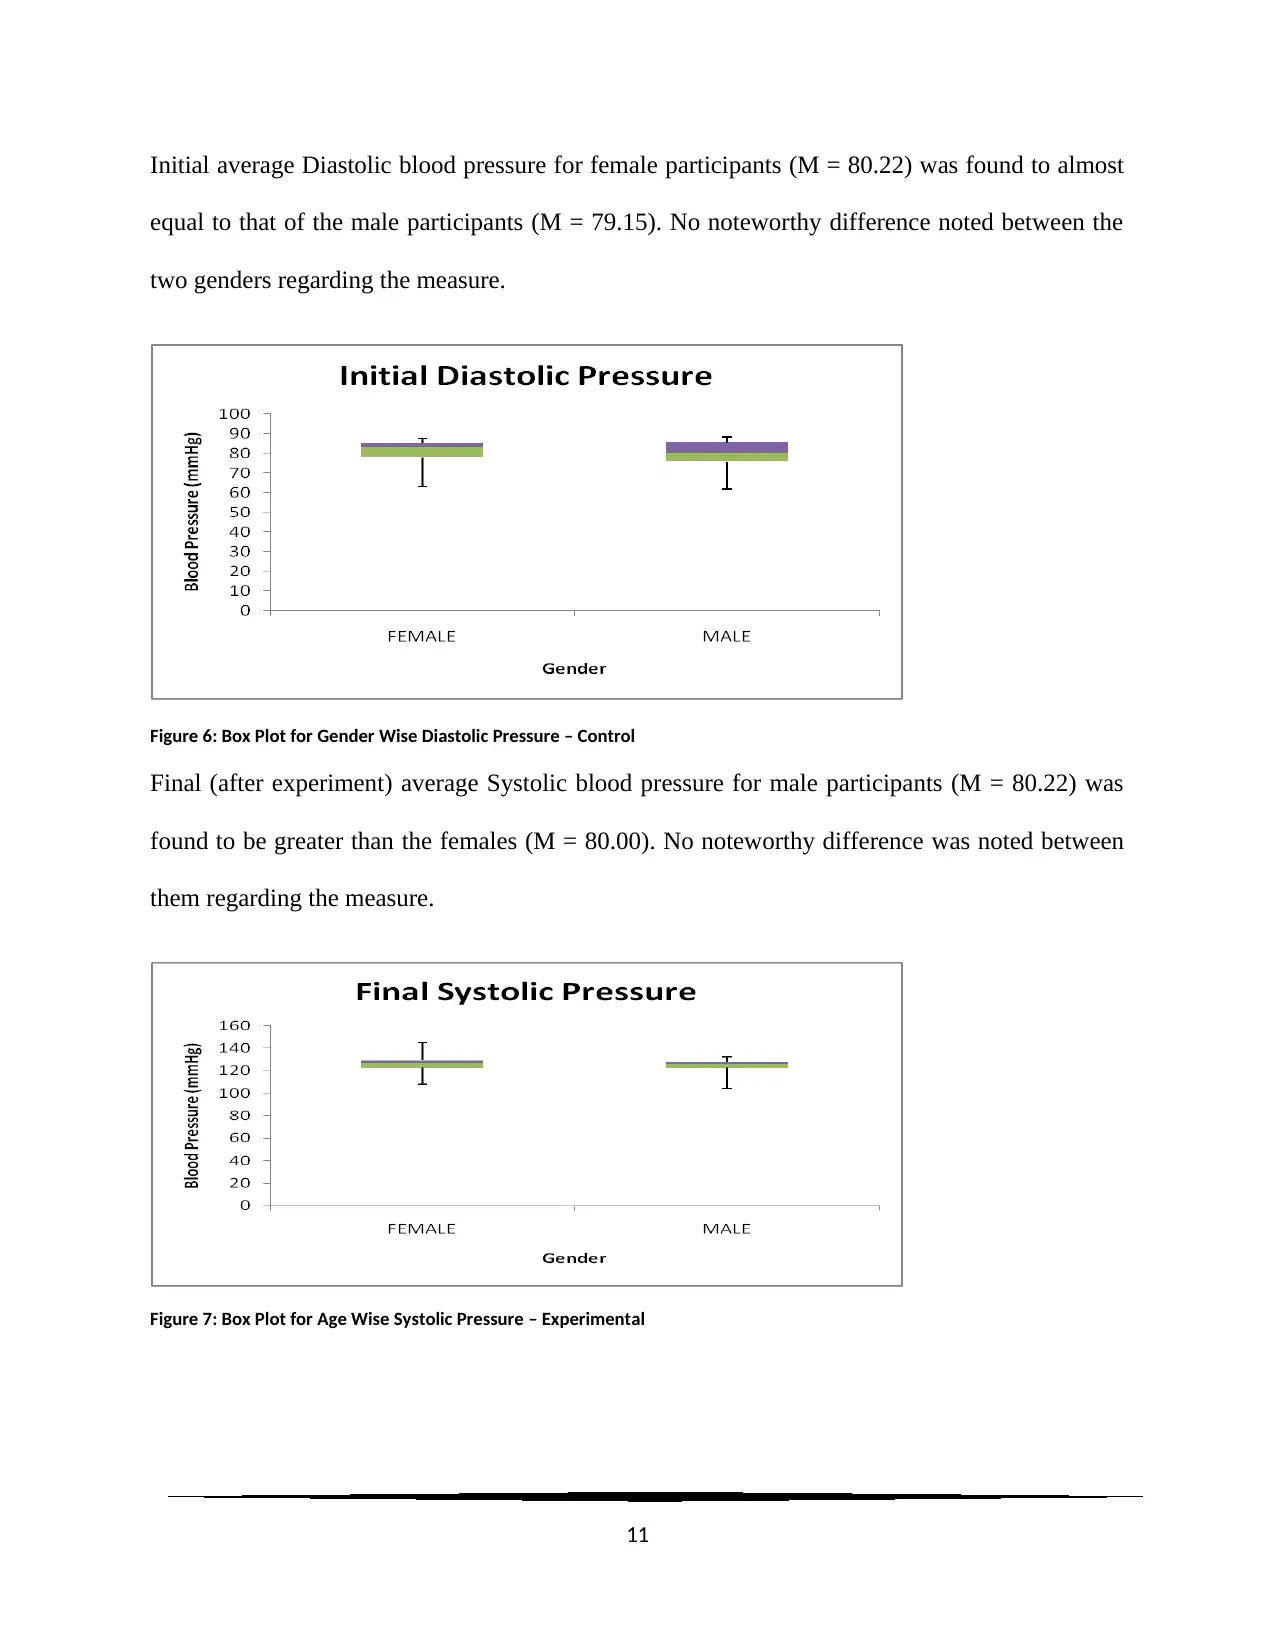
Initial average Diastolic blood pressure for female participants (M = 80.22) was found to almost
equal to that of the male participants (M = 79.15). No noteworthy difference noted between the
two genders regarding the measure.
Figure 6: Box Plot for Gender Wise Diastolic Pressure – Control
Final (after experiment) average Systolic blood pressure for male participants (M = 80.22) was
found to be greater than the females (M = 80.00). No noteworthy difference was noted between
them regarding the measure.
Figure 7: Box Plot for Age Wise Systolic Pressure – Experimental
11
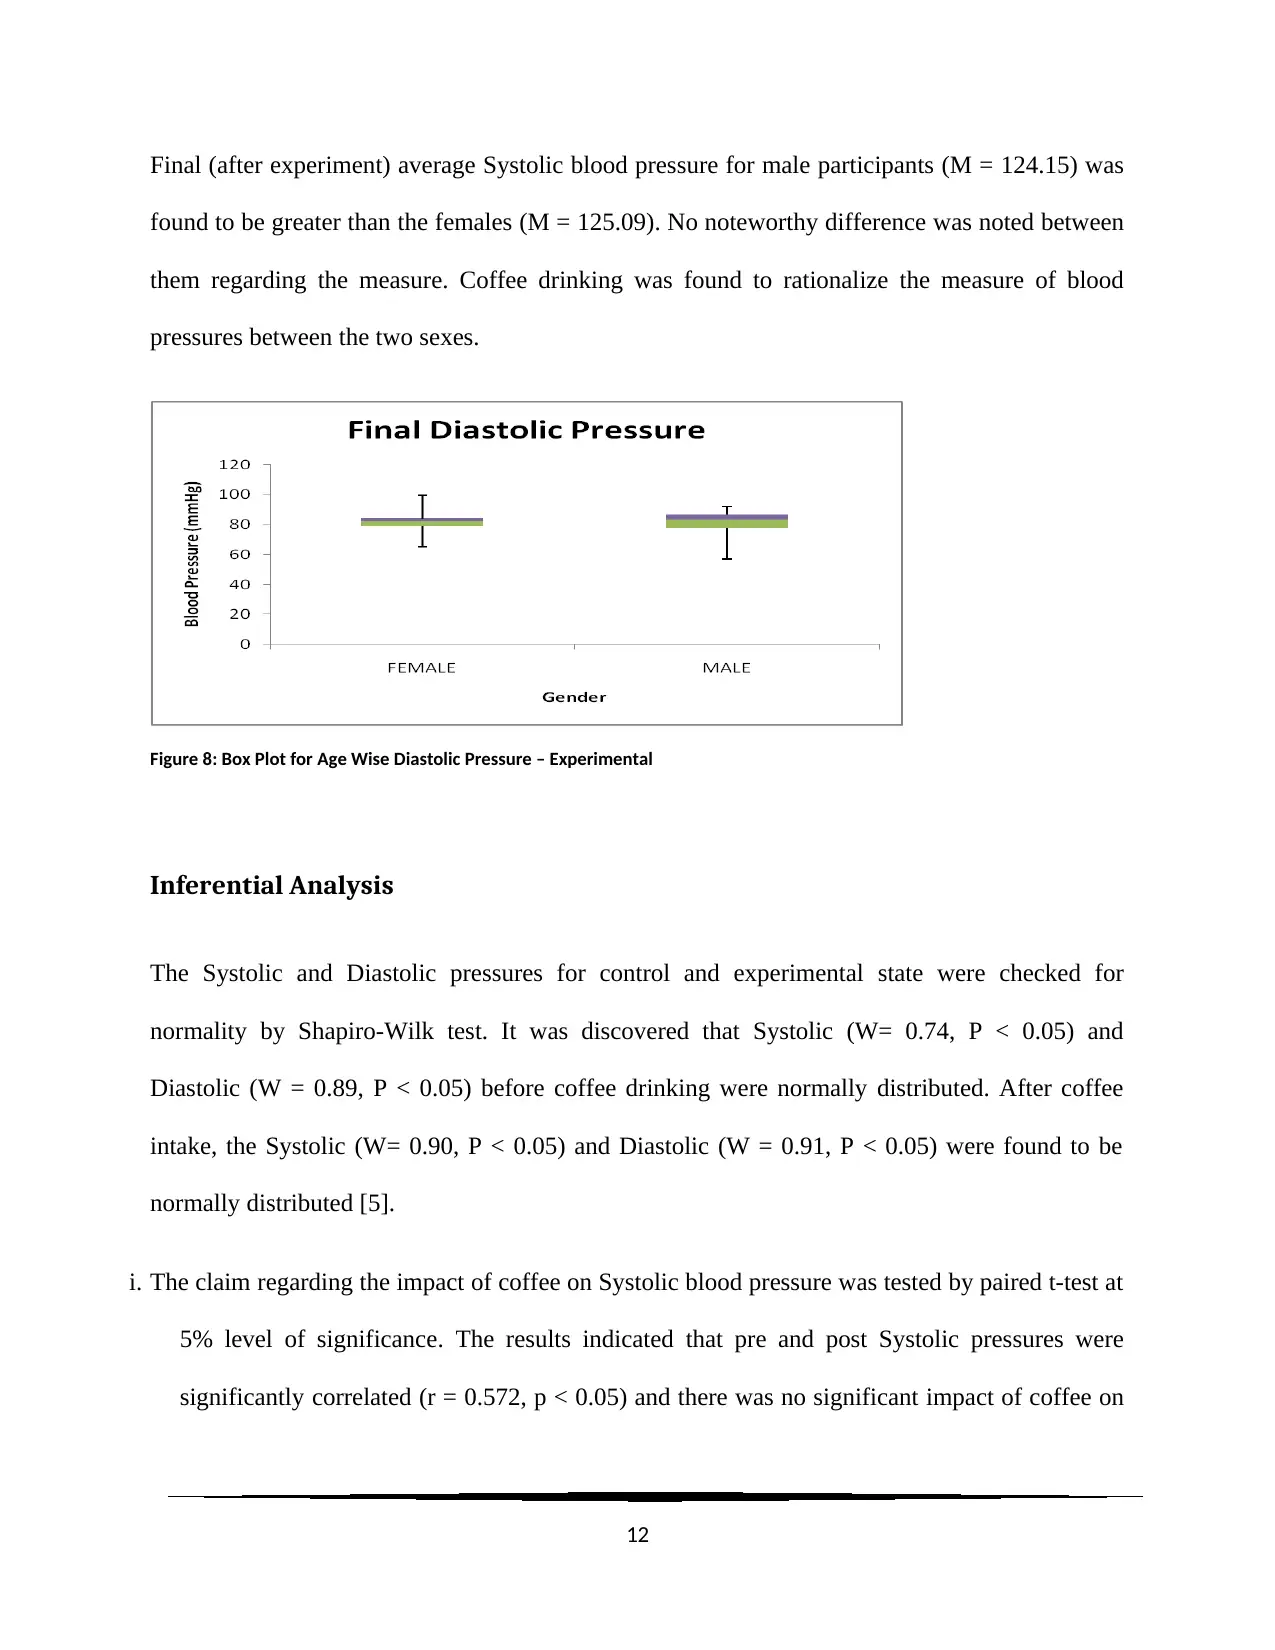
Final (after experiment) average Systolic blood pressure for male participants (M = 124.15) was
found to be greater than the females (M = 125.09). No noteworthy difference was noted between
them regarding the measure. Coffee drinking was found to rationalize the measure of blood
pressures between the two sexes.
Figure 8: Box Plot for Age Wise Diastolic Pressure – Experimental
Inferential Analysis
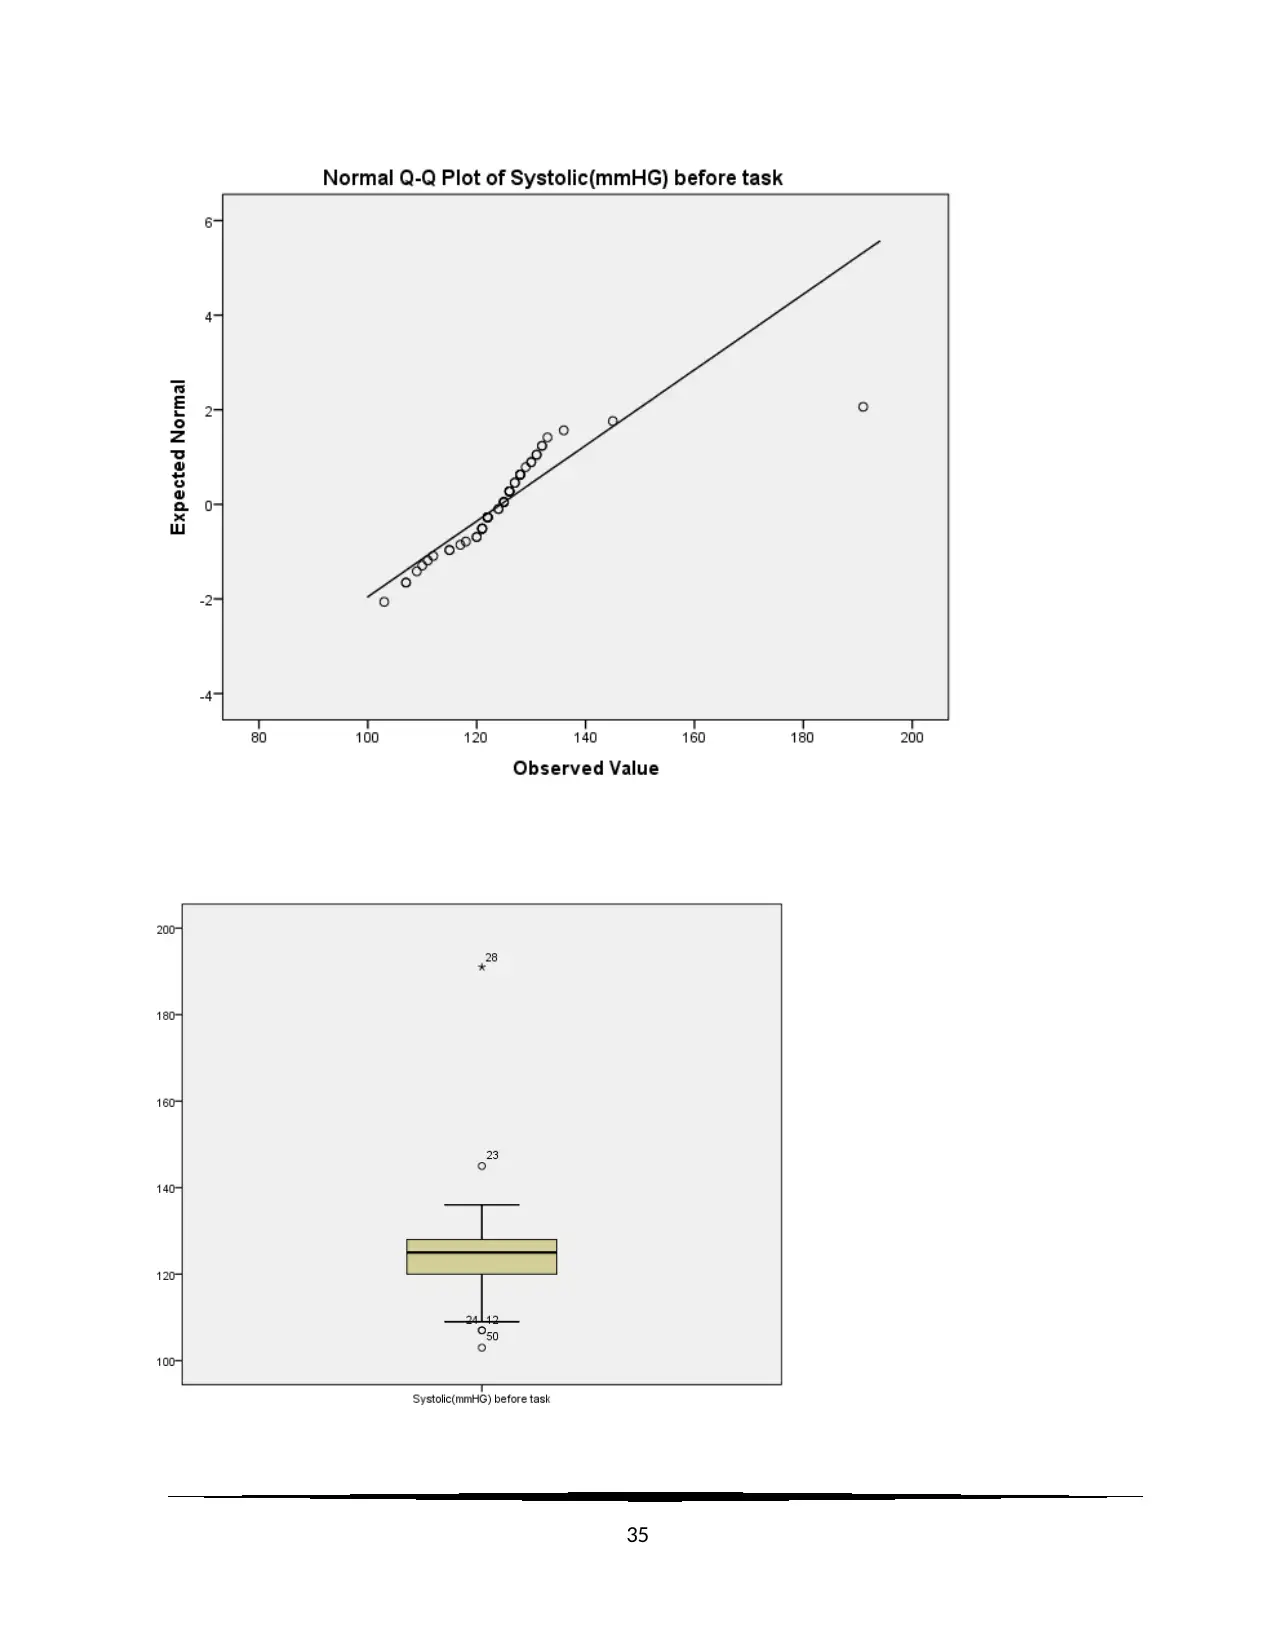
The Systolic and Diastolic pressures for control and experimental state were checked for
normality by Shapiro-Wilk test. It was discovered that Systolic (W= 0.74, P < 0.05) and
Diastolic (W = 0.89, P < 0.05) before coffee drinking were normally distributed. After coffee
intake, the Systolic (W= 0.90, P < 0.05) and Diastolic (W = 0.91, P < 0.05) were found to be
normally distributed [5].
i. The claim regarding the impact of coffee on Systolic blood pressure was tested by paired t-test at
5% level of significance. The results indicated that pre and post Systolic pressures were
significantly correlated (r = 0.572, p < 0.05) and there was no significant impact of coffee on
12
found to be greater than the females (M = 125.09). No noteworthy difference was noted between
them regarding the measure. Coffee drinking was found to rationalize the measure of blood
pressures between the two sexes.
Figure 8: Box Plot for Age Wise Diastolic Pressure – Experimental
Inferential Analysis
The Systolic and Diastolic pressures for control and experimental state were checked for
normality by Shapiro-Wilk test. It was discovered that Systolic (W= 0.74, P < 0.05) and
Diastolic (W = 0.89, P < 0.05) before coffee drinking were normally distributed. After coffee
intake, the Systolic (W= 0.90, P < 0.05) and Diastolic (W = 0.91, P < 0.05) were found to be
normally distributed [5].
i. The claim regarding the impact of coffee on Systolic blood pressure was tested by paired t-test at
5% level of significance. The results indicated that pre and post Systolic pressures were
significantly correlated (r = 0.572, p < 0.05) and there was no significant impact of coffee on
12
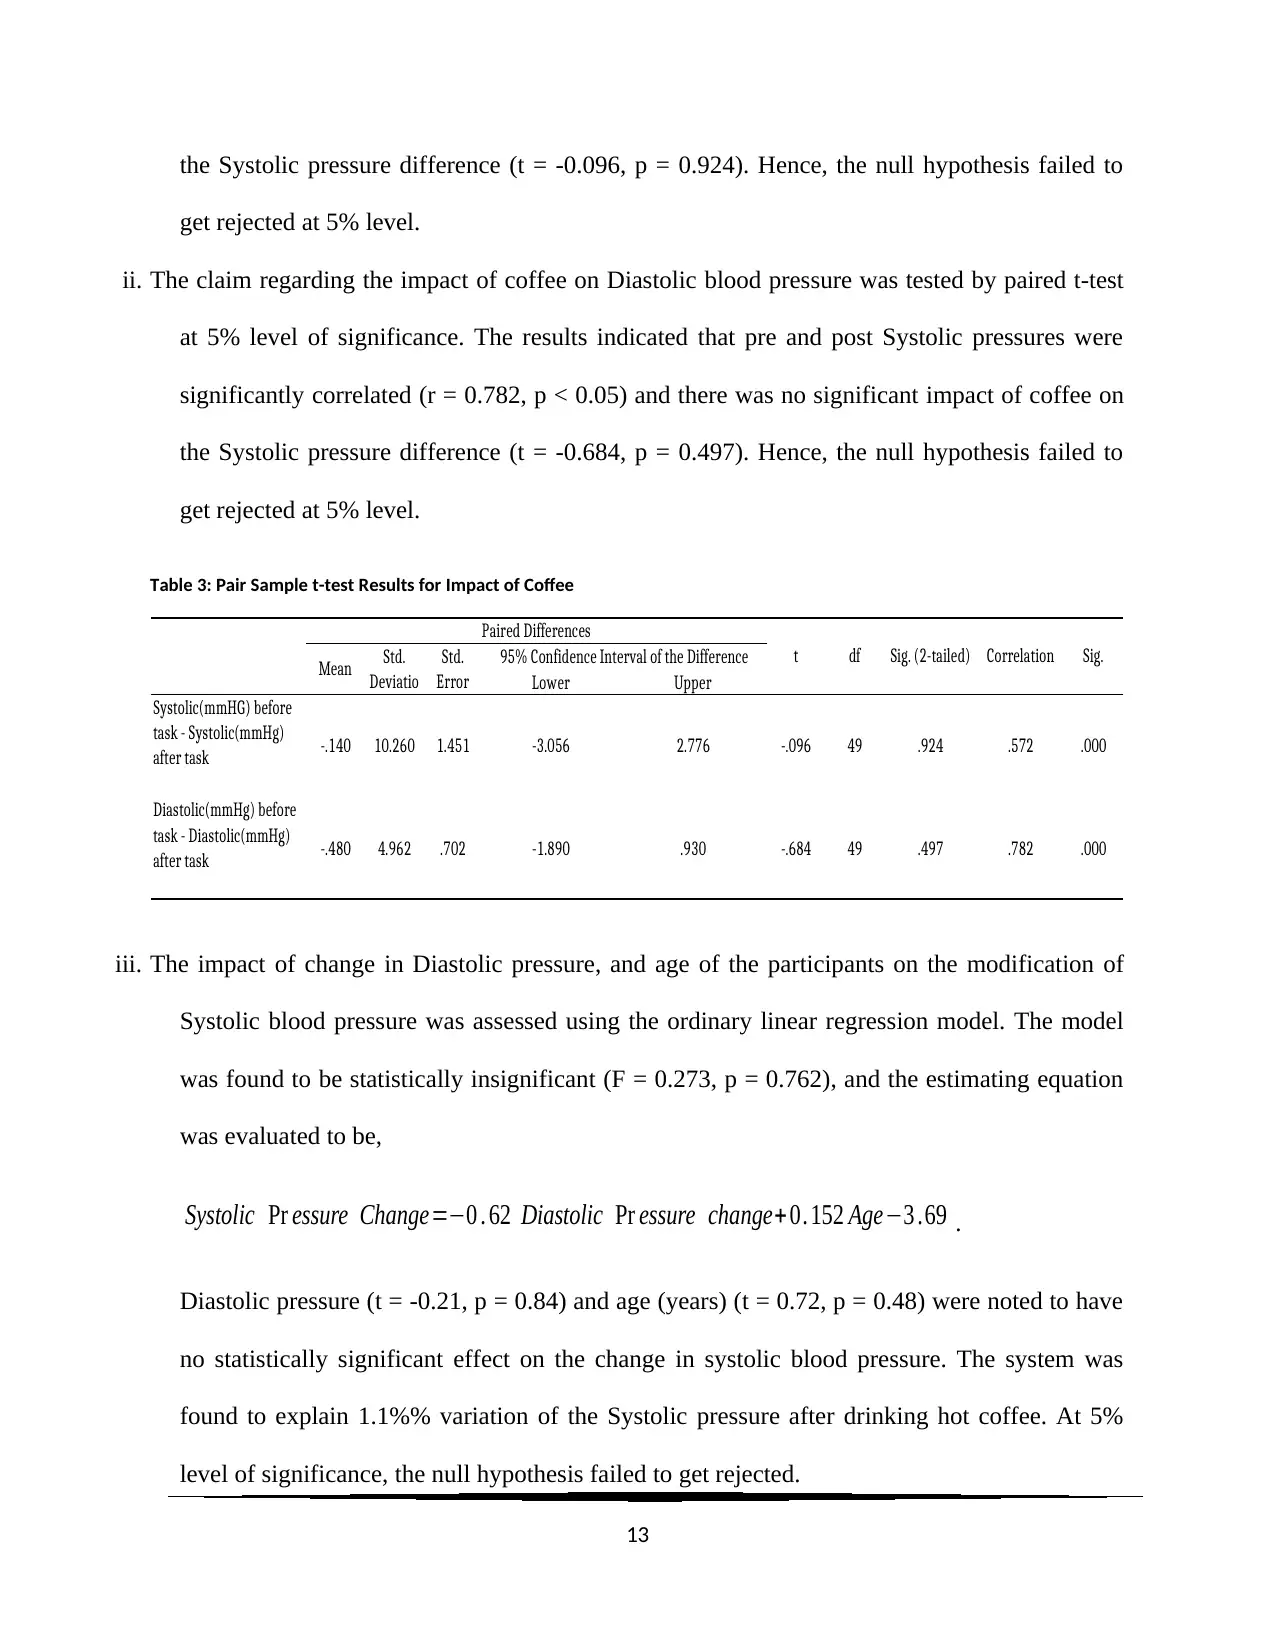
the Systolic pressure difference (t = -0.096, p = 0.924). Hence, the null hypothesis failed to
get rejected at 5% level.
ii. The claim regarding the impact of coffee on Diastolic blood pressure was tested by paired t-test
at 5% level of significance. The results indicated that pre and post Systolic pressures were
significantly correlated (r = 0.782, p < 0.05) and there was no significant impact of coffee on
the Systolic pressure difference (t = -0.684, p = 0.497). Hence, the null hypothesis failed to
get rejected at 5% level.
Table 3: Pair Sample t-test Results for Impact of Coffee
Lower Upper
Systolic(mmHG) before
task - Systolic(mmHg)
after task -.140 10.260 1.451 -3.056 2.776 -.096 49 .924 .572 .000
Diastolic(mmHg) before
task - Diastolic(mmHg)
after task -.480 4.962 .702 -1.890 .930 -.684 49 .497 .782 .000
Correlation Sig.
Paired Differences
t df Sig. (2-tailed)
Mean Std.
Deviatio
Std.
Error
95% Confidence Interval of the Difference
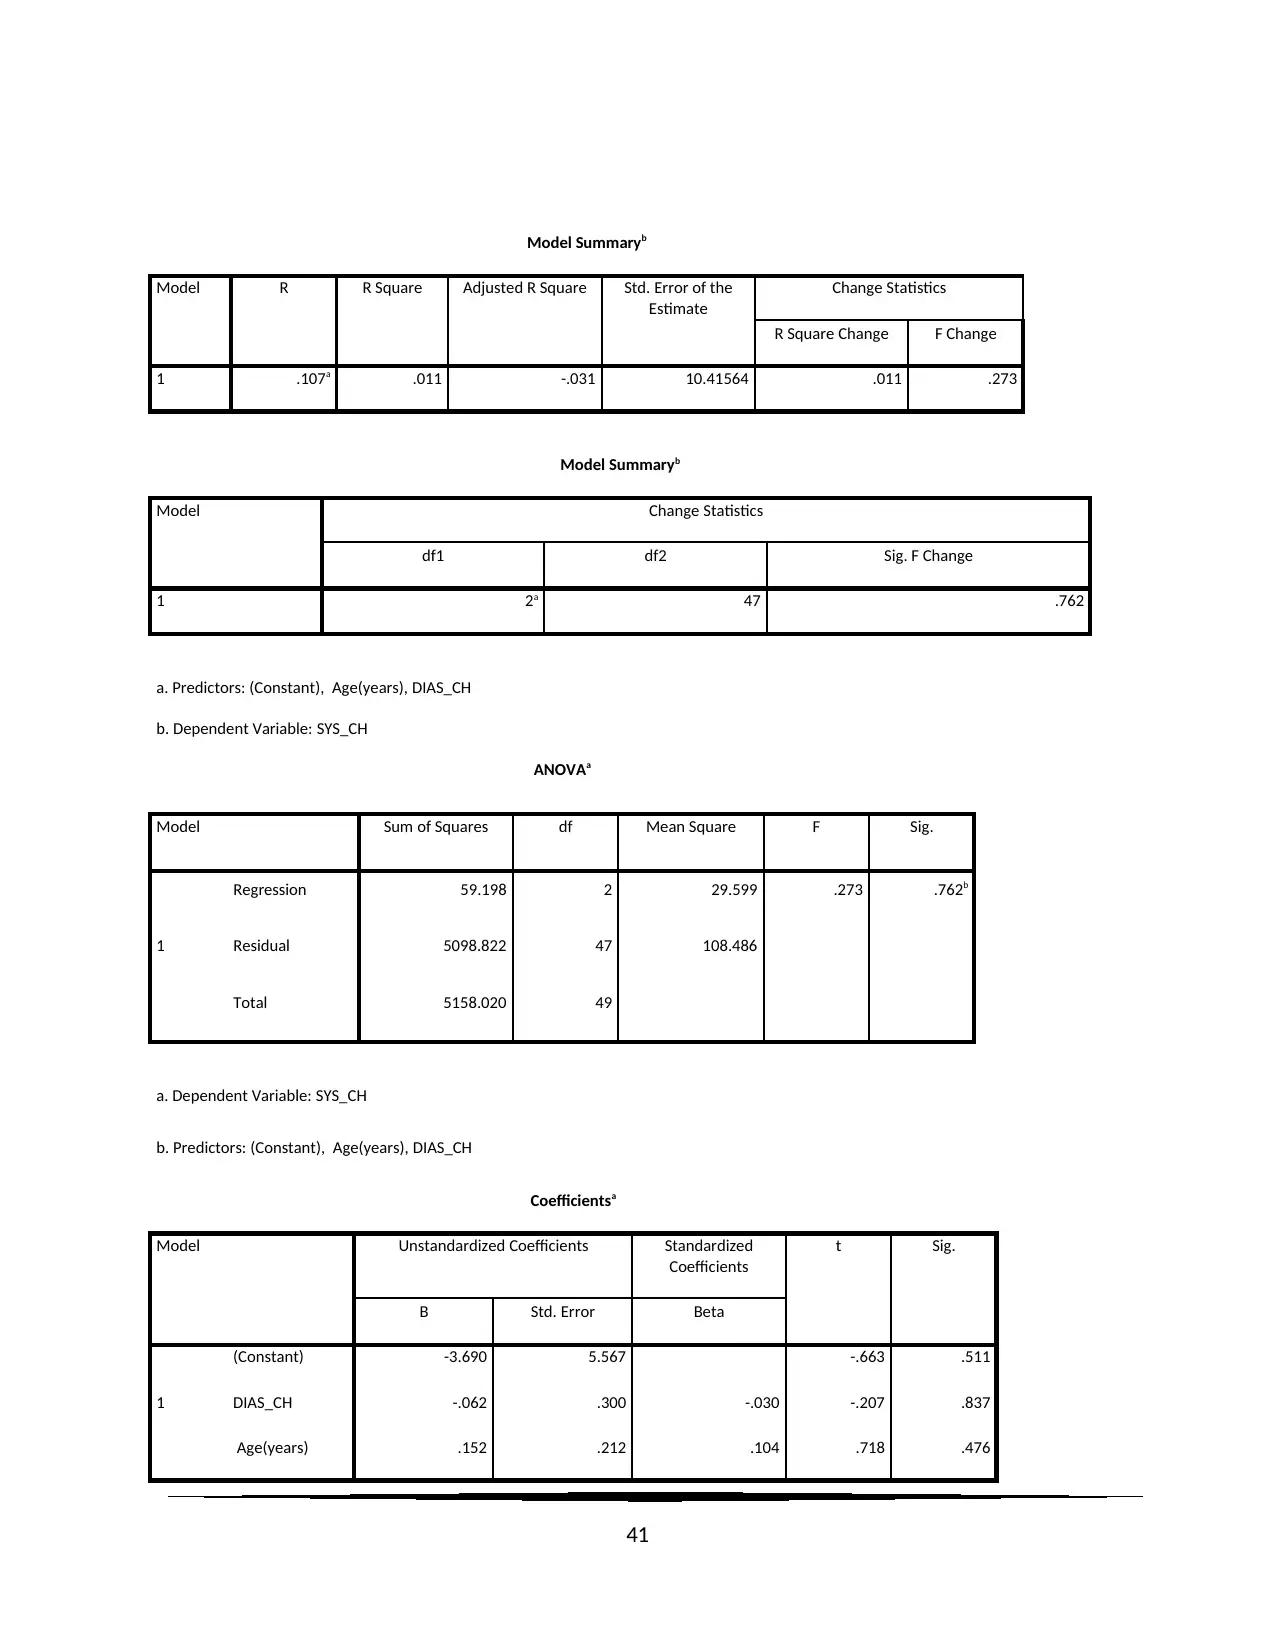
iii. The impact of change in Diastolic pressure, and age of the participants on the modification of
Systolic blood pressure was assessed using the ordinary linear regression model. The model
was found to be statistically insignificant (F = 0.273, p = 0.762), and the estimating equation
was evaluated to be,
Systolic Pr essure Change=−0 . 62 Diastolic Pr essure change+ 0. 152 Age−3 .69 .
Diastolic pressure (t = -0.21, p = 0.84) and age (years) (t = 0.72, p = 0.48) were noted to have
no statistically significant effect on the change in systolic blood pressure. The system was
found to explain 1.1%% variation of the Systolic pressure after drinking hot coffee. At 5%
level of significance, the null hypothesis failed to get rejected.
13
get rejected at 5% level.
ii. The claim regarding the impact of coffee on Diastolic blood pressure was tested by paired t-test
at 5% level of significance. The results indicated that pre and post Systolic pressures were
significantly correlated (r = 0.782, p < 0.05) and there was no significant impact of coffee on
the Systolic pressure difference (t = -0.684, p = 0.497). Hence, the null hypothesis failed to
get rejected at 5% level.
Table 3: Pair Sample t-test Results for Impact of Coffee
Lower Upper
Systolic(mmHG) before
task - Systolic(mmHg)
after task -.140 10.260 1.451 -3.056 2.776 -.096 49 .924 .572 .000
Diastolic(mmHg) before
task - Diastolic(mmHg)
after task -.480 4.962 .702 -1.890 .930 -.684 49 .497 .782 .000
Correlation Sig.
Paired Differences
t df Sig. (2-tailed)
Mean Std.
Deviatio
Std.
Error
95% Confidence Interval of the Difference
iii. The impact of change in Diastolic pressure, and age of the participants on the modification of
Systolic blood pressure was assessed using the ordinary linear regression model. The model
was found to be statistically insignificant (F = 0.273, p = 0.762), and the estimating equation
was evaluated to be,
Systolic Pr essure Change=−0 . 62 Diastolic Pr essure change+ 0. 152 Age−3 .69 .
Diastolic pressure (t = -0.21, p = 0.84) and age (years) (t = 0.72, p = 0.48) were noted to have
no statistically significant effect on the change in systolic blood pressure. The system was
found to explain 1.1%% variation of the Systolic pressure after drinking hot coffee. At 5%
level of significance, the null hypothesis failed to get rejected.
13
Paraphrase This Document
Need a fresh take? Get an instant paraphrase of this document with our AI Paraphraser
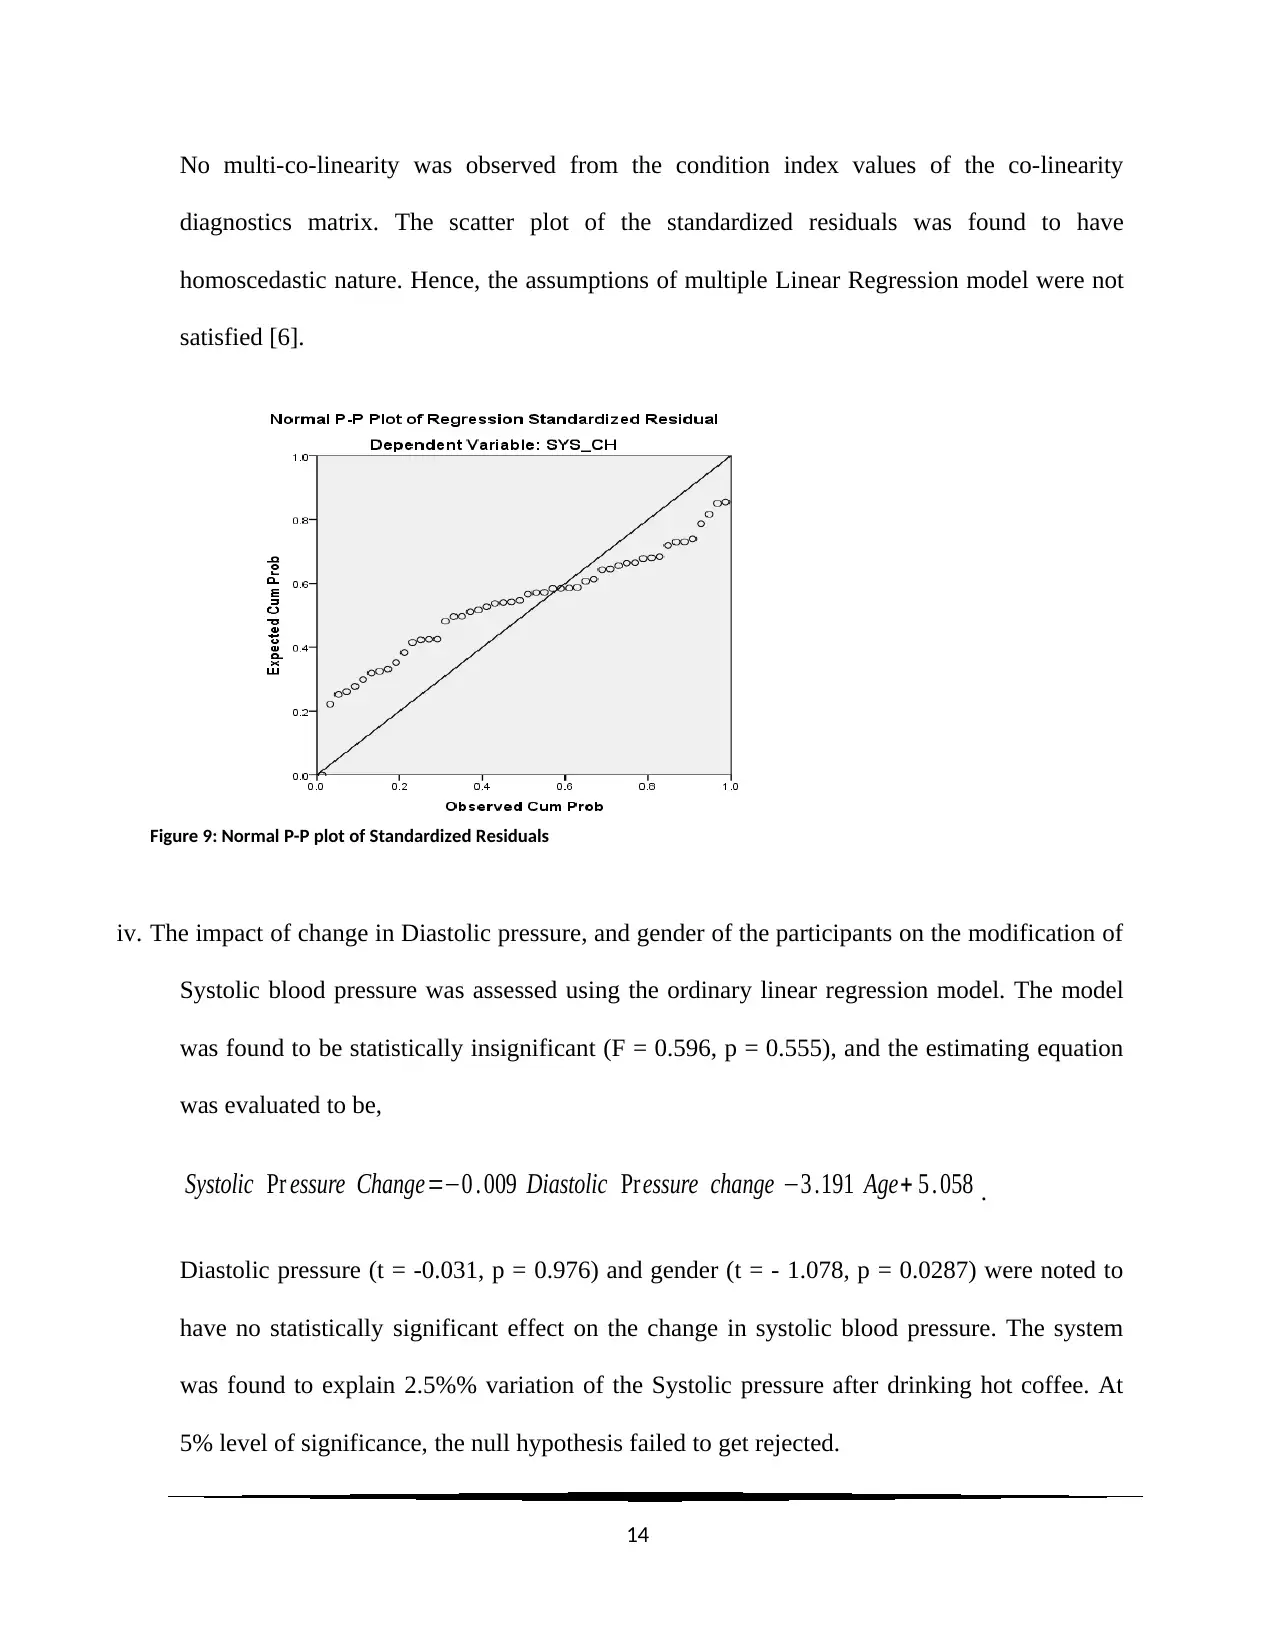
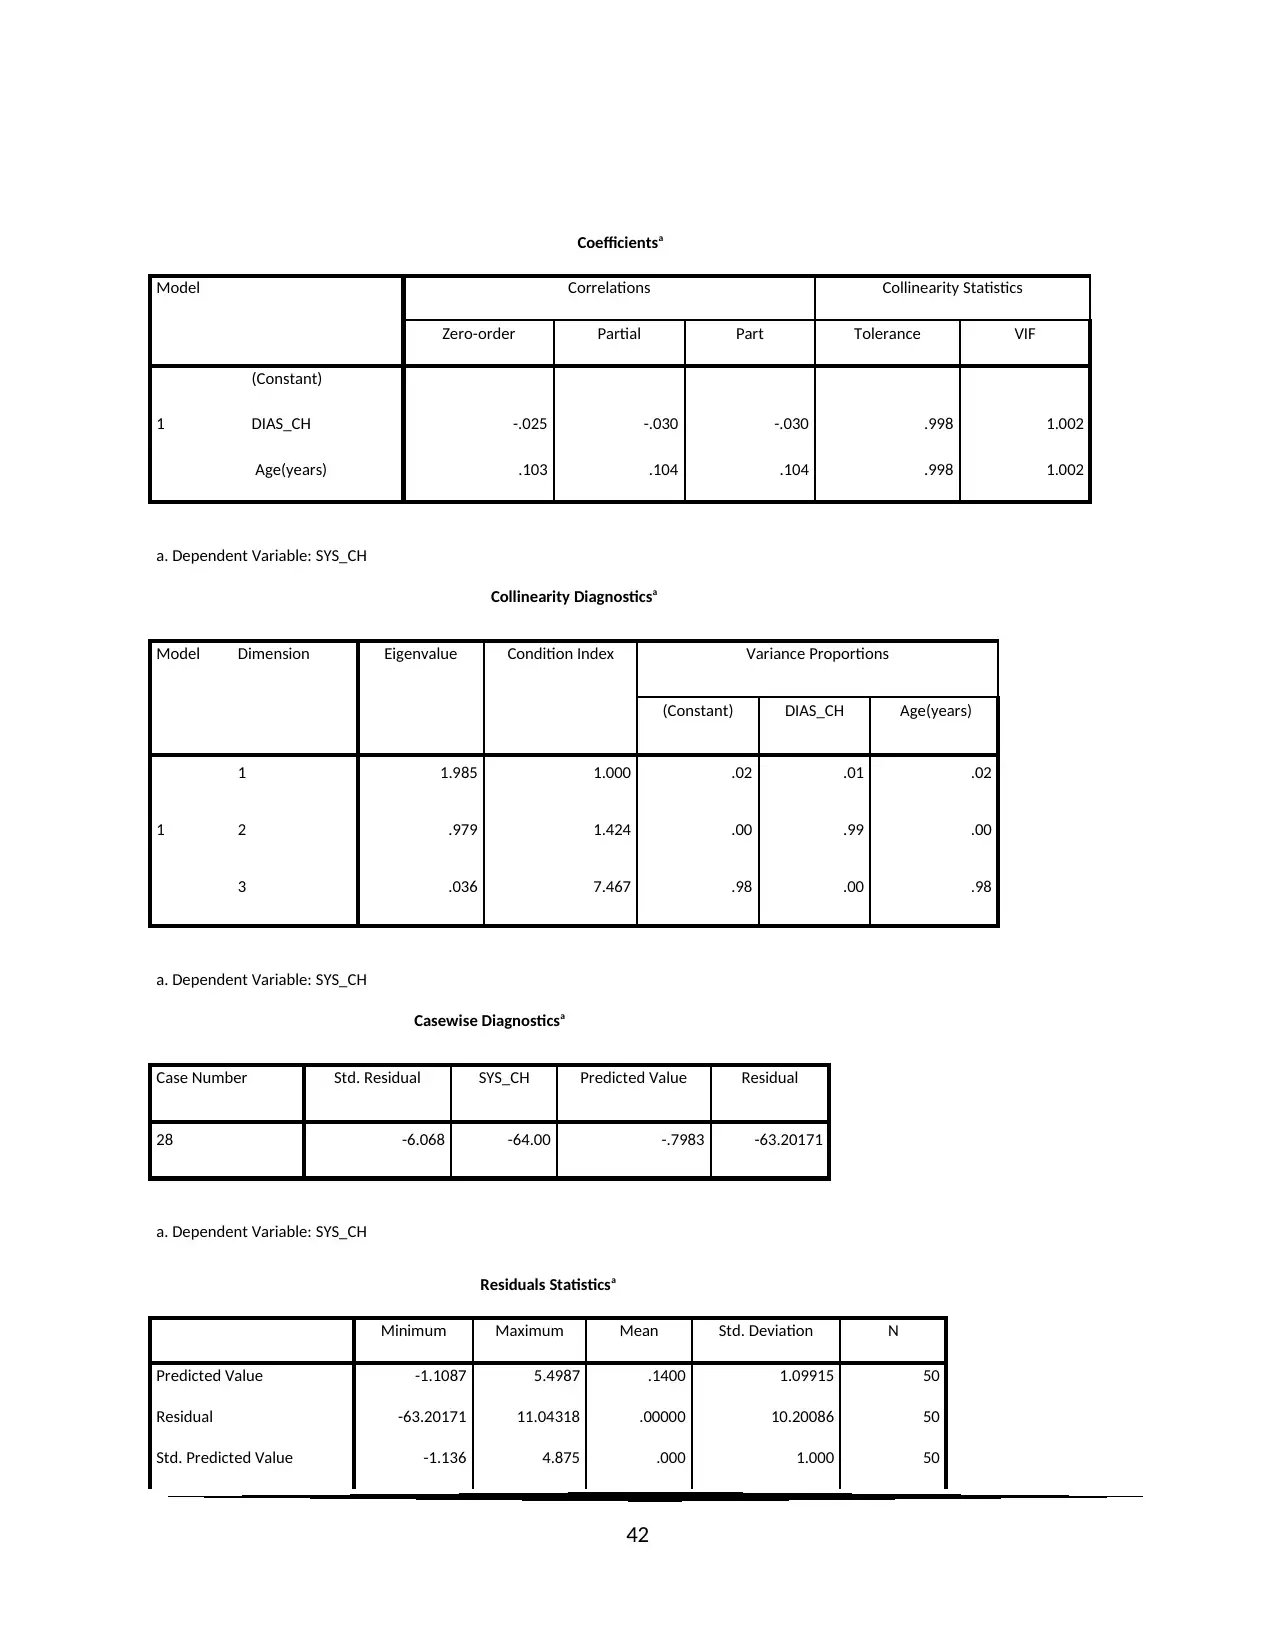
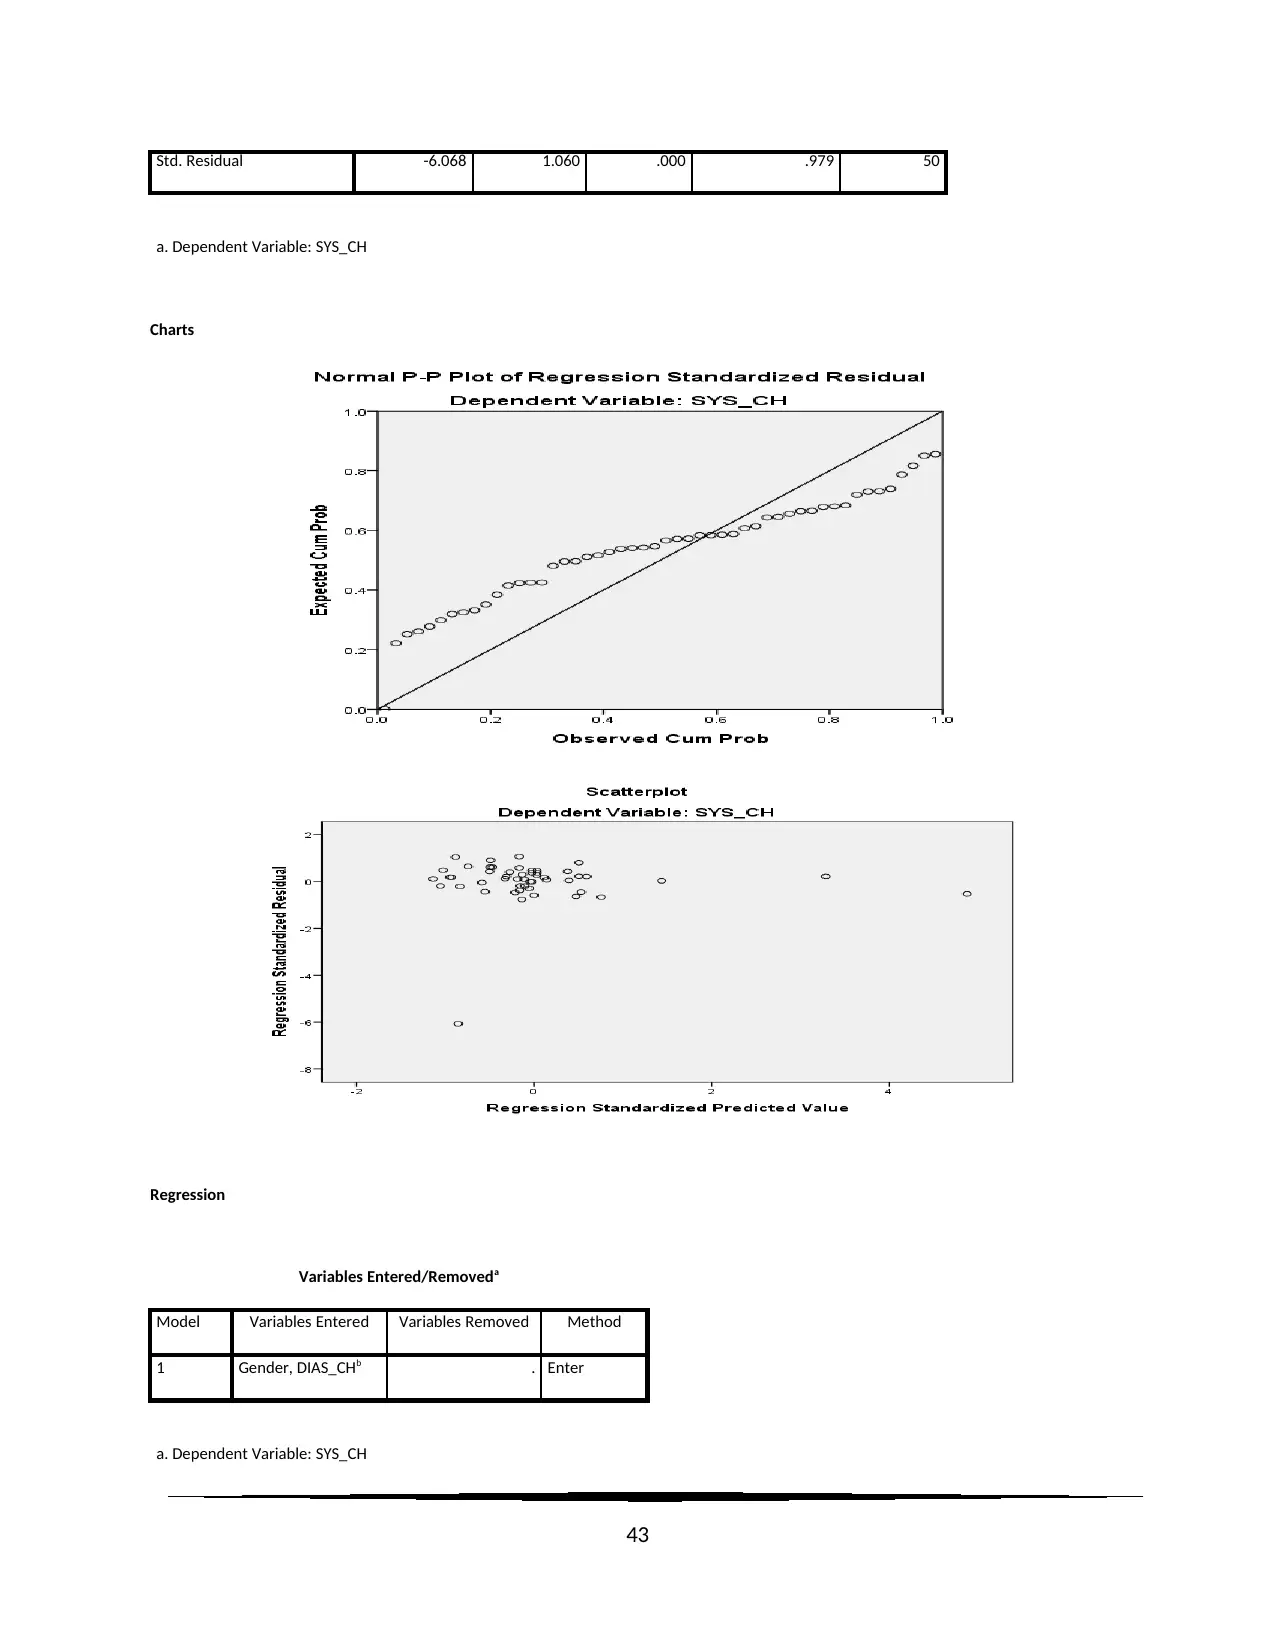
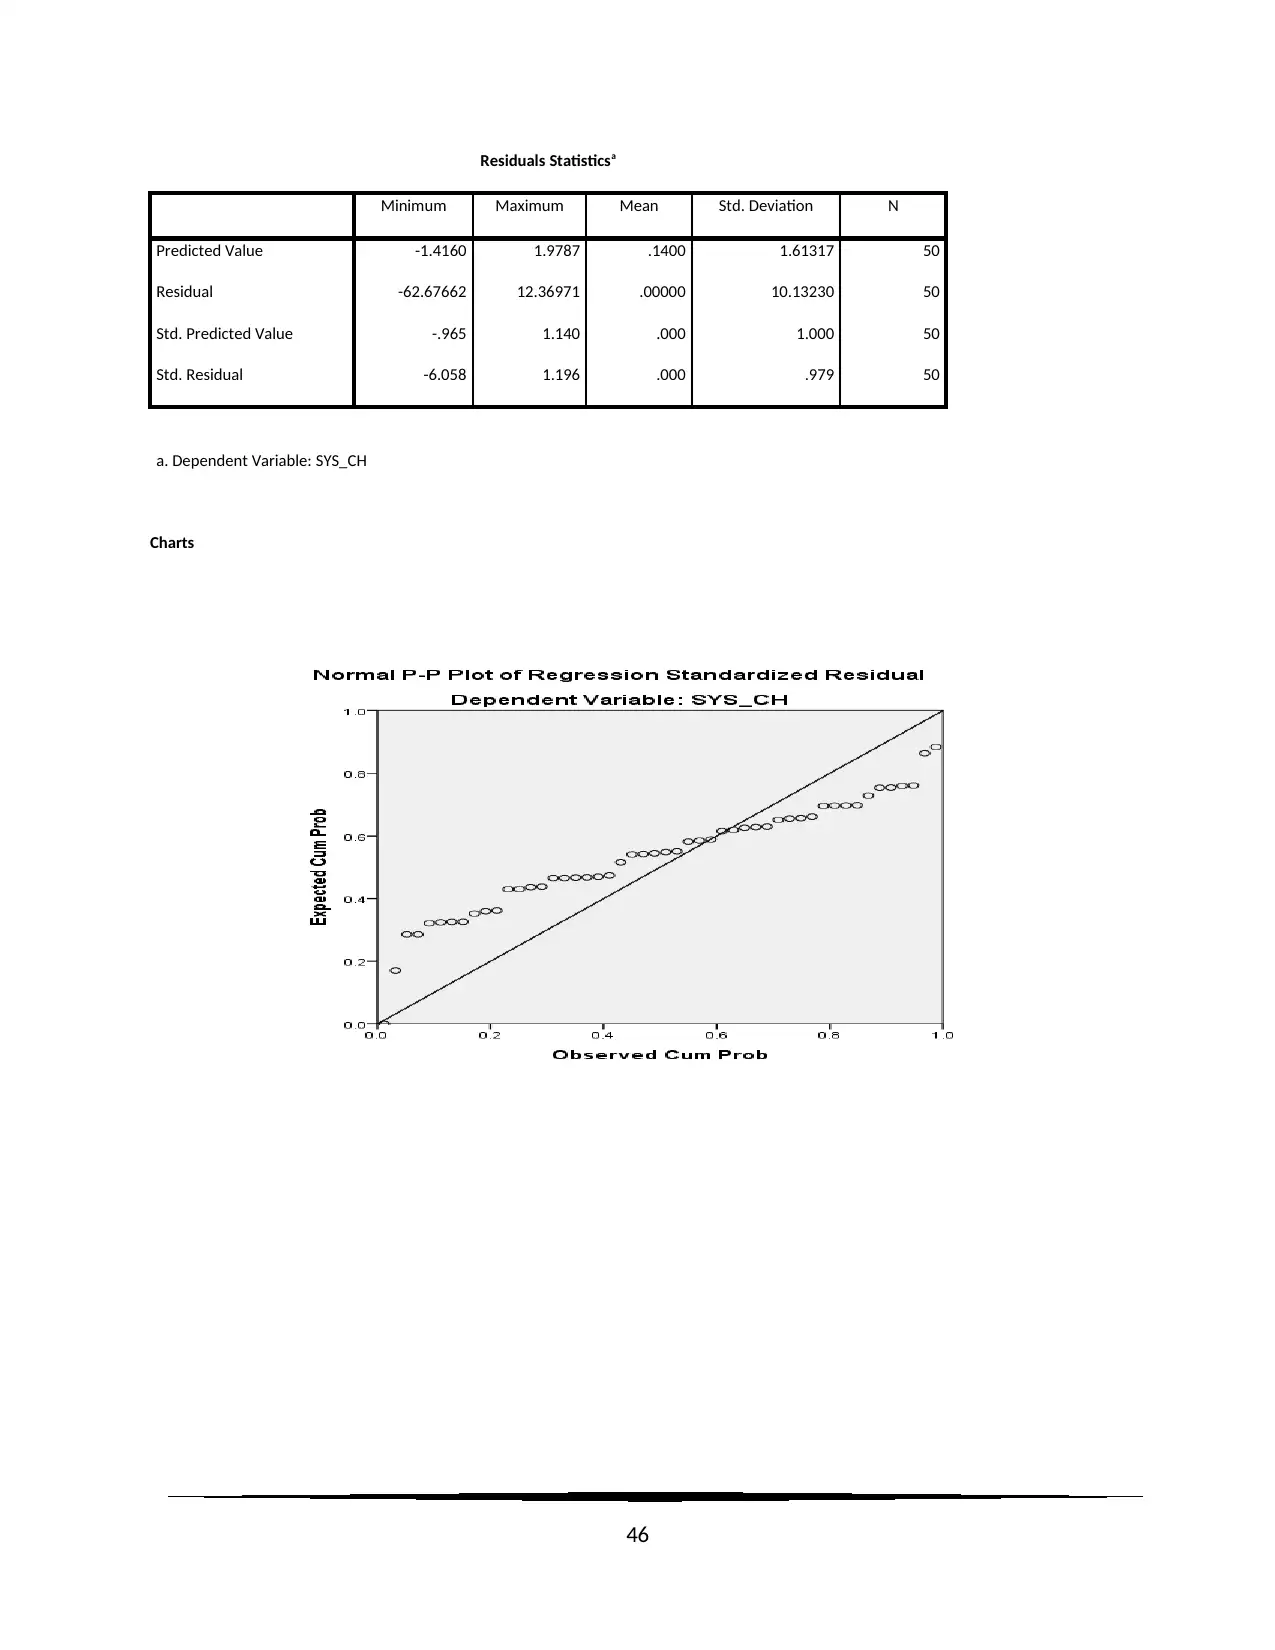
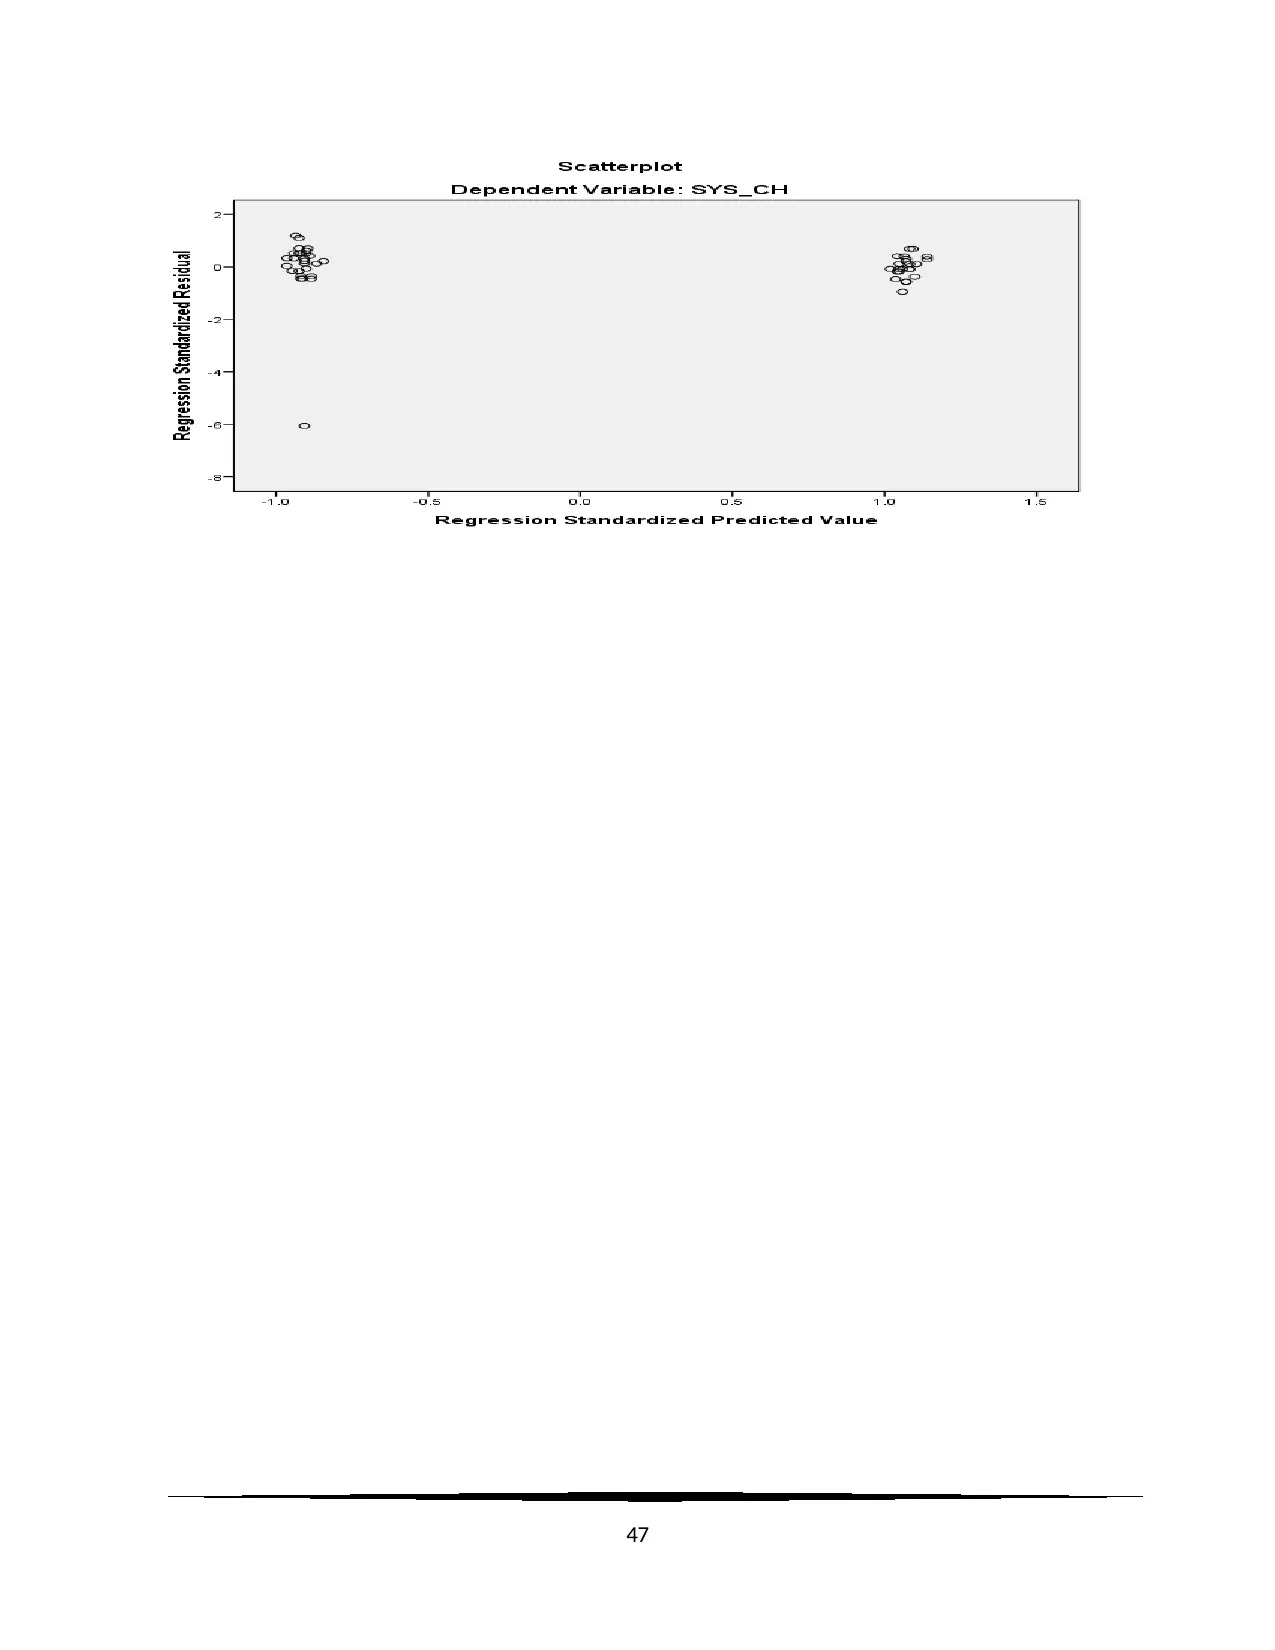
No multi-co-linearity was observed from the condition index values of the co-linearity
diagnostics matrix. The scatter plot of the standardized residuals was found to have
homoscedastic nature. Hence, the assumptions of multiple Linear Regression model were not
satisfied [6].
Figure 9: Normal P-P plot of Standardized Residuals
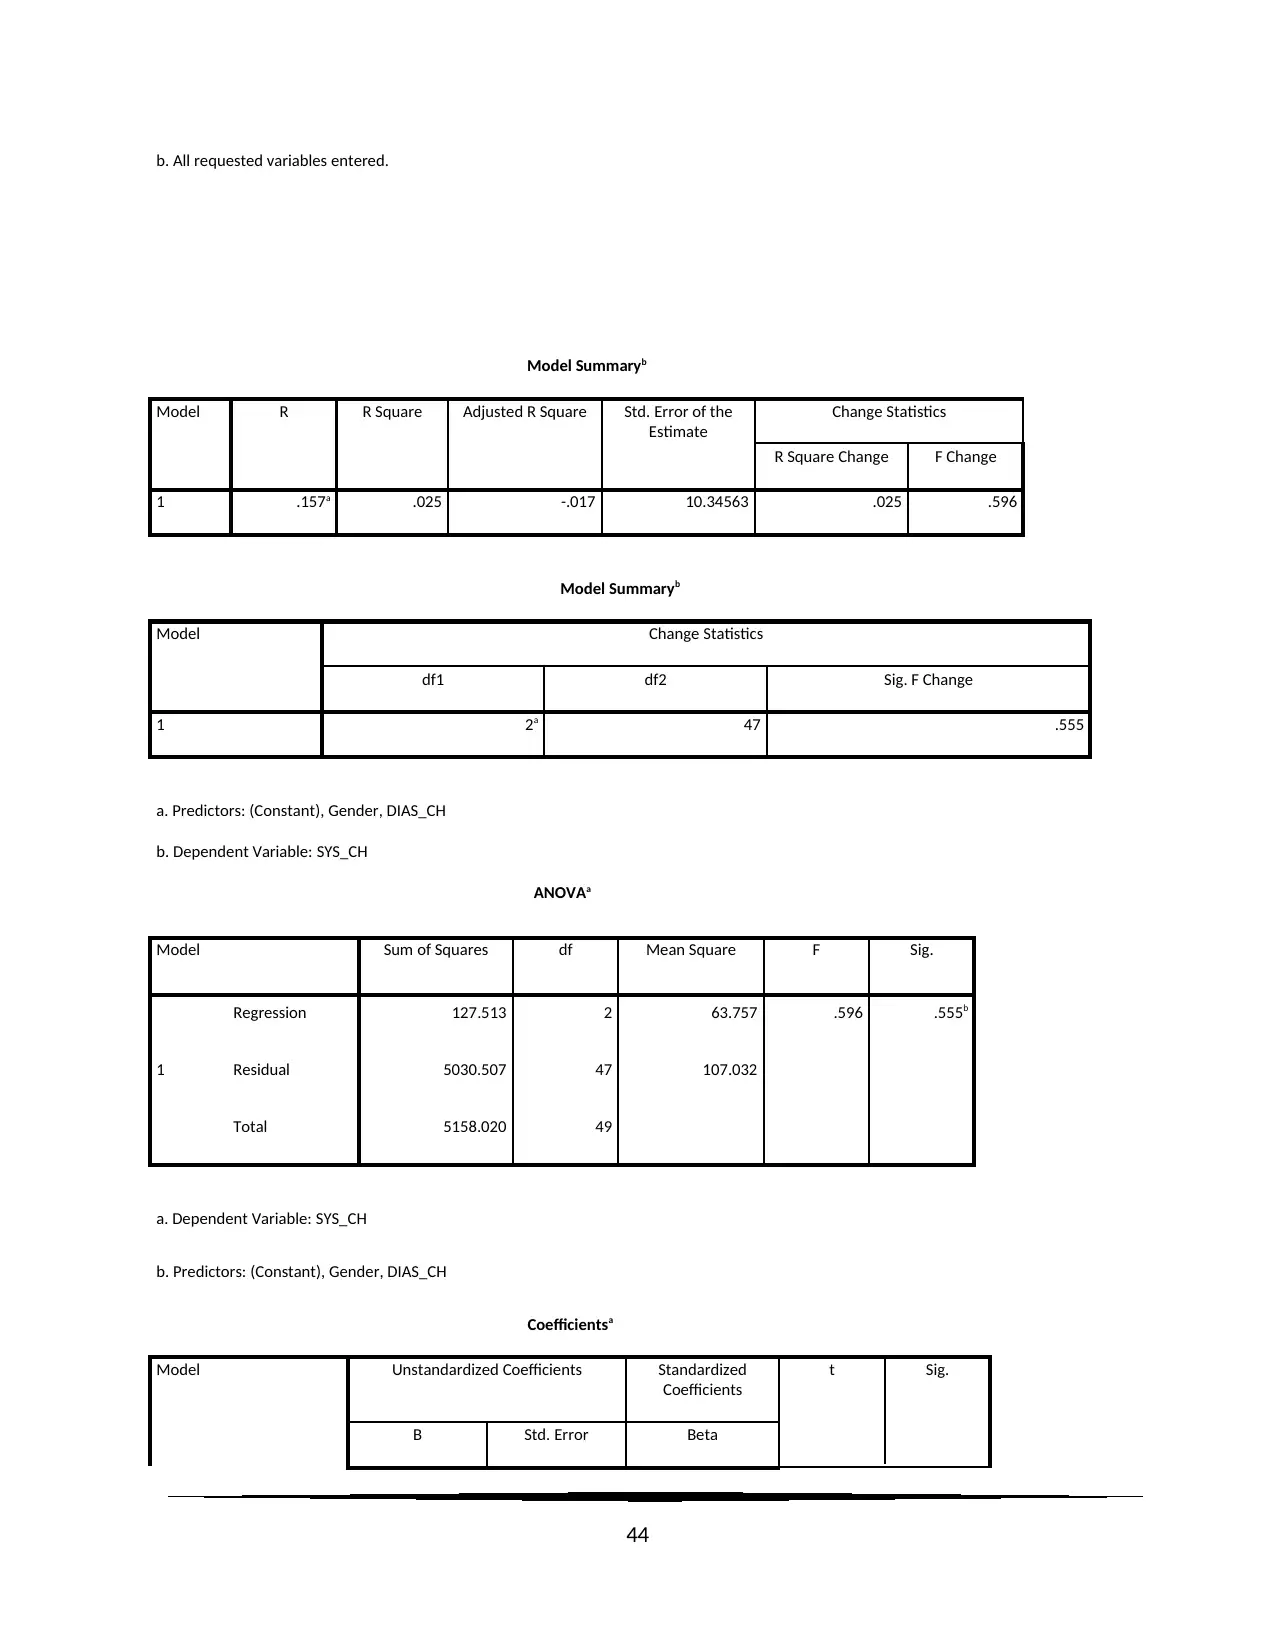
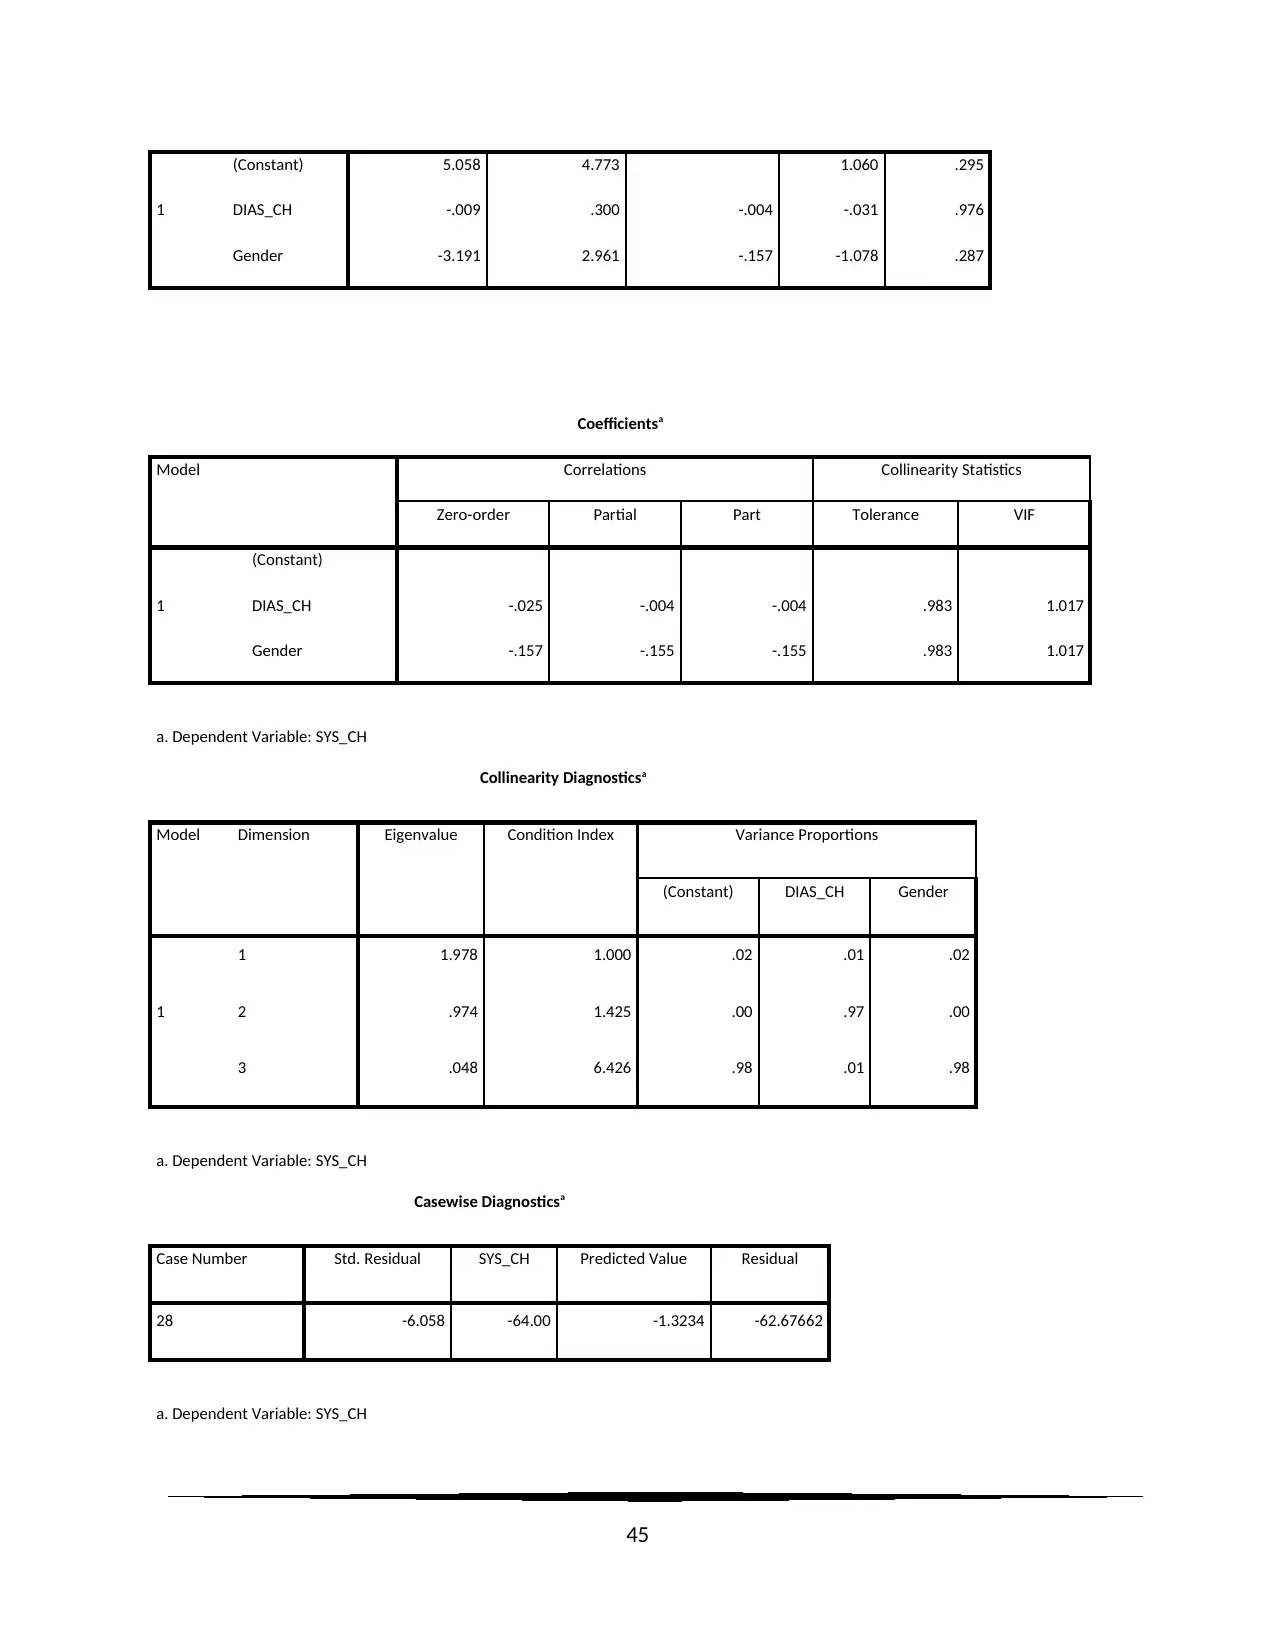
iv. The impact of change in Diastolic pressure, and gender of the participants on the modification of
Systolic blood pressure was assessed using the ordinary linear regression model. The model
was found to be statistically insignificant (F = 0.596, p = 0.555), and the estimating equation
was evaluated to be,
Systolic Pr essure Change=−0 . 009 Diastolic Pr essure change −3 .191 Age+ 5 . 058 .
Diastolic pressure (t = -0.031, p = 0.976) and gender (t = - 1.078, p = 0.0287) were noted to
have no statistically significant effect on the change in systolic blood pressure. The system
was found to explain 2.5%% variation of the Systolic pressure after drinking hot coffee. At
5% level of significance, the null hypothesis failed to get rejected.
14
diagnostics matrix. The scatter plot of the standardized residuals was found to have
homoscedastic nature. Hence, the assumptions of multiple Linear Regression model were not
satisfied [6].
Figure 9: Normal P-P plot of Standardized Residuals
iv. The impact of change in Diastolic pressure, and gender of the participants on the modification of
Systolic blood pressure was assessed using the ordinary linear regression model. The model
was found to be statistically insignificant (F = 0.596, p = 0.555), and the estimating equation
was evaluated to be,
Systolic Pr essure Change=−0 . 009 Diastolic Pr essure change −3 .191 Age+ 5 . 058 .
Diastolic pressure (t = -0.031, p = 0.976) and gender (t = - 1.078, p = 0.0287) were noted to
have no statistically significant effect on the change in systolic blood pressure. The system
was found to explain 2.5%% variation of the Systolic pressure after drinking hot coffee. At
5% level of significance, the null hypothesis failed to get rejected.
14
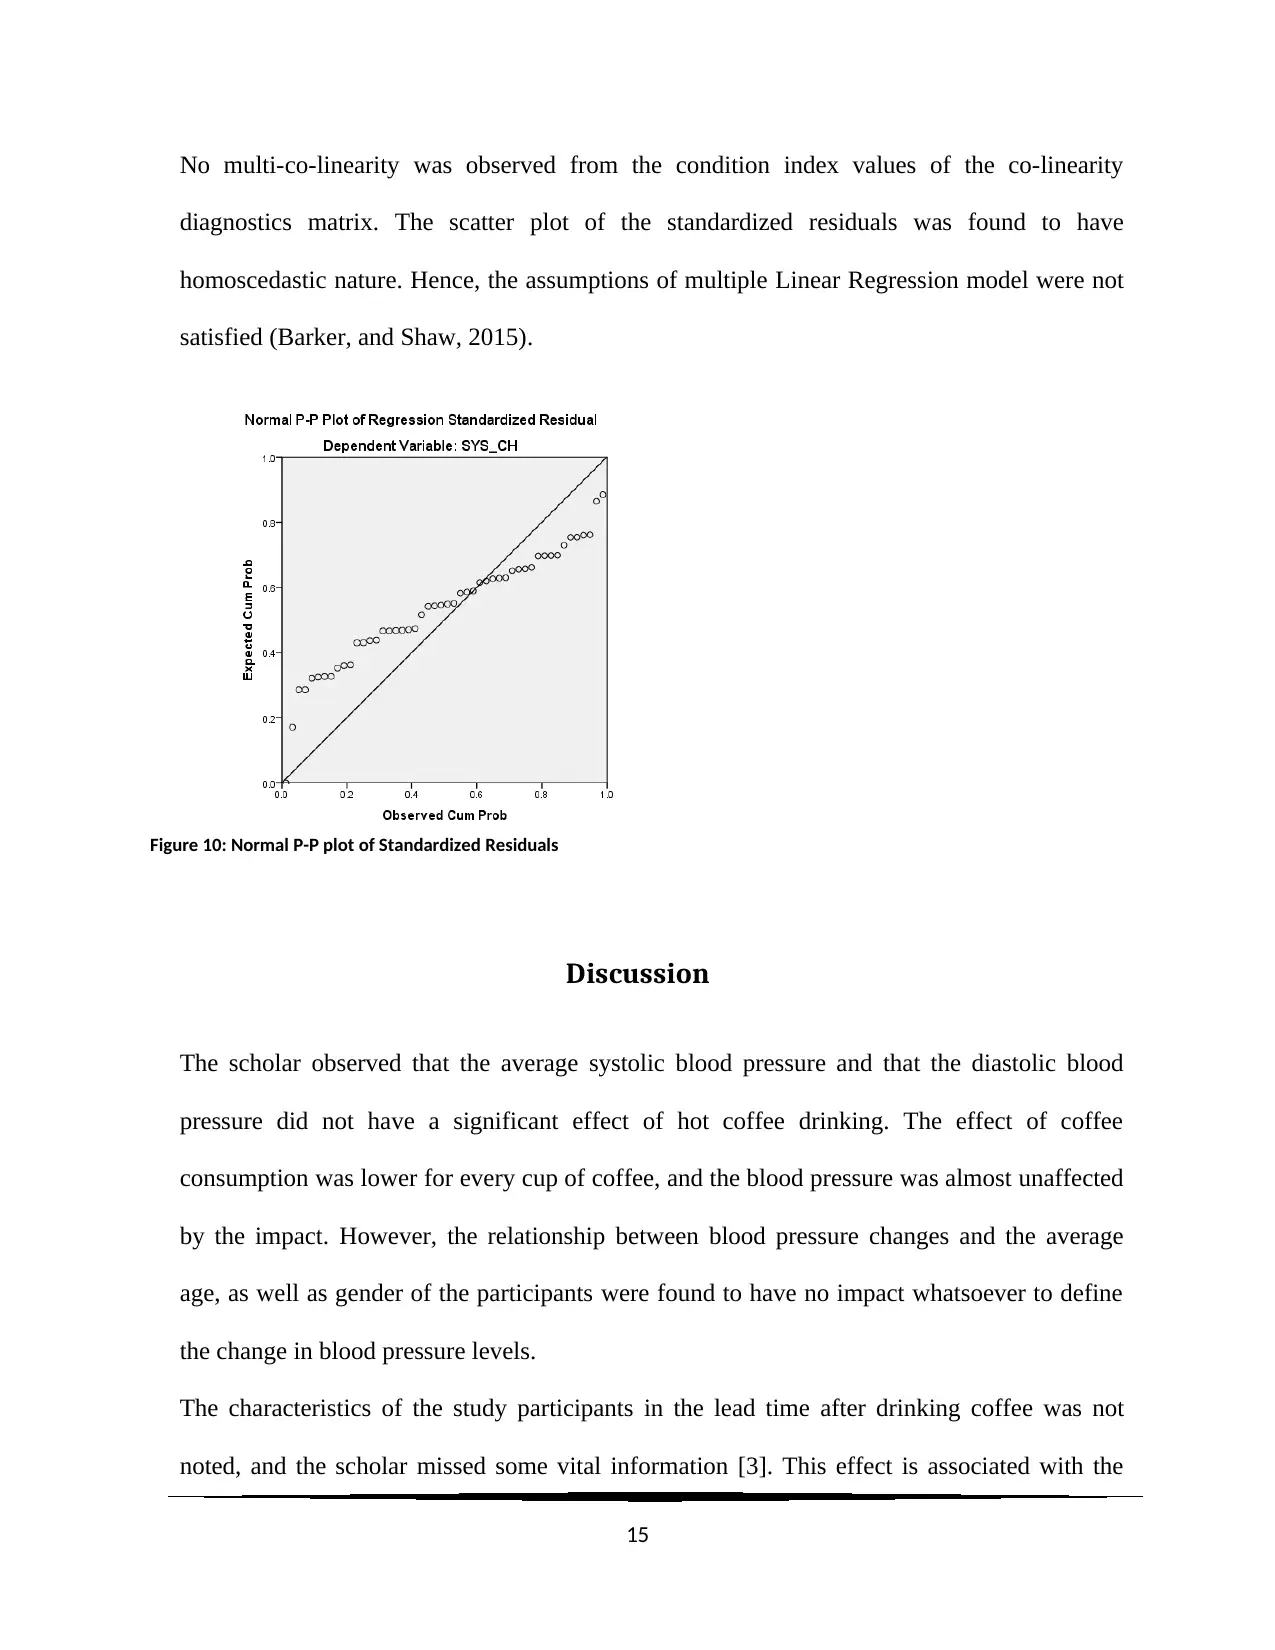
No multi-co-linearity was observed from the condition index values of the co-linearity
diagnostics matrix. The scatter plot of the standardized residuals was found to have
homoscedastic nature. Hence, the assumptions of multiple Linear Regression model were not
satisfied (Barker, and Shaw, 2015).
Figure 10: Normal P-P plot of Standardized Residuals
Discussion
The scholar observed that the average systolic blood pressure and that the diastolic blood
pressure did not have a significant effect of hot coffee drinking. The effect of coffee
consumption was lower for every cup of coffee, and the blood pressure was almost unaffected
by the impact. However, the relationship between blood pressure changes and the average
age, as well as gender of the participants were found to have no impact whatsoever to define
the change in blood pressure levels.
The characteristics of the study participants in the lead time after drinking coffee was not
noted, and the scholar missed some vital information [3]. This effect is associated with the
15
quantitative summary of recent experiments. An effect on cardiovascular activity was not
discussed in this study [7]. Previous studies have shown that coffee use is accompanied by an
increase in systolic and diastolic blood pressure. However, the results of the observation
studies were contradictory and difficult to interpret. In summary, the results failed to confirm
the relationship between coffee consumption and hypertension. The conduct of high blood
pressure tests should be a priority for the future. In addition, it is necessary to further
investigate the importance of these factors in smoking and stress, in order to change the effect
of consumption of coffee on blood pressure.
16
Secure Best Marks with AI Grader
Need help grading? Try our AI Grader for instant feedback on your assignments.
References
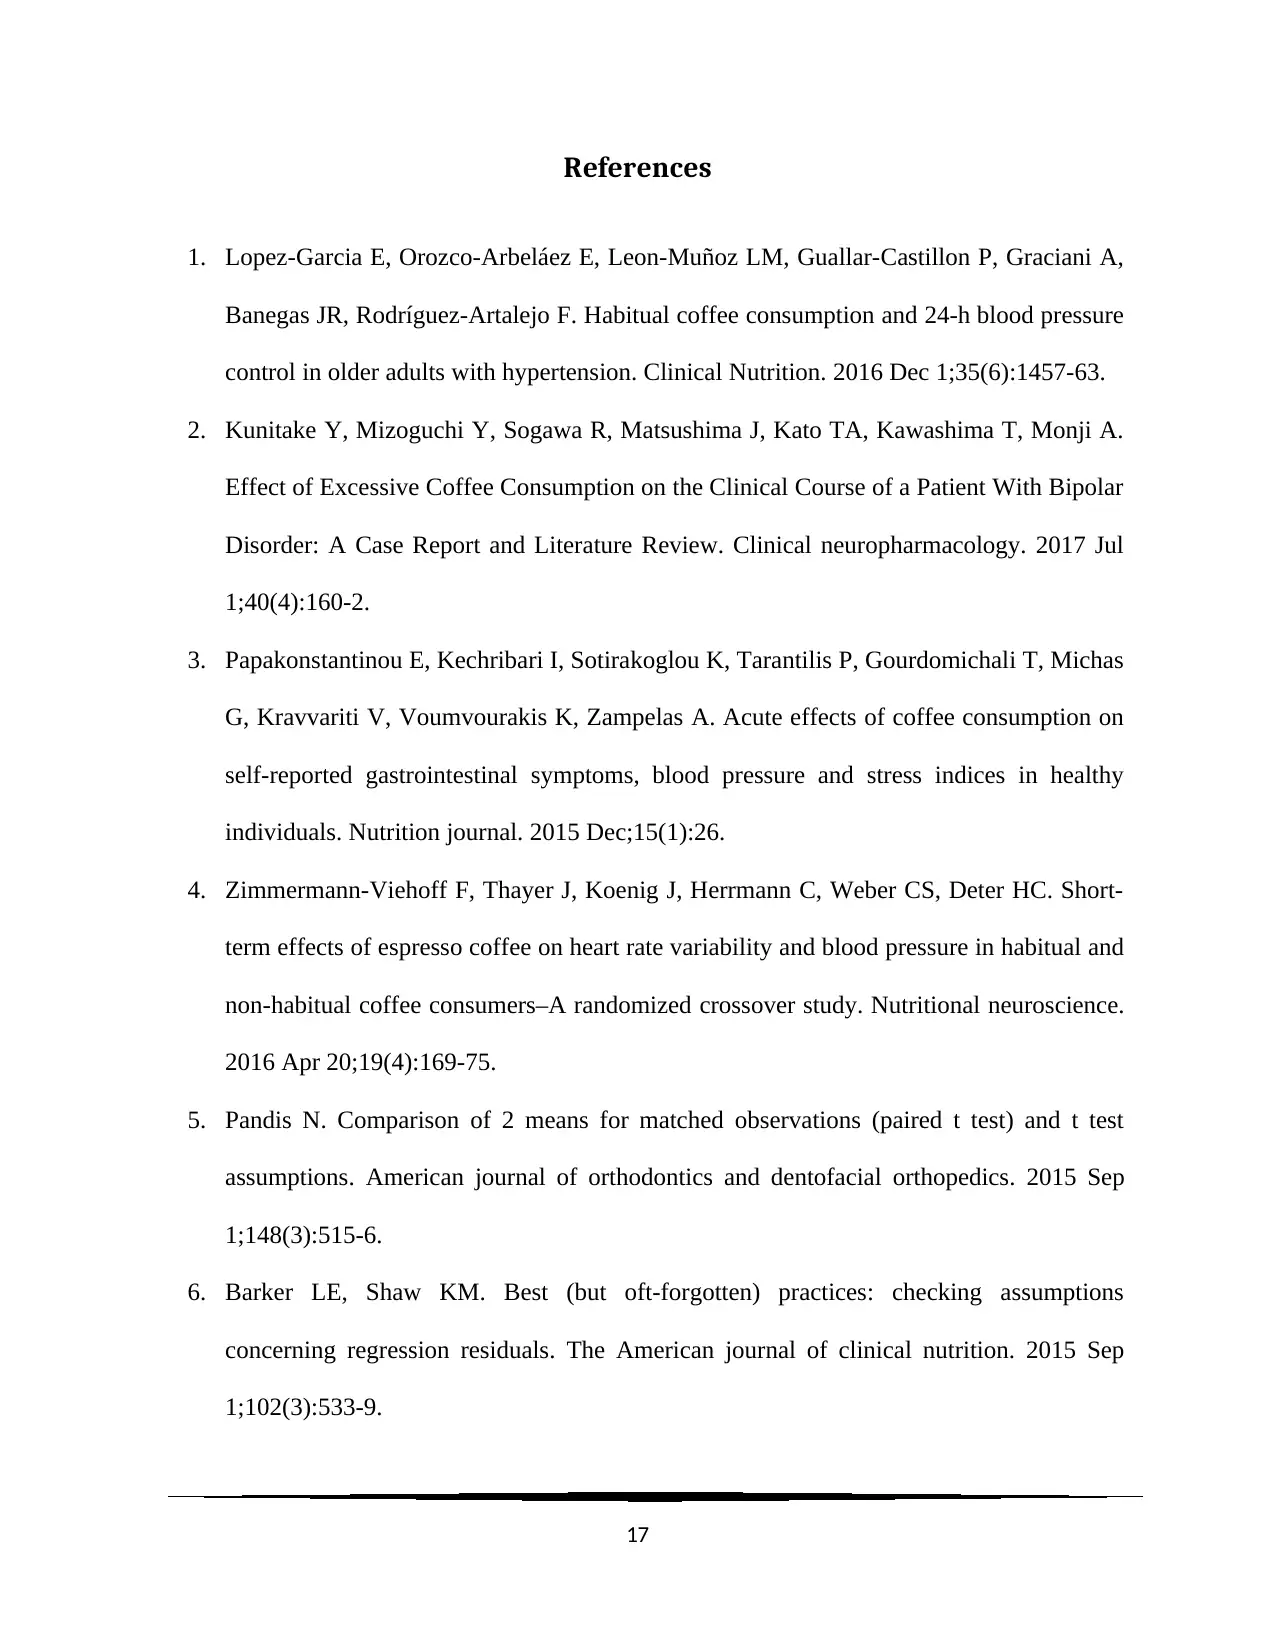
1. Lopez-Garcia E, Orozco-Arbeláez E, Leon-Muñoz LM, Guallar-Castillon P, Graciani A,
Banegas JR, Rodríguez-Artalejo F. Habitual coffee consumption and 24-h blood pressure
control in older adults with hypertension. Clinical Nutrition. 2016 Dec 1;35(6):1457-63.
2. Kunitake Y, Mizoguchi Y, Sogawa R, Matsushima J, Kato TA, Kawashima T, Monji A.
Effect of Excessive Coffee Consumption on the Clinical Course of a Patient With Bipolar
Disorder: A Case Report and Literature Review. Clinical neuropharmacology. 2017 Jul
1;40(4):160-2.
3. Papakonstantinou E, Kechribari I, Sotirakoglou Κ, Tarantilis P, Gourdomichali T, Michas
G, Kravvariti V, Voumvourakis K, Zampelas A. Acute effects of coffee consumption on
self-reported gastrointestinal symptoms, blood pressure and stress indices in healthy
individuals. Nutrition journal. 2015 Dec;15(1):26.
4. Zimmermann-Viehoff F, Thayer J, Koenig J, Herrmann C, Weber CS, Deter HC. Short-
term effects of espresso coffee on heart rate variability and blood pressure in habitual and
non-habitual coffee consumers–A randomized crossover study. Nutritional neuroscience.
2016 Apr 20;19(4):169-75.
5. Pandis N. Comparison of 2 means for matched observations (paired t test) and t test
assumptions. American journal of orthodontics and dentofacial orthopedics. 2015 Sep
1;148(3):515-6.
6. Barker LE, Shaw KM. Best (but oft-forgotten) practices: checking assumptions
concerning regression residuals. The American journal of clinical nutrition. 2015 Sep
1;102(3):533-9.
17
7. Mesas AE, Leon-Muñoz LM, Rodriguez-Artalejo F, Lopez-Garcia E. The effect of coffee
on blood pressure and cardiovascular disease in hypertensive individuals: a systematic
review and meta-analysis–. The American journal of clinical nutrition. 2011 Aug
31;94(4):1113-26.
18
on blood pressure and cardiovascular disease in hypertensive individuals: a systematic
review and meta-analysis–. The American journal of clinical nutrition. 2011 Aug
31;94(4):1113-26.
18
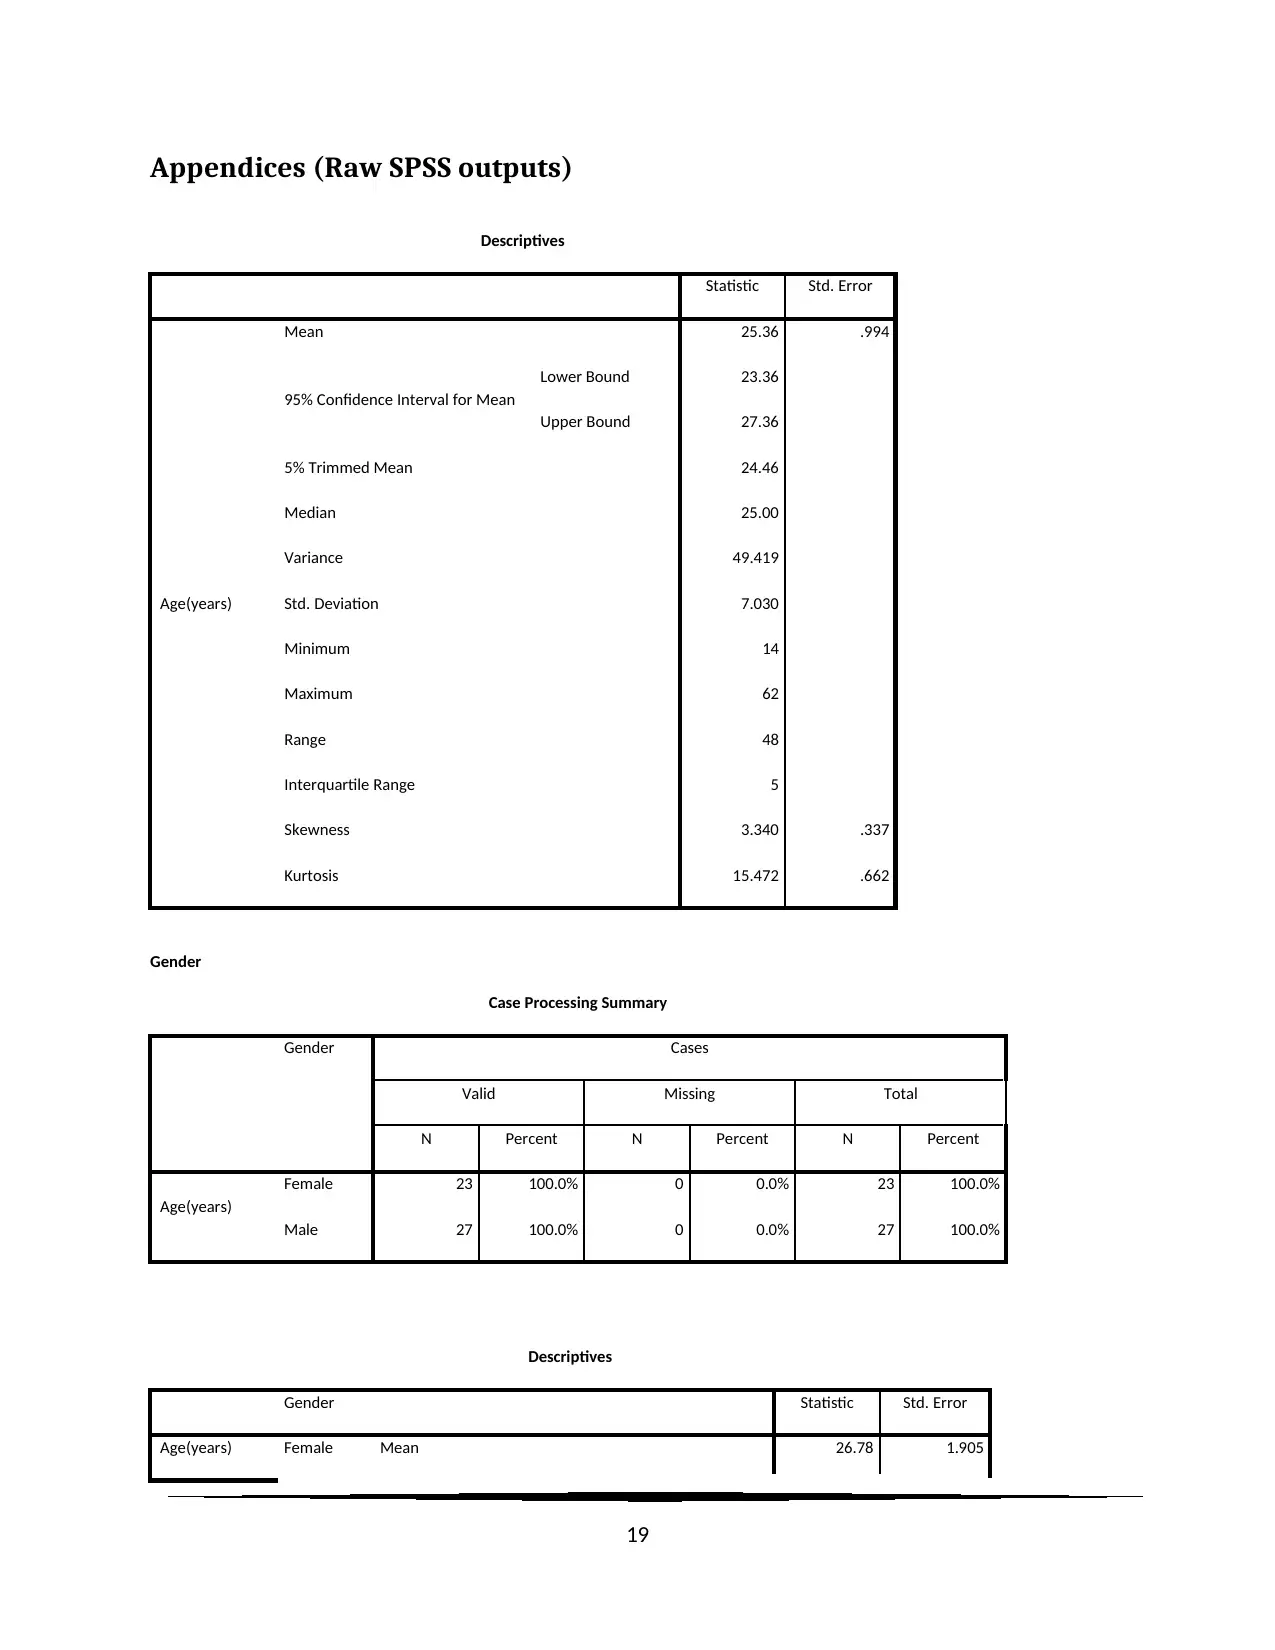
Appendices (Raw SPSS outputs)
Descriptives
Statistic Std. Error
Age(years)
Mean 25.36 .994
95% Confidence Interval for Mean
Lower Bound 23.36
Upper Bound 27.36
5% Trimmed Mean 24.46
Median 25.00
Variance 49.419
Std. Deviation 7.030
Minimum 14
Maximum 62
Range 48
Interquartile Range 5
Skewness 3.340 .337
Kurtosis 15.472 .662
Gender
Case Processing Summary
Gender Cases
Valid Missing Total
N Percent N Percent N Percent
Age(years)
Female 23 100.0% 0 0.0% 23 100.0%
Male 27 100.0% 0 0.0% 27 100.0%
Descriptives
Gender Statistic Std. Error
Age(years) Female Mean 26.78 1.905
19
Descriptives
Statistic Std. Error
Age(years)
Mean 25.36 .994
95% Confidence Interval for Mean
Lower Bound 23.36
Upper Bound 27.36
5% Trimmed Mean 24.46
Median 25.00
Variance 49.419
Std. Deviation 7.030
Minimum 14
Maximum 62
Range 48
Interquartile Range 5
Skewness 3.340 .337
Kurtosis 15.472 .662
Gender
Case Processing Summary
Gender Cases
Valid Missing Total
N Percent N Percent N Percent
Age(years)
Female 23 100.0% 0 0.0% 23 100.0%
Male 27 100.0% 0 0.0% 27 100.0%
Descriptives
Gender Statistic Std. Error
Age(years) Female Mean 26.78 1.905
19
Paraphrase This Document
Need a fresh take? Get an instant paraphrase of this document with our AI Paraphraser
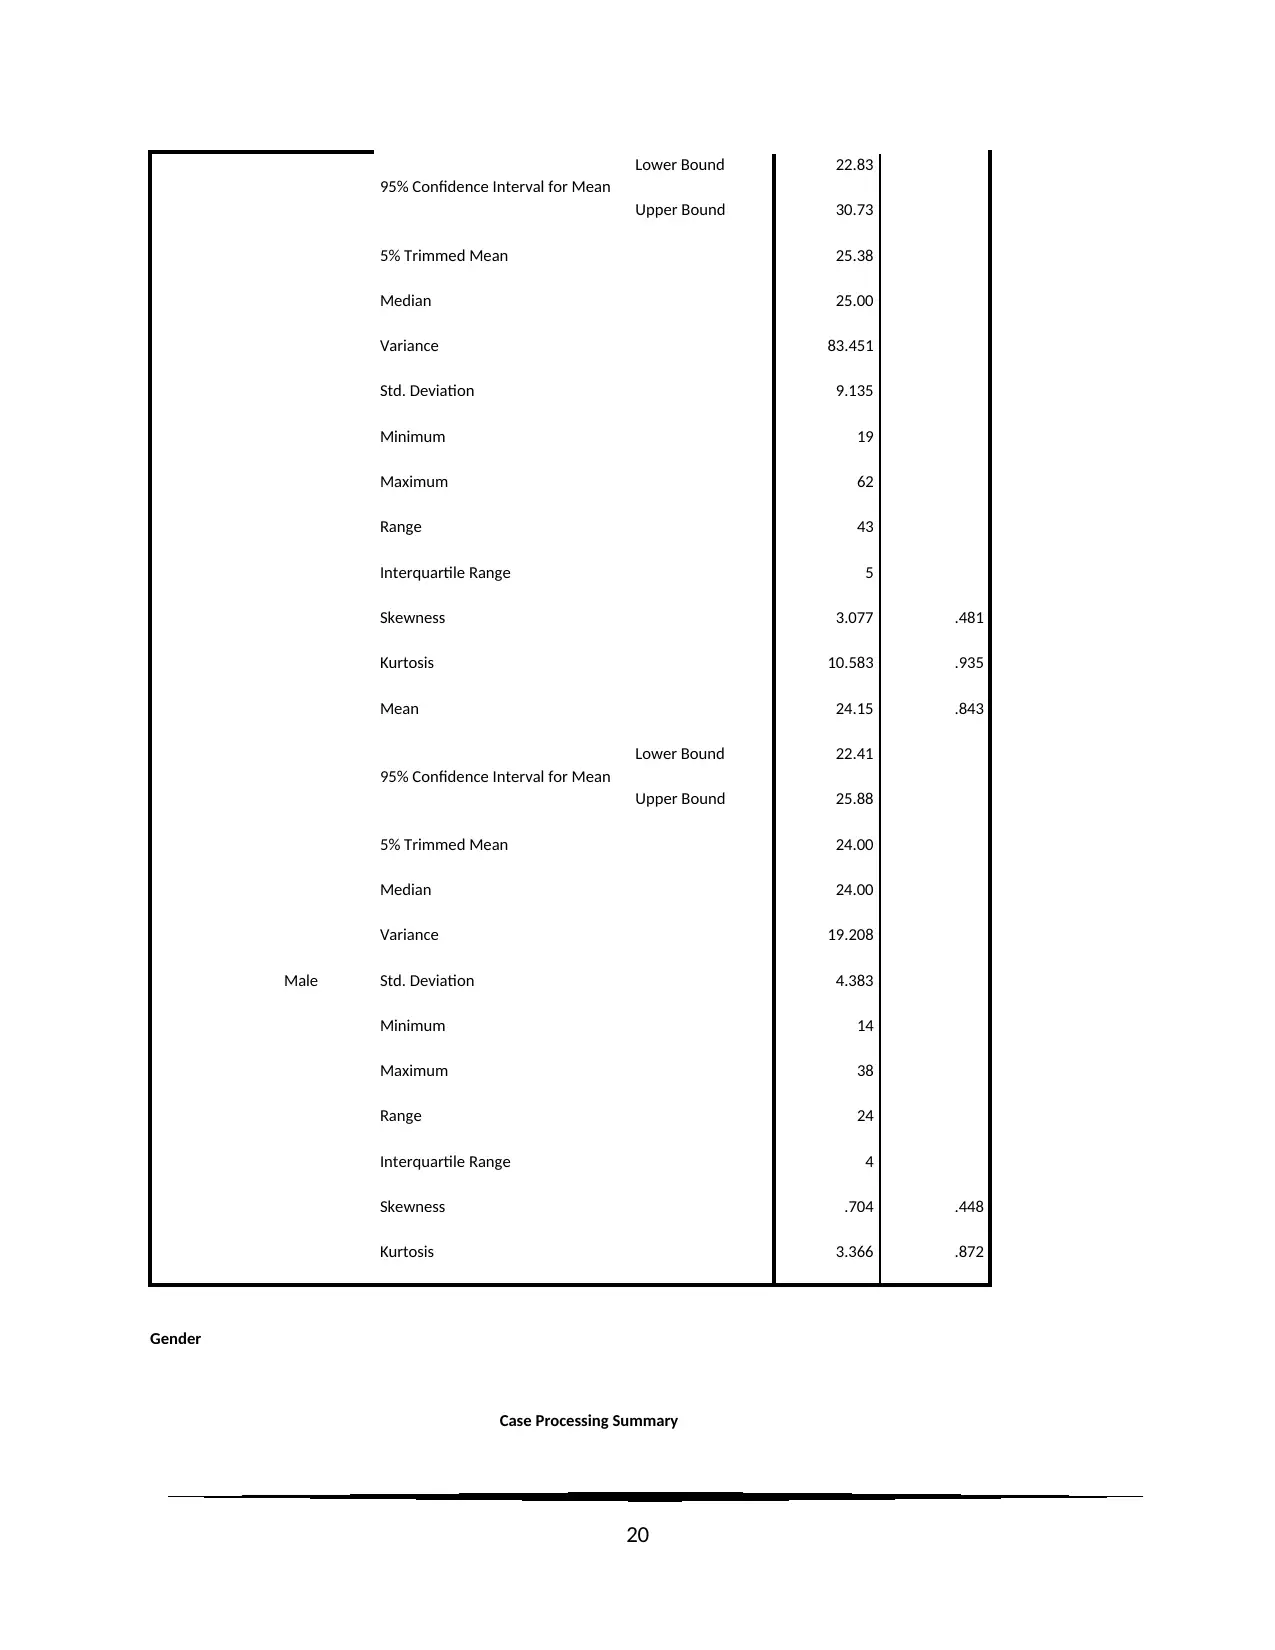
95% Confidence Interval for Mean
Lower Bound 22.83
Upper Bound 30.73
5% Trimmed Mean 25.38
Median 25.00
Variance 83.451
Std. Deviation 9.135
Minimum 19
Maximum 62
Range 43
Interquartile Range 5
Skewness 3.077 .481
Kurtosis 10.583 .935
Male
Mean 24.15 .843
95% Confidence Interval for Mean
Lower Bound 22.41
Upper Bound 25.88
5% Trimmed Mean 24.00
Median 24.00
Variance 19.208
Std. Deviation 4.383
Minimum 14
Maximum 38
Range 24
Interquartile Range 4
Skewness .704 .448
Kurtosis 3.366 .872
Gender
Case Processing Summary
20
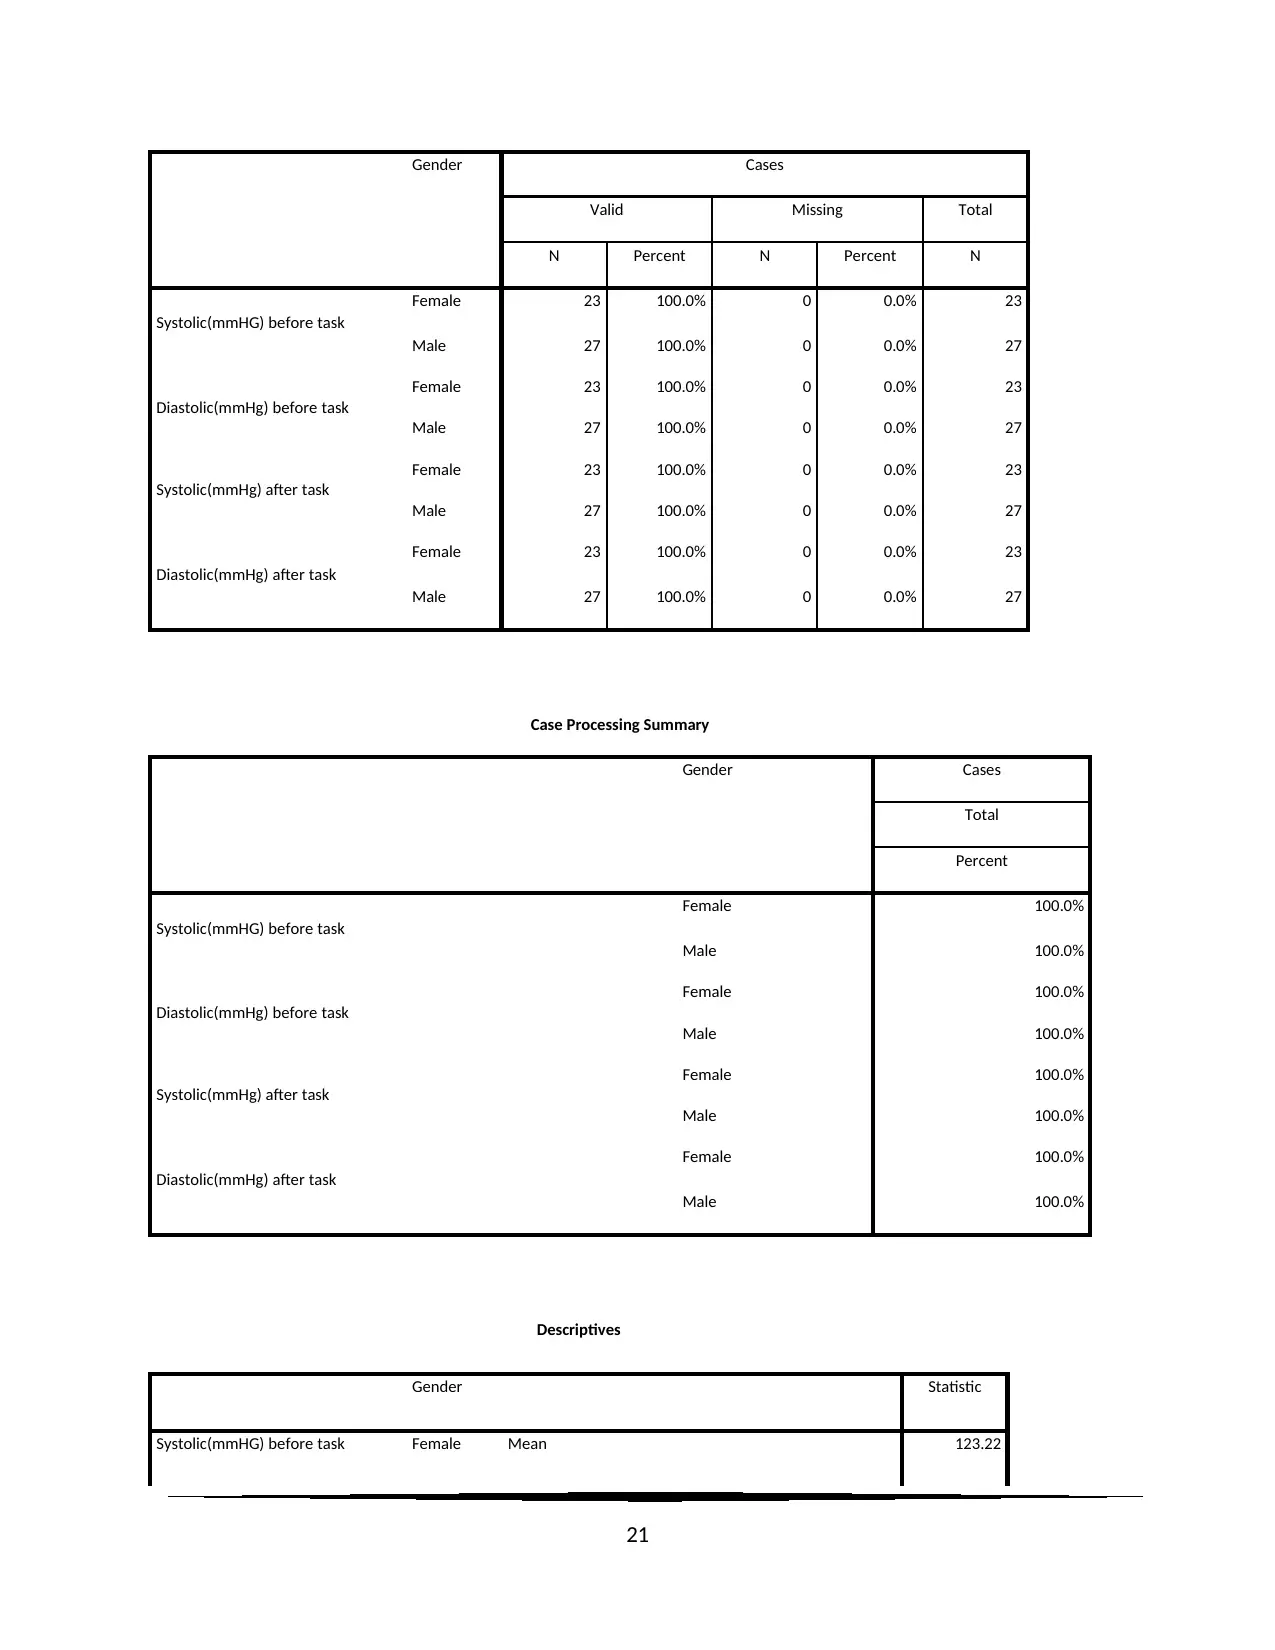
Gender Cases
Valid Missing Total
N Percent N Percent N
Systolic(mmHG) before task
Female 23 100.0% 0 0.0% 23
Male 27 100.0% 0 0.0% 27
Diastolic(mmHg) before task
Female 23 100.0% 0 0.0% 23
Male 27 100.0% 0 0.0% 27
Systolic(mmHg) after task
Female 23 100.0% 0 0.0% 23
Male 27 100.0% 0 0.0% 27
Diastolic(mmHg) after task
Female 23 100.0% 0 0.0% 23
Male 27 100.0% 0 0.0% 27
Case Processing Summary
Gender Cases
Total
Percent
Systolic(mmHG) before task
Female 100.0%
Male 100.0%
Diastolic(mmHg) before task
Female 100.0%
Male 100.0%
Systolic(mmHg) after task
Female 100.0%
Male 100.0%
Diastolic(mmHg) after task
Female 100.0%
Male 100.0%
Descriptives
Gender Statistic
Systolic(mmHG) before task Female Mean 123.22
21
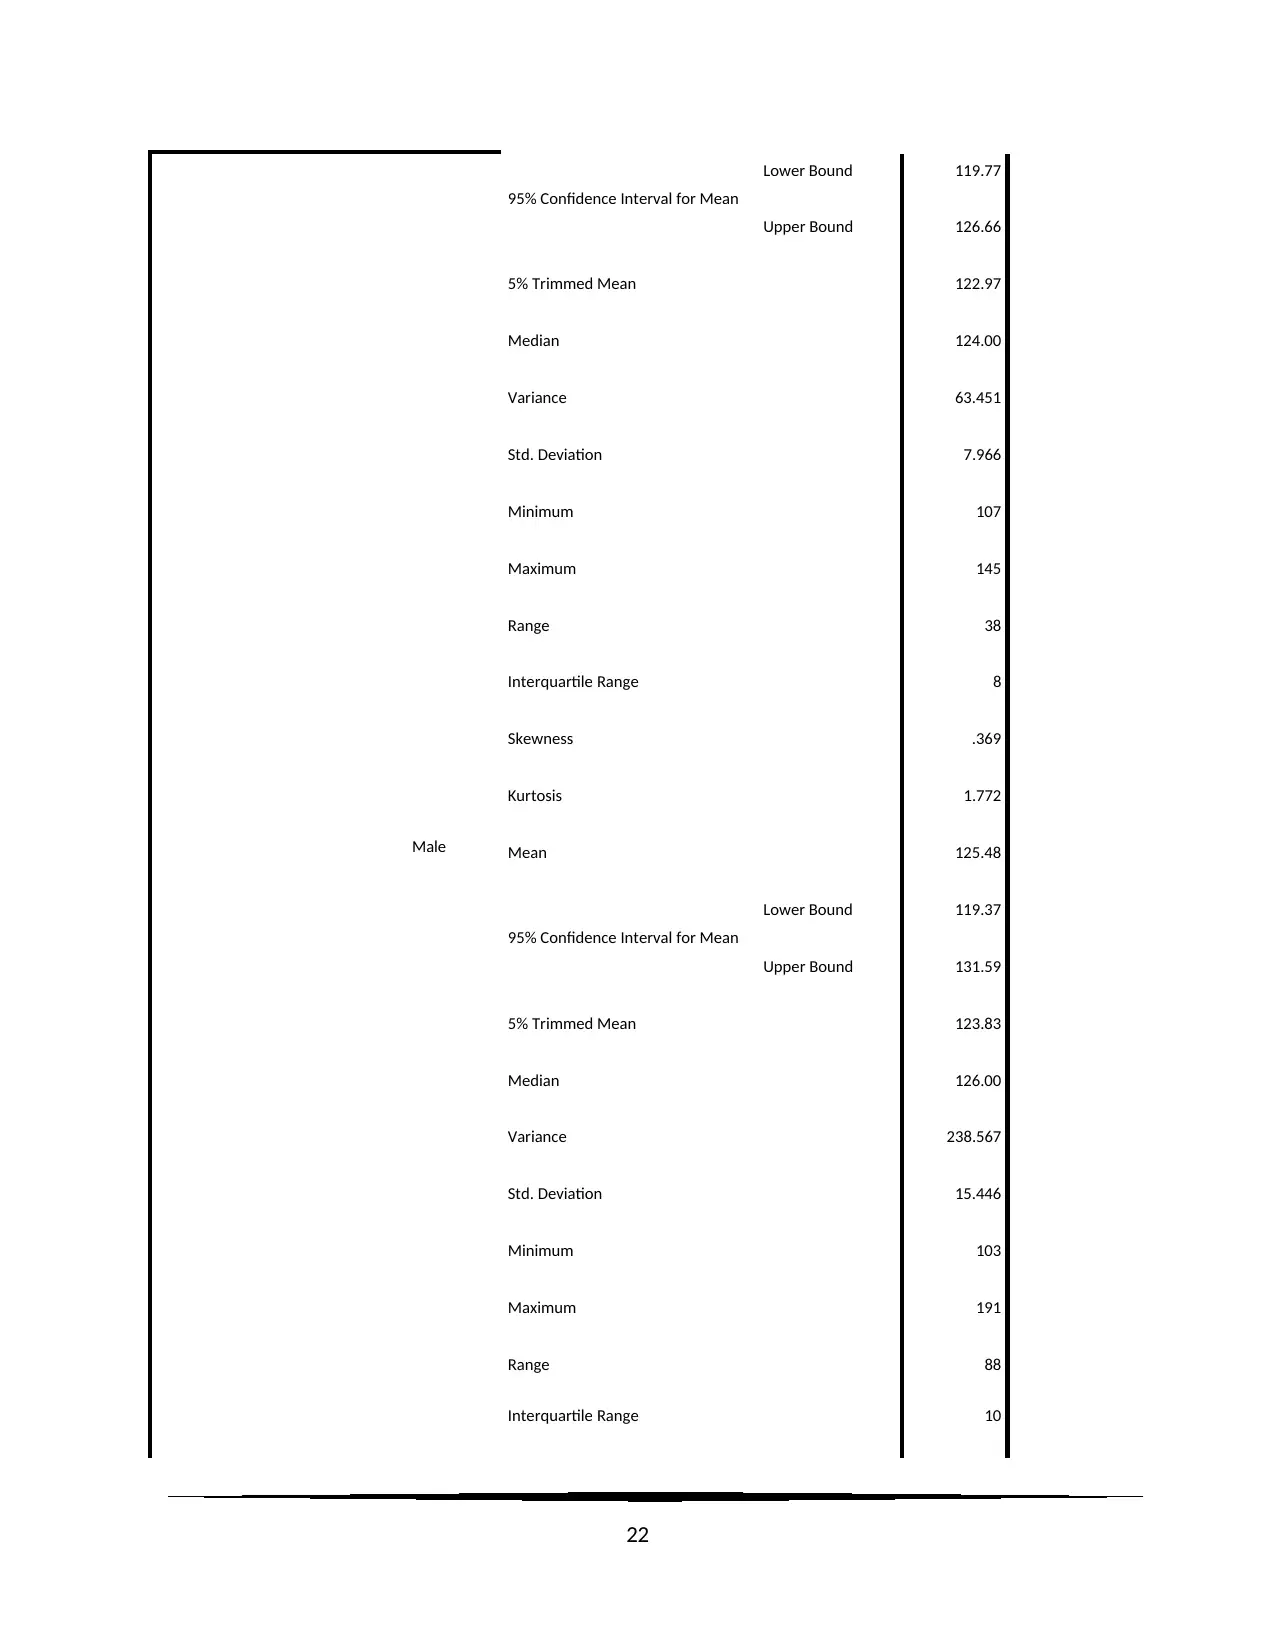
95% Confidence Interval for Mean
Lower Bound 119.77
Upper Bound 126.66
5% Trimmed Mean 122.97
Median 124.00
Variance 63.451
Std. Deviation 7.966
Minimum 107
Maximum 145
Range 38
Interquartile Range 8
Skewness .369
Kurtosis 1.772
Male Mean 125.48
95% Confidence Interval for Mean
Lower Bound 119.37
Upper Bound 131.59
5% Trimmed Mean 123.83
Median 126.00
Variance 238.567
Std. Deviation 15.446
Minimum 103
Maximum 191
Range 88
Interquartile Range 10
22
Secure Best Marks with AI Grader
Need help grading? Try our AI Grader for instant feedback on your assignments.
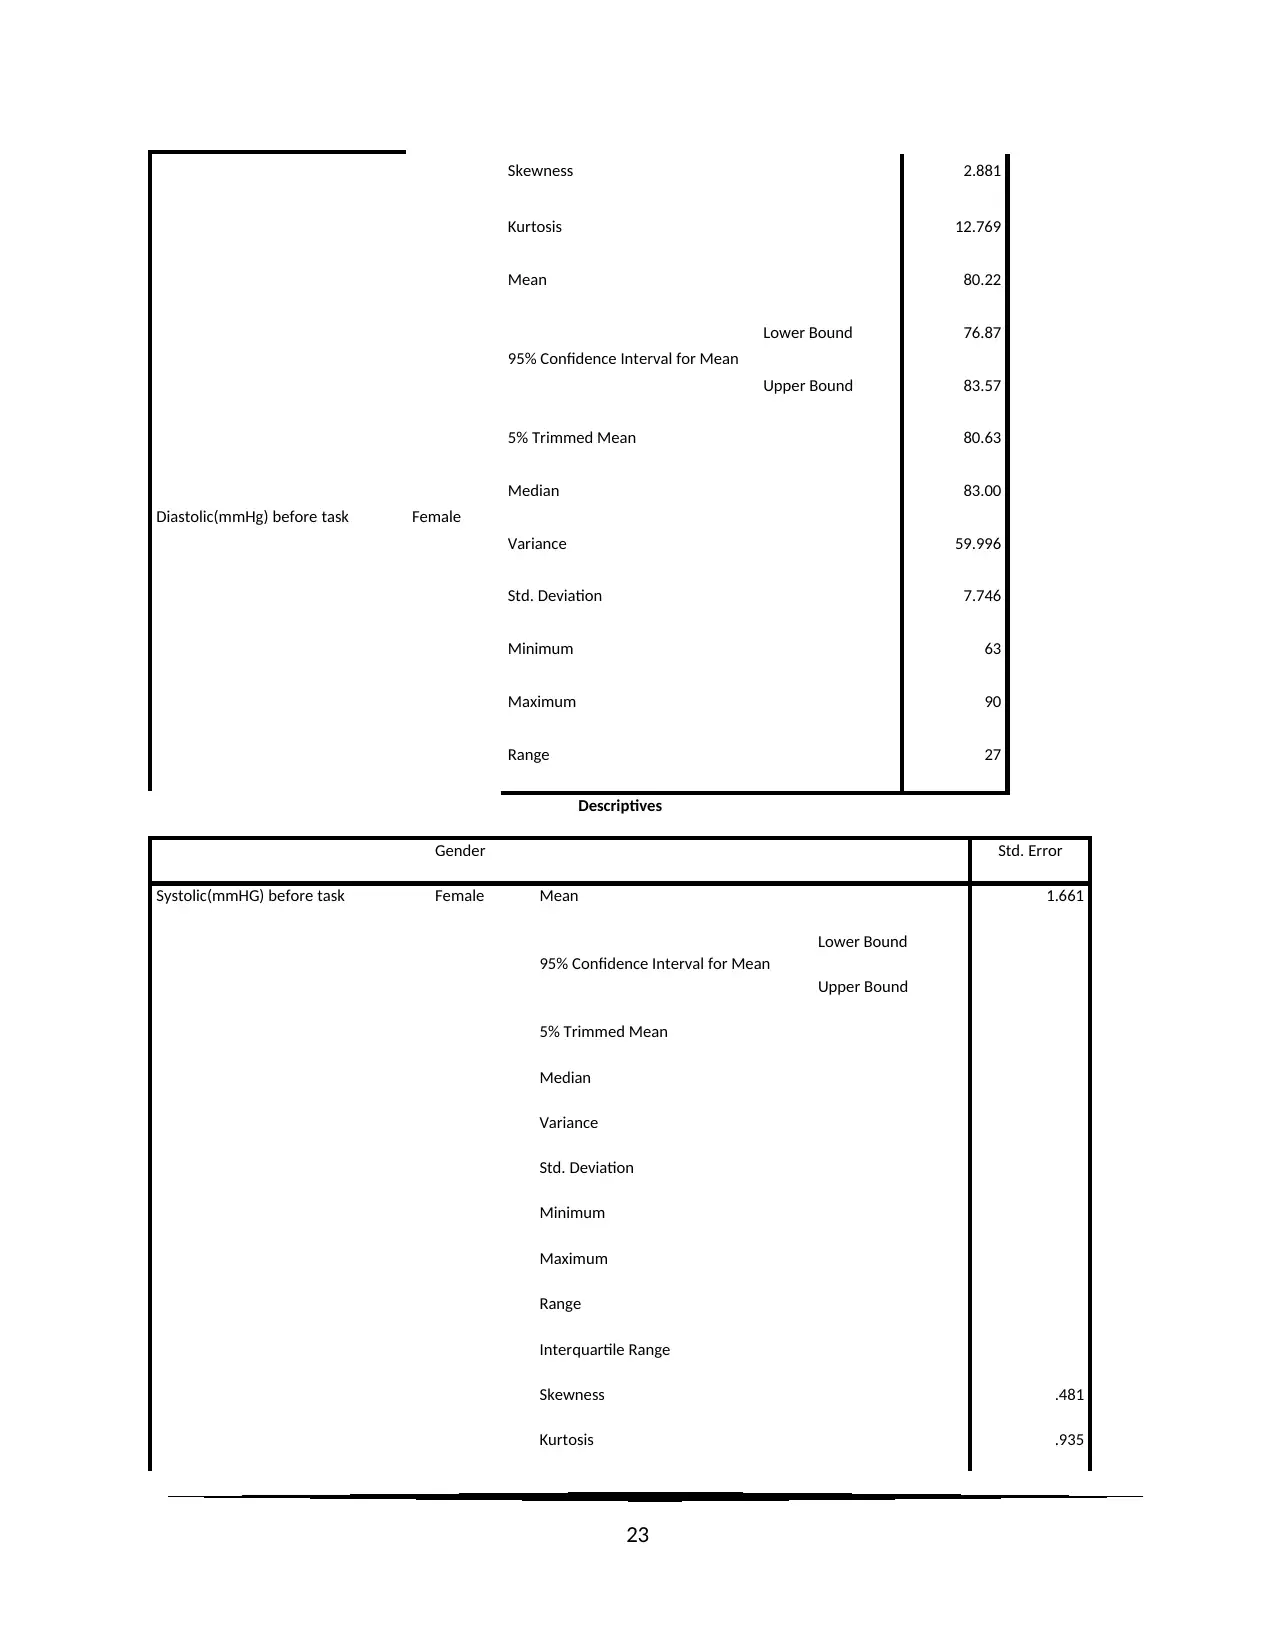
Skewness 2.881
Kurtosis 12.769
Diastolic(mmHg) before task Female
Mean 80.22
95% Confidence Interval for Mean
Lower Bound 76.87
Upper Bound 83.57
5% Trimmed Mean 80.63
Median 83.00
Variance 59.996
Std. Deviation 7.746
Minimum 63
Maximum 90
Range 27
Descriptives
Gender Std. Error
Systolic(mmHG) before task Female Mean 1.661
95% Confidence Interval for Mean
Lower Bound
Upper Bound
5% Trimmed Mean
Median
Variance
Std. Deviation
Minimum
Maximum
Range
Interquartile Range
Skewness .481
Kurtosis .935
23
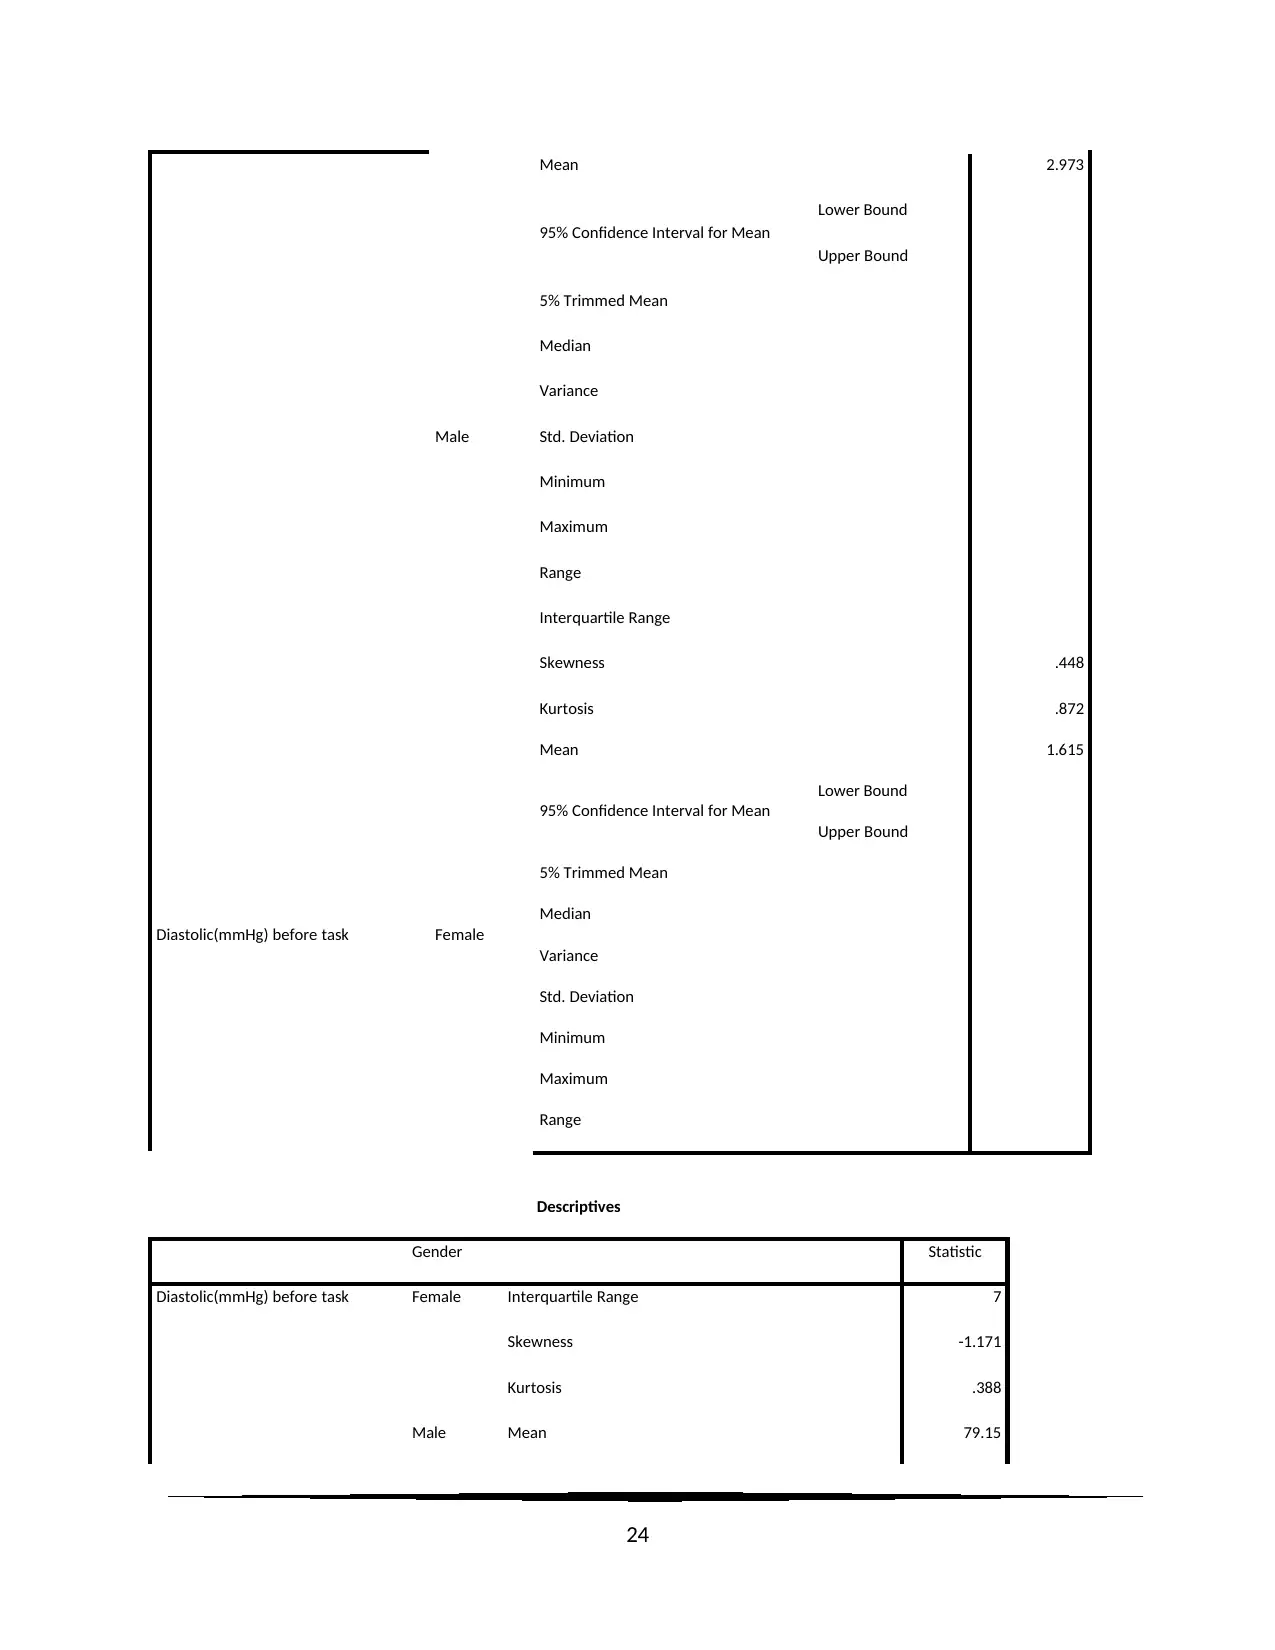
Male
Mean 2.973
95% Confidence Interval for Mean
Lower Bound
Upper Bound
5% Trimmed Mean
Median
Variance
Std. Deviation
Minimum
Maximum
Range
Interquartile Range
Skewness .448
Kurtosis .872
Diastolic(mmHg) before task Female
Mean 1.615
95% Confidence Interval for Mean
Lower Bound
Upper Bound
5% Trimmed Mean
Median
Variance
Std. Deviation
Minimum
Maximum
Range
Descriptives
Gender Statistic
Diastolic(mmHg) before task Female Interquartile Range 7
Skewness -1.171
Kurtosis .388
Male Mean 79.15
24
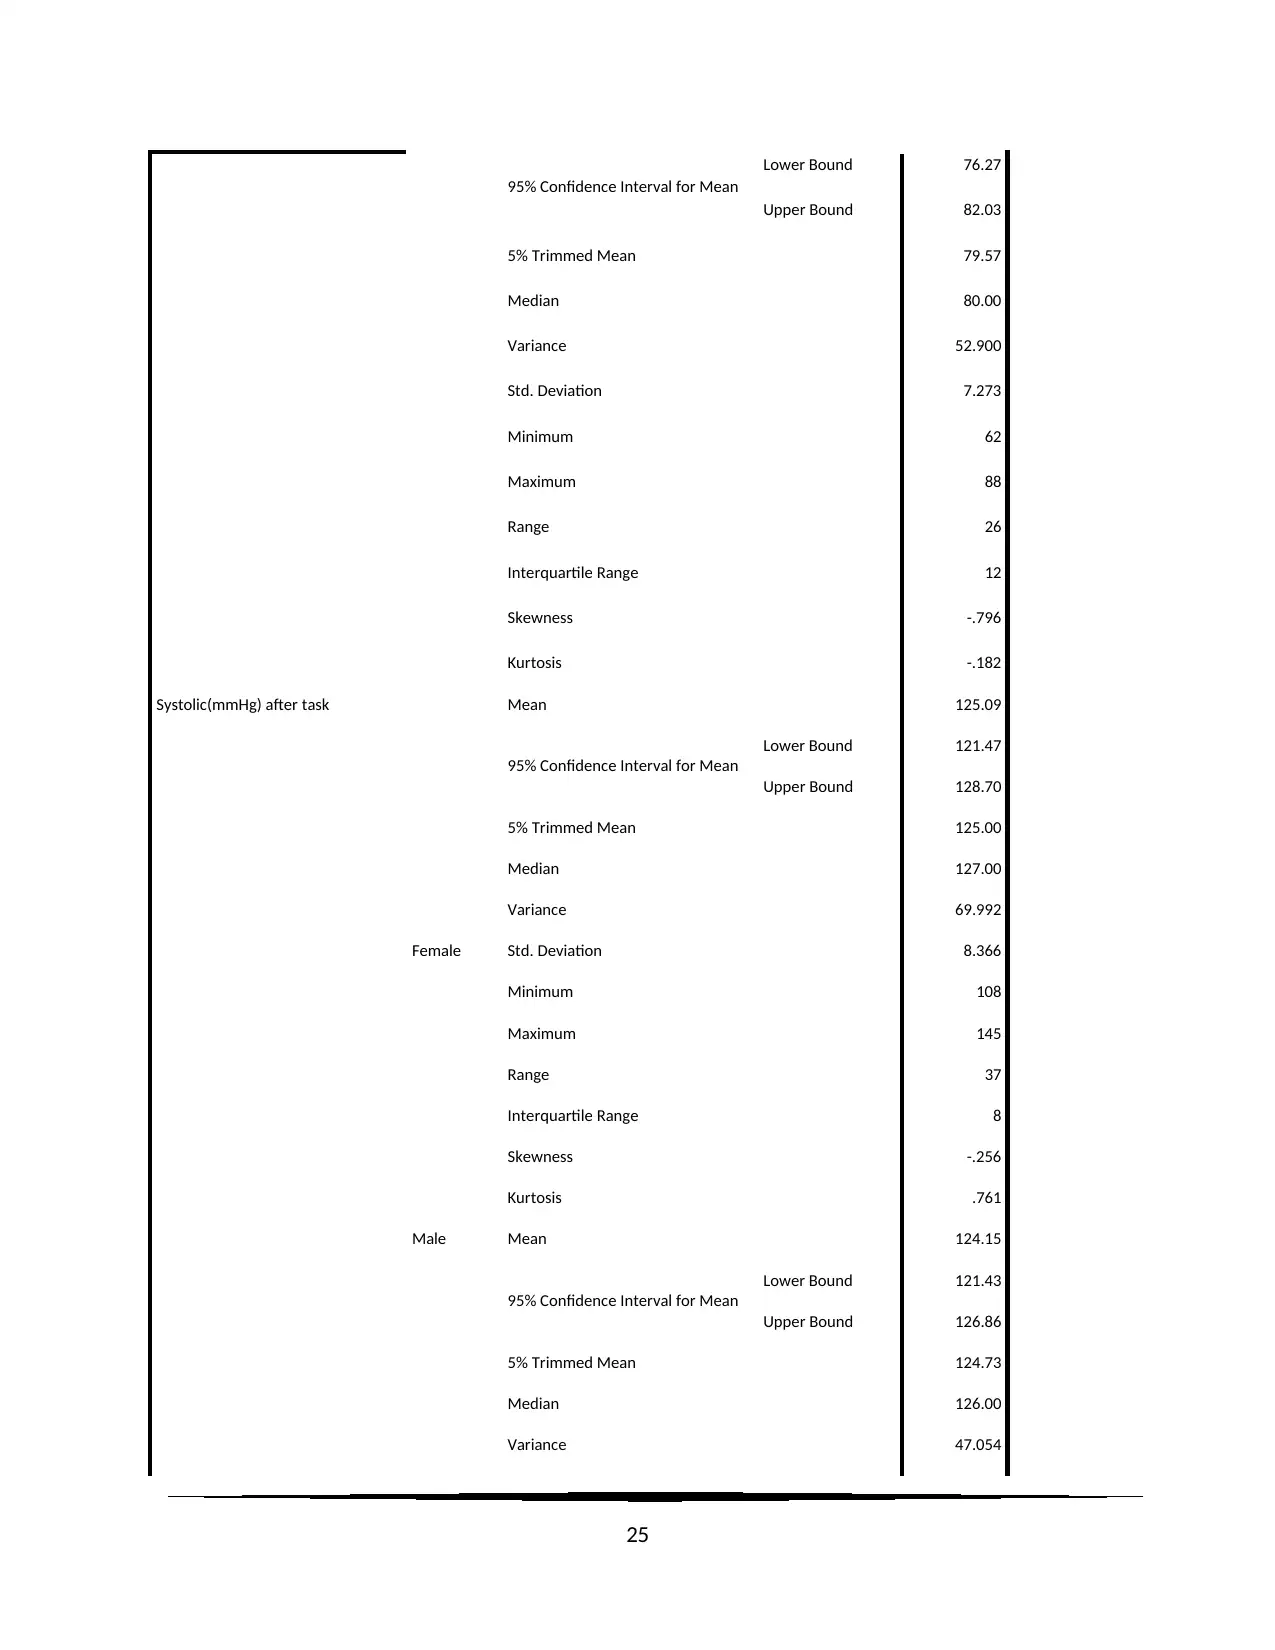
95% Confidence Interval for Mean
Lower Bound 76.27
Upper Bound 82.03
5% Trimmed Mean 79.57
Median 80.00
Variance 52.900
Std. Deviation 7.273
Minimum 62
Maximum 88
Range 26
Interquartile Range 12
Skewness -.796
Kurtosis -.182
Systolic(mmHg) after task
Female
Mean 125.09
95% Confidence Interval for Mean
Lower Bound 121.47
Upper Bound 128.70
5% Trimmed Mean 125.00
Median 127.00
Variance 69.992
Std. Deviation 8.366
Minimum 108
Maximum 145
Range 37
Interquartile Range 8
Skewness -.256
Kurtosis .761
Male Mean 124.15
95% Confidence Interval for Mean
Lower Bound 121.43
Upper Bound 126.86
5% Trimmed Mean 124.73
Median 126.00
Variance 47.054
25
Paraphrase This Document
Need a fresh take? Get an instant paraphrase of this document with our AI Paraphraser
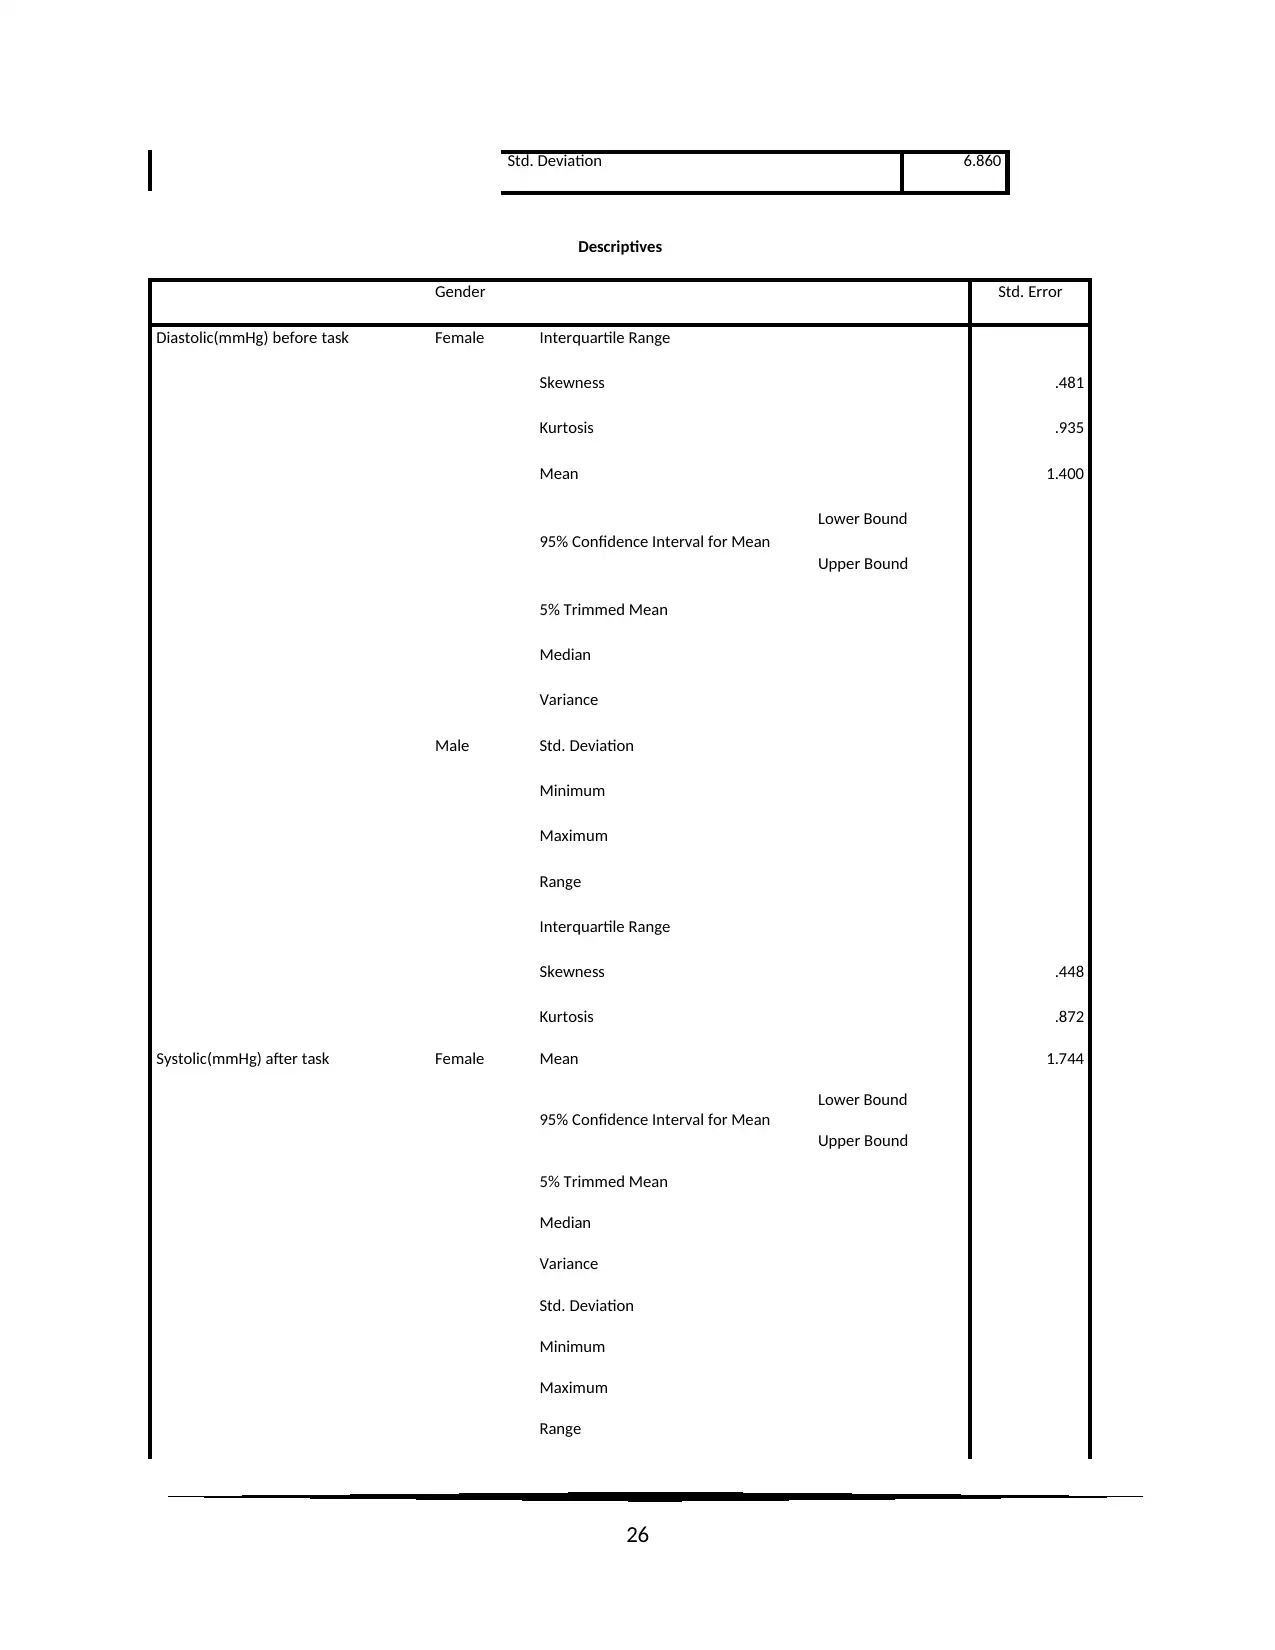
Std. Deviation 6.860
Descriptives
Gender Std. Error
Diastolic(mmHg) before task Female Interquartile Range
Skewness .481
Kurtosis .935
Male
Mean 1.400
95% Confidence Interval for Mean
Lower Bound
Upper Bound
5% Trimmed Mean
Median
Variance
Std. Deviation
Minimum
Maximum
Range
Interquartile Range
Skewness .448
Kurtosis .872
Systolic(mmHg) after task Female Mean 1.744
95% Confidence Interval for Mean
Lower Bound
Upper Bound
5% Trimmed Mean
Median
Variance
Std. Deviation
Minimum
Maximum
Range
26
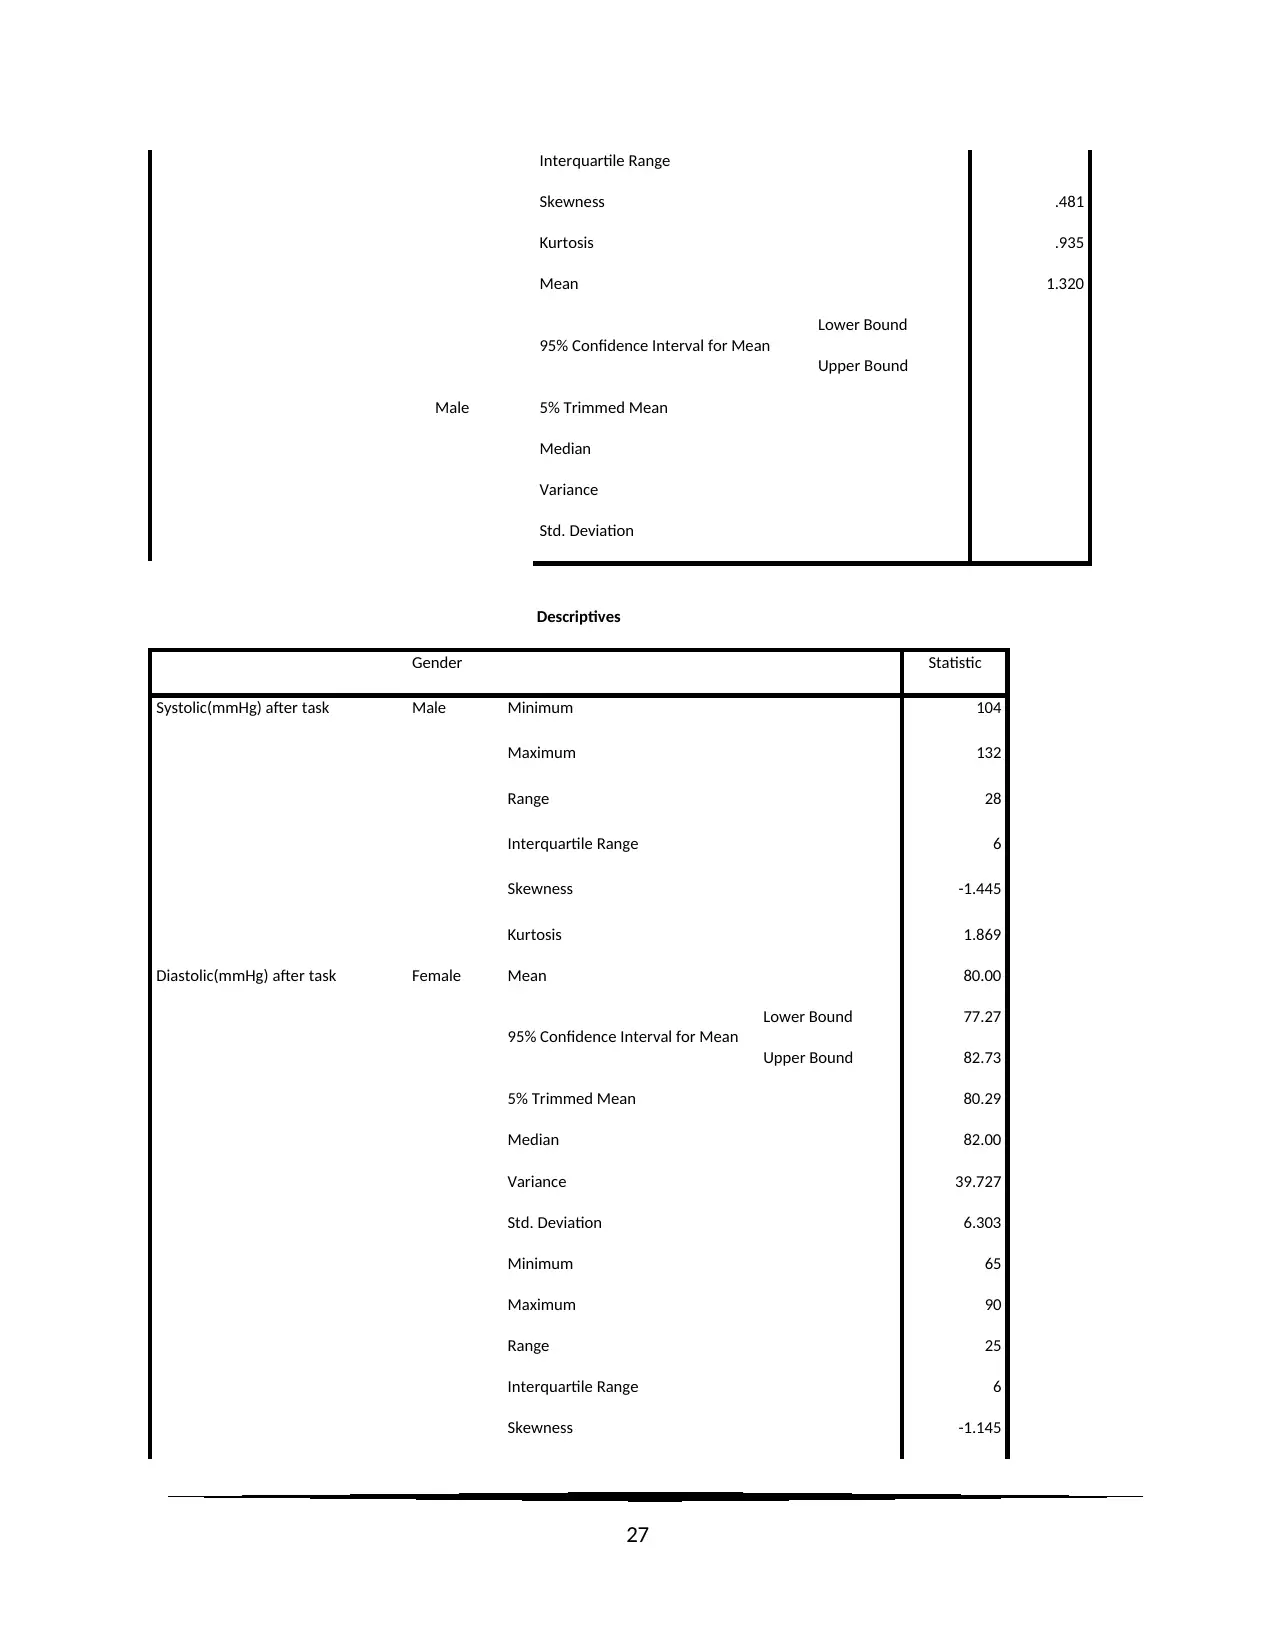
Interquartile Range
Skewness .481
Kurtosis .935
Male
Mean 1.320
95% Confidence Interval for Mean
Lower Bound
Upper Bound
5% Trimmed Mean
Median
Variance
Std. Deviation
Descriptives
Gender Statistic
Systolic(mmHg) after task Male Minimum 104
Maximum 132
Range 28
Interquartile Range 6
Skewness -1.445
Kurtosis 1.869
Diastolic(mmHg) after task Female Mean 80.00
95% Confidence Interval for Mean
Lower Bound 77.27
Upper Bound 82.73
5% Trimmed Mean 80.29
Median 82.00
Variance 39.727
Std. Deviation 6.303
Minimum 65
Maximum 90
Range 25
Interquartile Range 6
Skewness -1.145
27
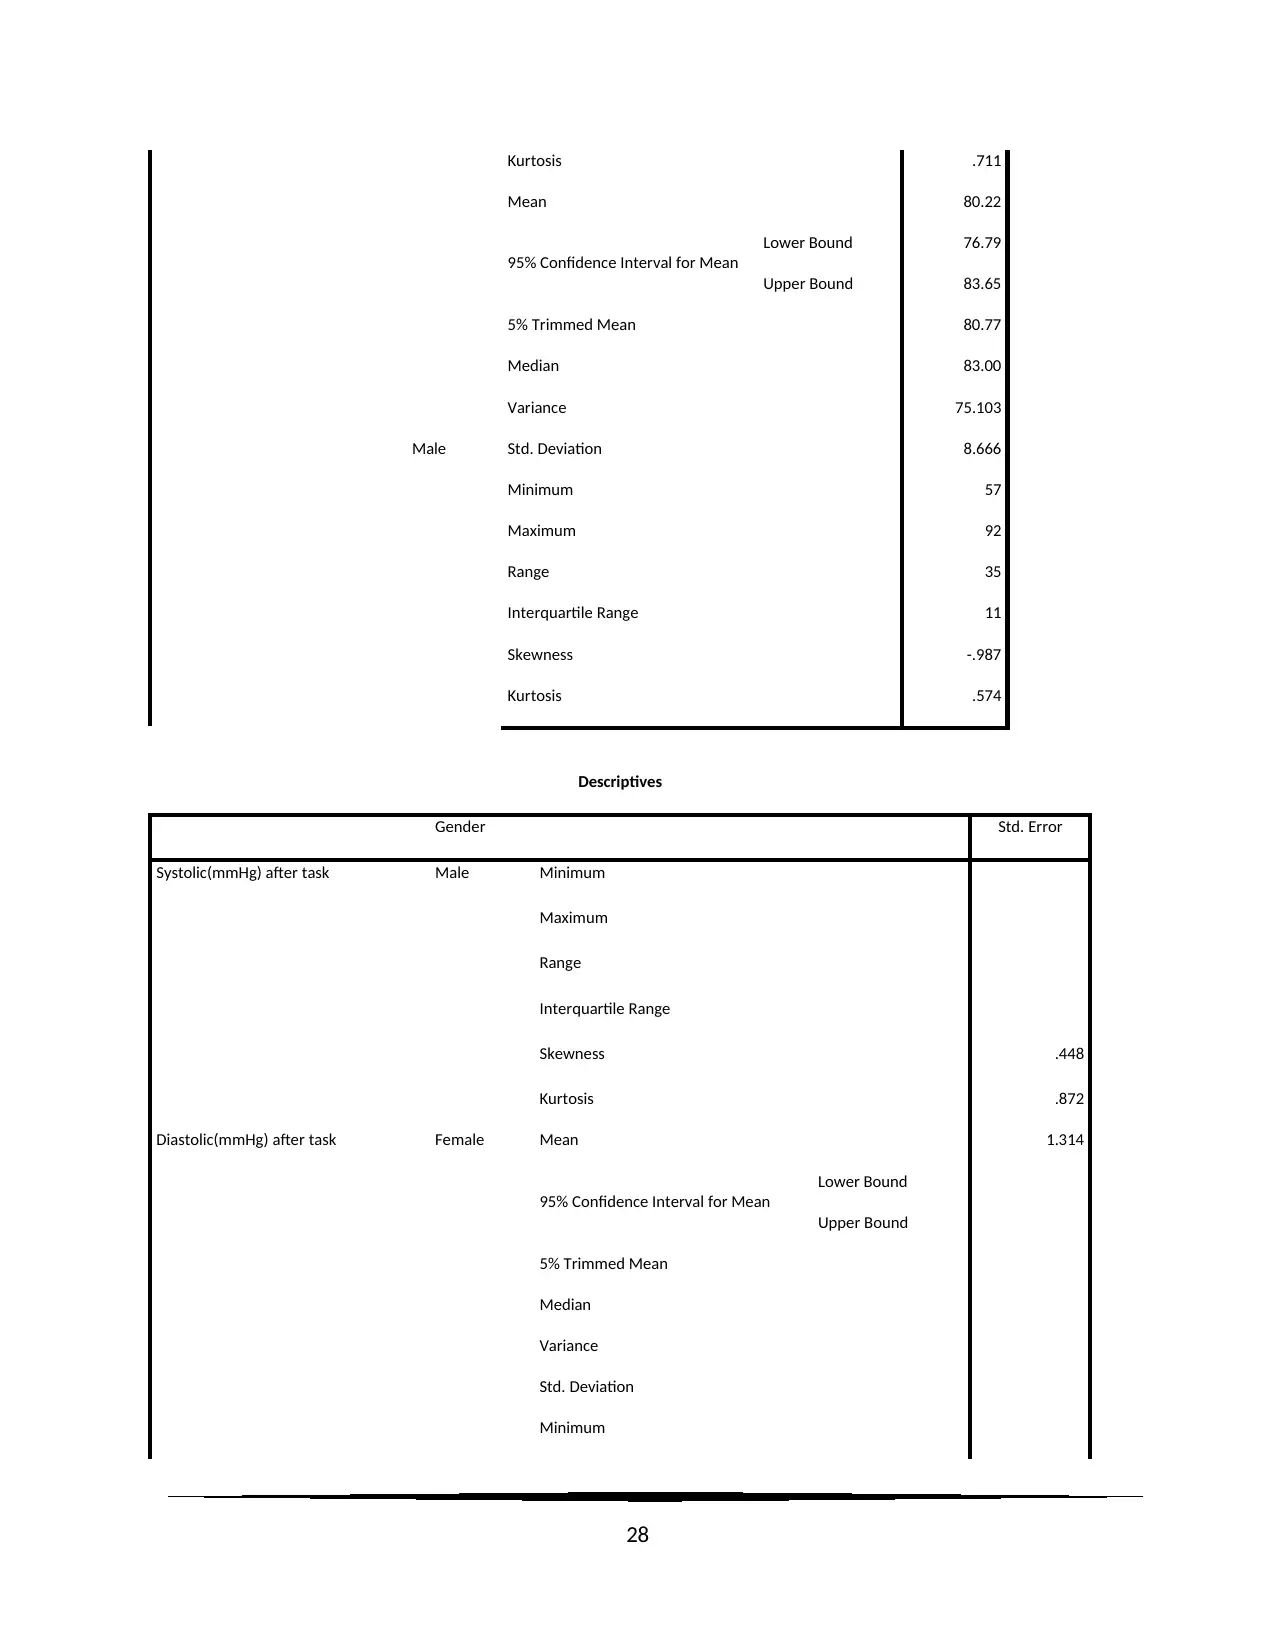
Kurtosis .711
Male
Mean 80.22
95% Confidence Interval for Mean
Lower Bound 76.79
Upper Bound 83.65
5% Trimmed Mean 80.77
Median 83.00
Variance 75.103
Std. Deviation 8.666
Minimum 57
Maximum 92
Range 35
Interquartile Range 11
Skewness -.987
Kurtosis .574
Descriptives
Gender Std. Error
Systolic(mmHg) after task Male Minimum
Maximum
Range
Interquartile Range
Skewness .448
Kurtosis .872
Diastolic(mmHg) after task Female Mean 1.314
95% Confidence Interval for Mean
Lower Bound
Upper Bound
5% Trimmed Mean
Median
Variance
Std. Deviation
Minimum
28
Secure Best Marks with AI Grader
Need help grading? Try our AI Grader for instant feedback on your assignments.
Maximum
Range
Interquartile Range
Skewness .481
Kurtosis .935
Male
Mean 1.668
95% Confidence Interval for Mean
Lower Bound
Upper Bound
5% Trimmed Mean
Median
Variance
Std. Deviation
Minimum
Maximum
Range
Interquartile Range
Skewness .448
Kurtosis .872
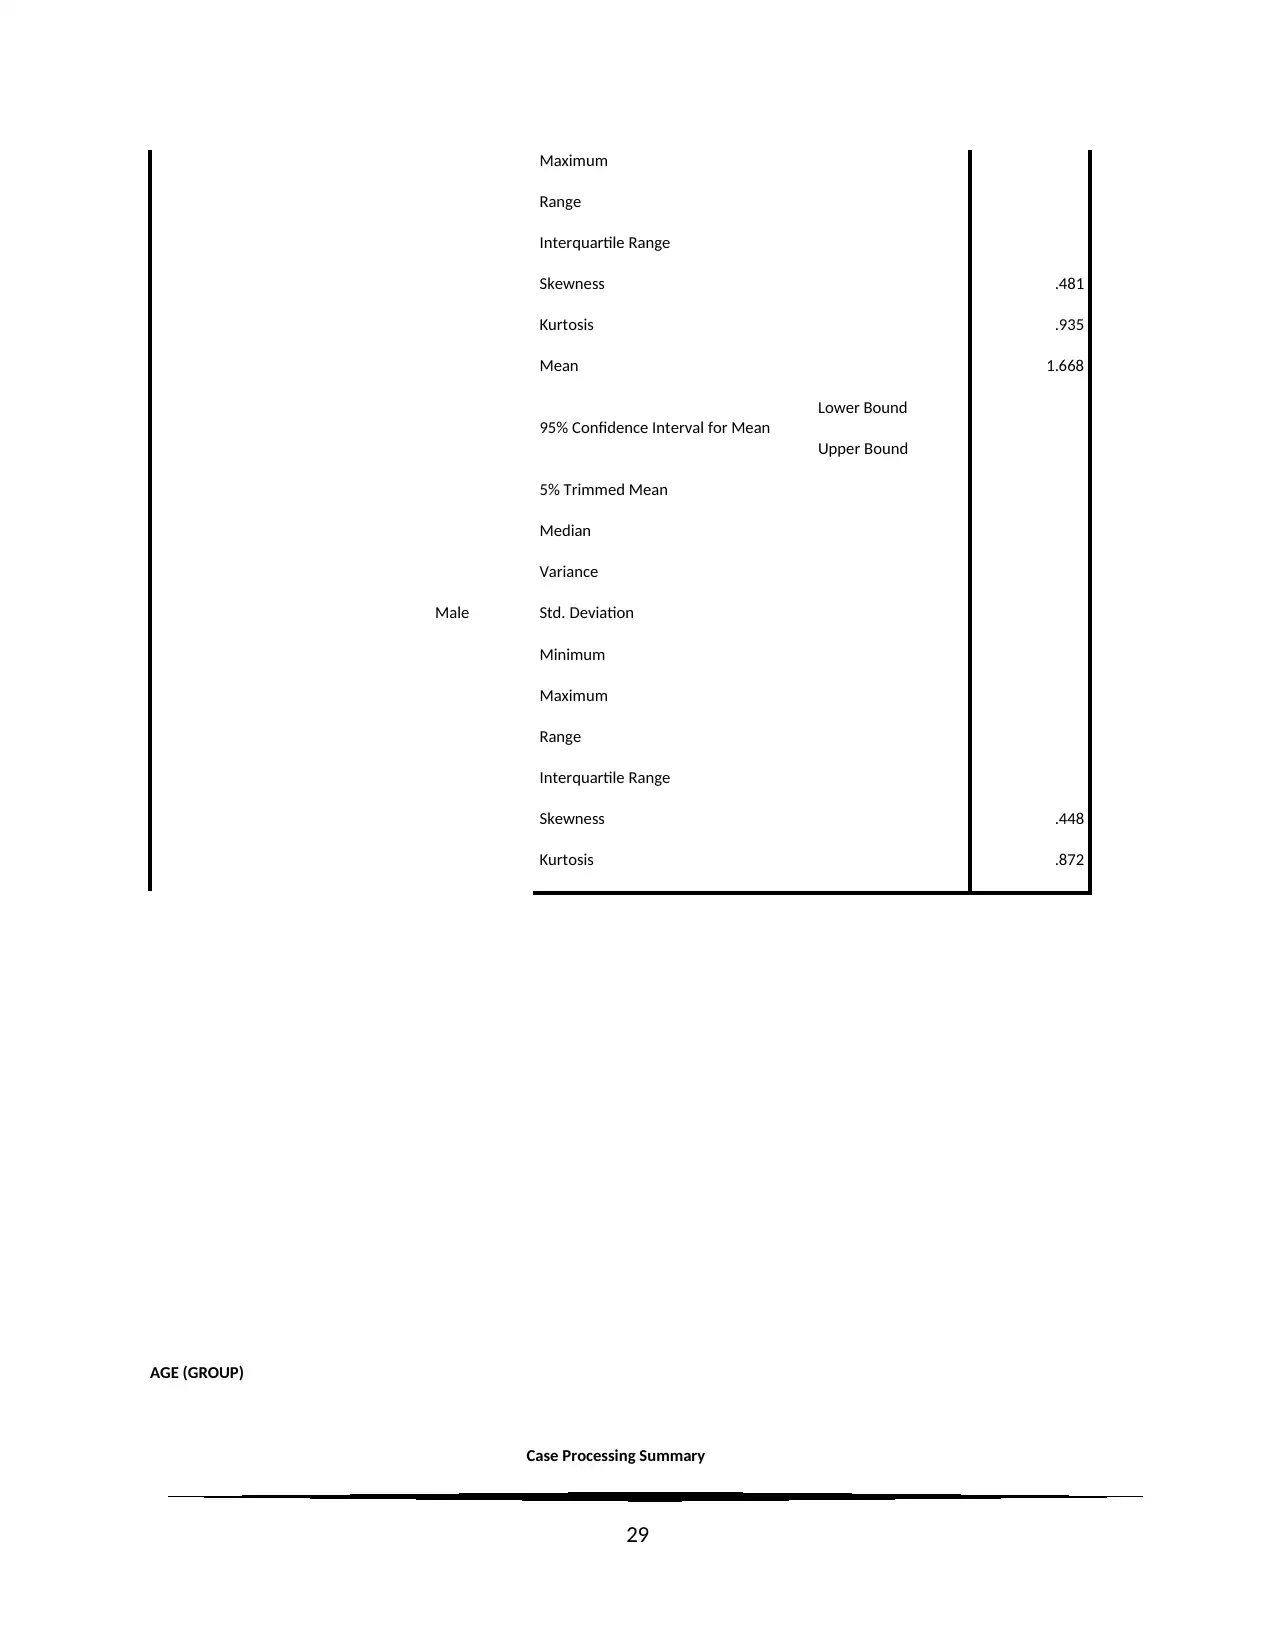
AGE (GROUP)
Case Processing Summary
29
Range
Interquartile Range
Skewness .481
Kurtosis .935
Male
Mean 1.668
95% Confidence Interval for Mean
Lower Bound
Upper Bound
5% Trimmed Mean
Median
Variance
Std. Deviation
Minimum
Maximum
Range
Interquartile Range
Skewness .448
Kurtosis .872
AGE (GROUP)
Case Processing Summary
29
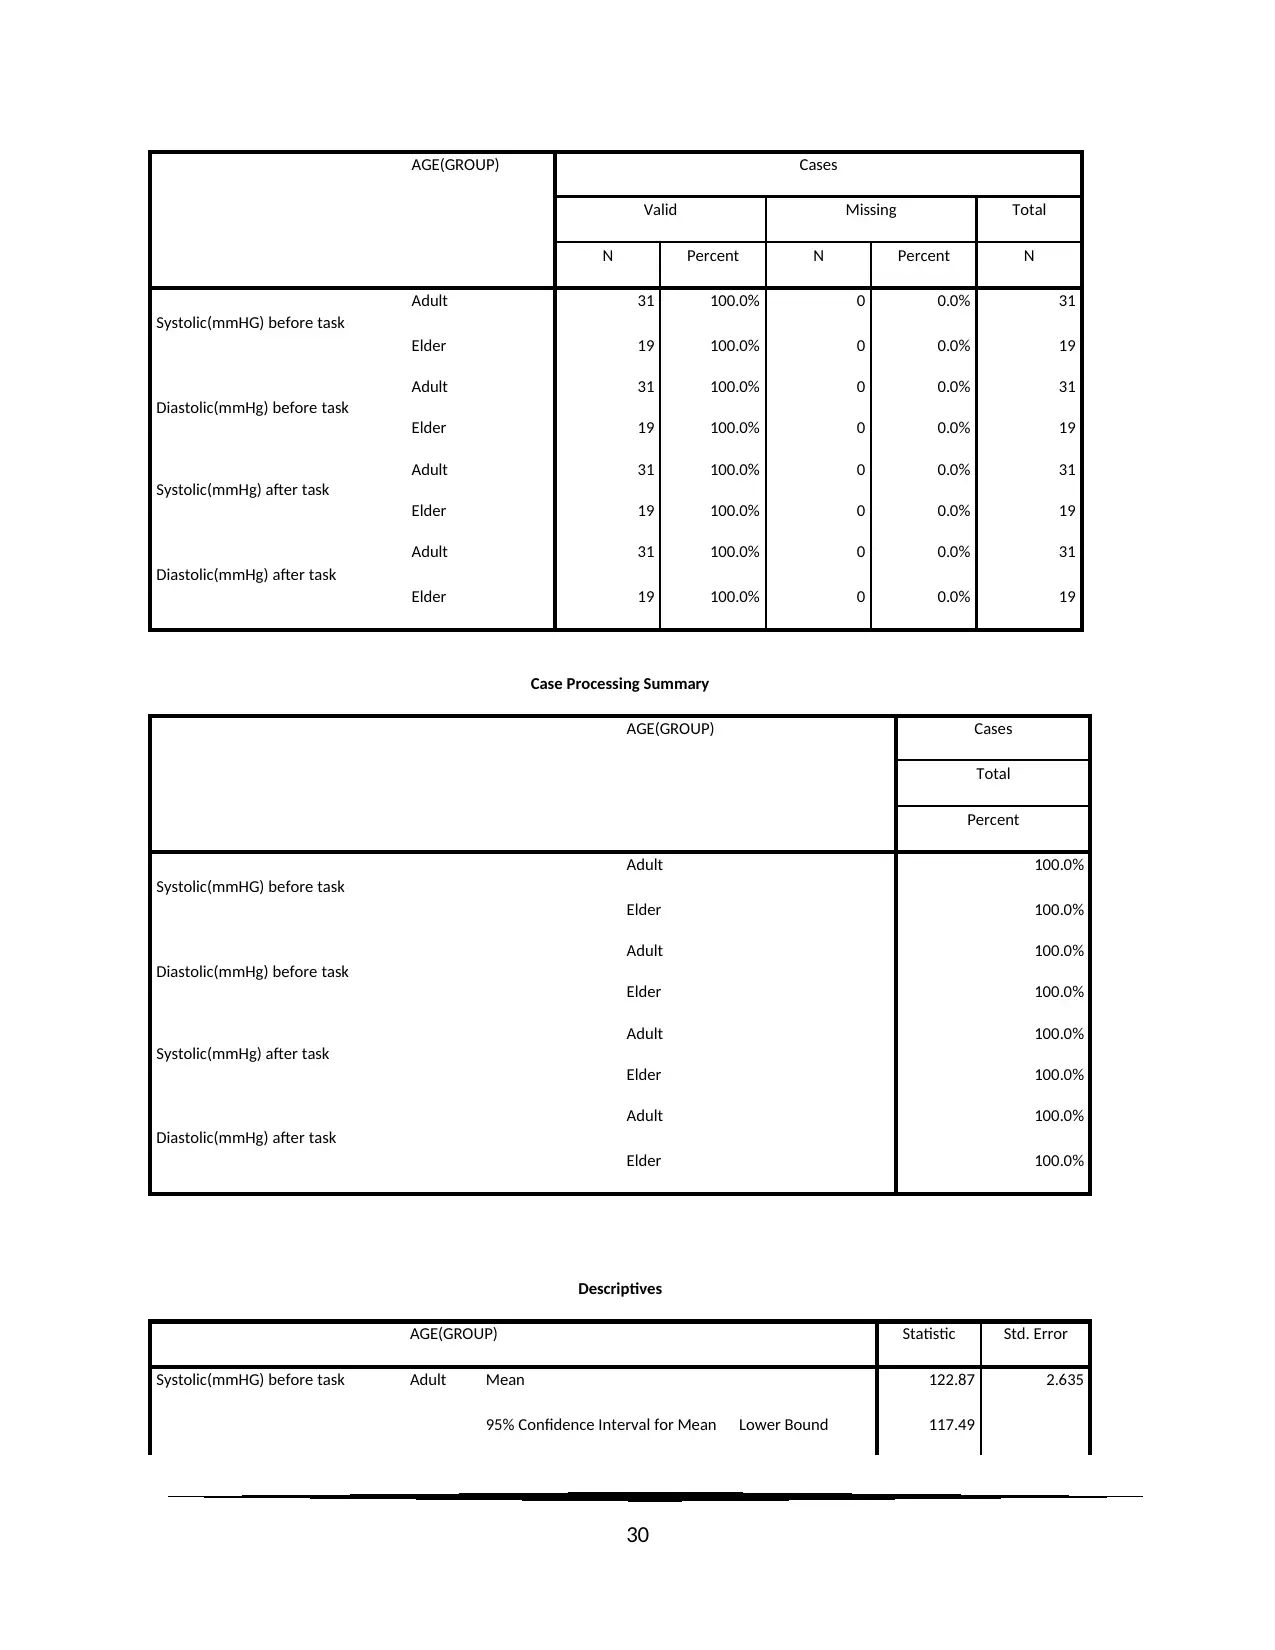
AGE(GROUP) Cases
Valid Missing Total
N Percent N Percent N
Systolic(mmHG) before task
Adult 31 100.0% 0 0.0% 31
Elder 19 100.0% 0 0.0% 19
Diastolic(mmHg) before task
Adult 31 100.0% 0 0.0% 31
Elder 19 100.0% 0 0.0% 19
Systolic(mmHg) after task
Adult 31 100.0% 0 0.0% 31
Elder 19 100.0% 0 0.0% 19
Diastolic(mmHg) after task
Adult 31 100.0% 0 0.0% 31
Elder 19 100.0% 0 0.0% 19
Case Processing Summary
AGE(GROUP) Cases
Total
Percent
Systolic(mmHG) before task
Adult 100.0%
Elder 100.0%
Diastolic(mmHg) before task
Adult 100.0%
Elder 100.0%
Systolic(mmHg) after task
Adult 100.0%
Elder 100.0%
Diastolic(mmHg) after task
Adult 100.0%
Elder 100.0%
Descriptives
AGE(GROUP) Statistic Std. Error
Systolic(mmHG) before task Adult Mean 122.87 2.635
95% Confidence Interval for Mean Lower Bound 117.49
30
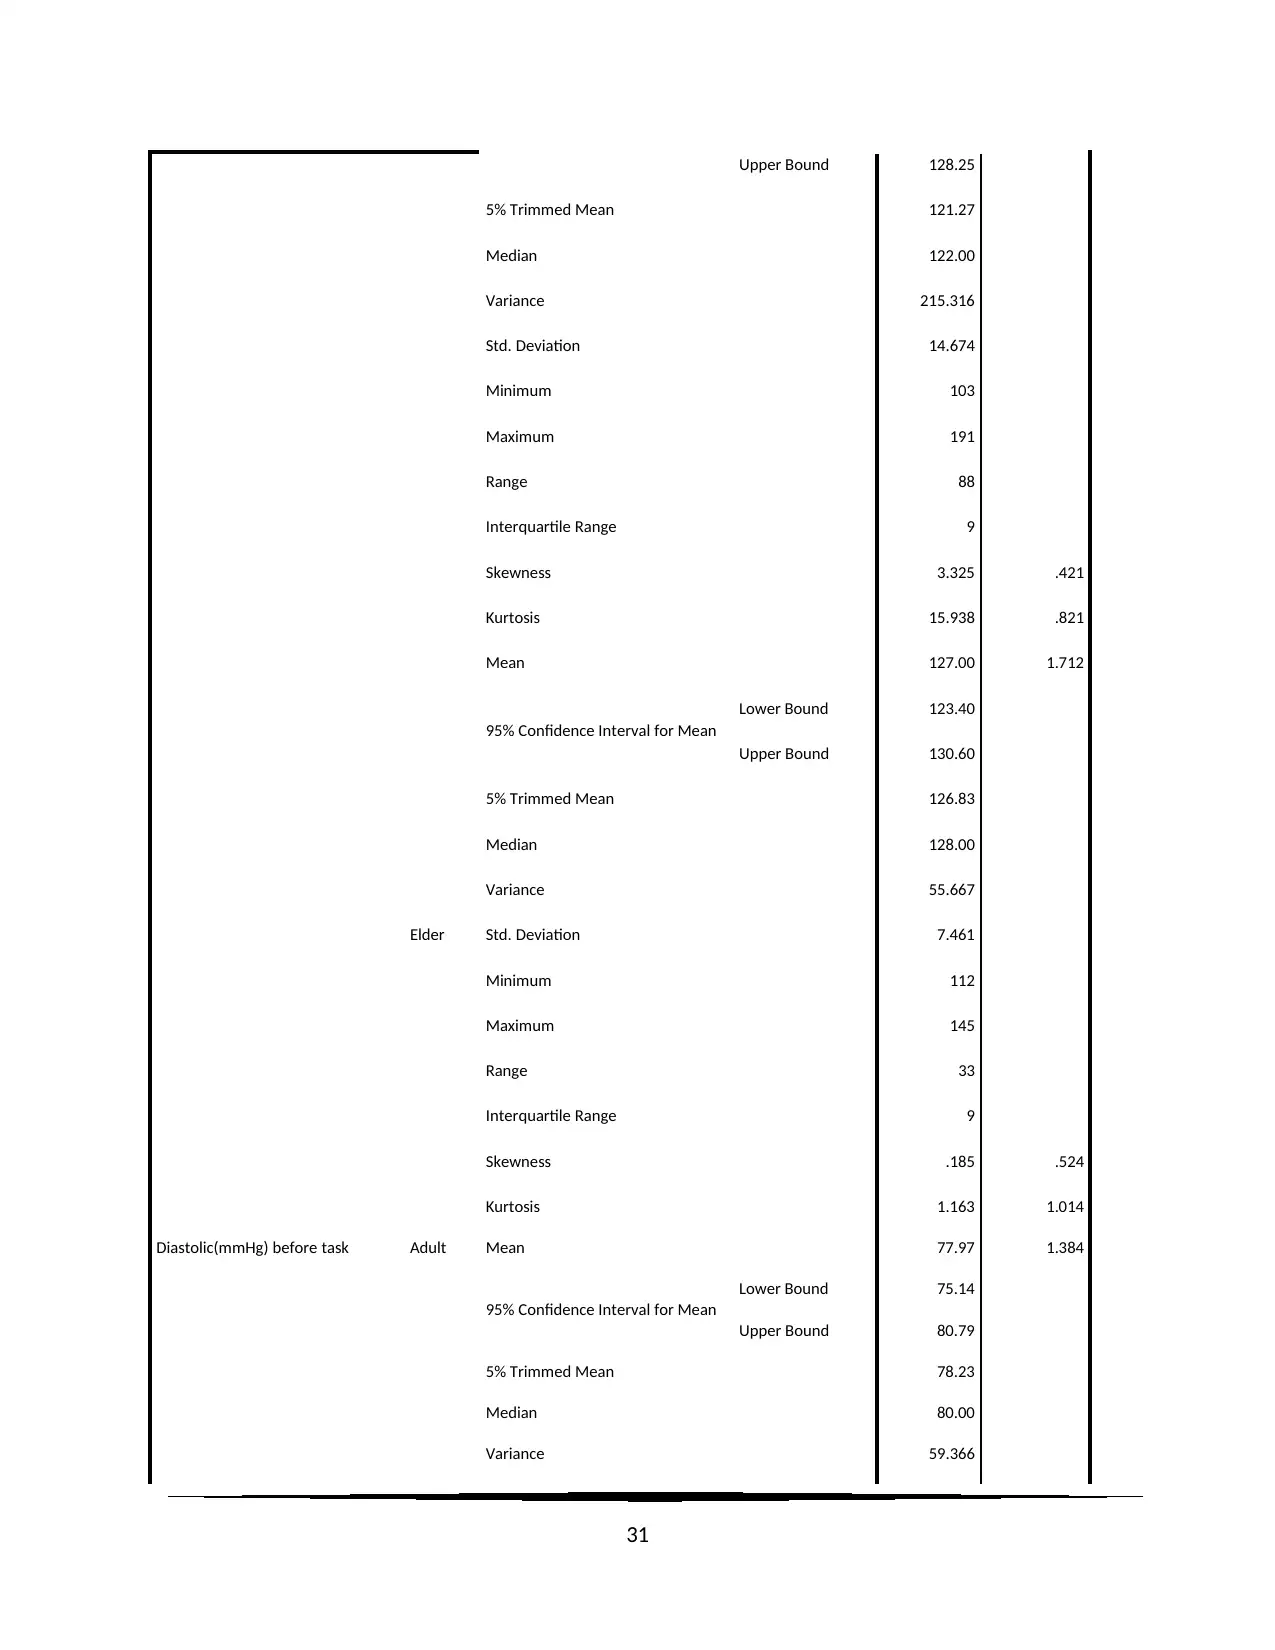
Upper Bound 128.25
5% Trimmed Mean 121.27
Median 122.00
Variance 215.316
Std. Deviation 14.674
Minimum 103
Maximum 191
Range 88
Interquartile Range 9
Skewness 3.325 .421
Kurtosis 15.938 .821
Elder
Mean 127.00 1.712
95% Confidence Interval for Mean
Lower Bound 123.40
Upper Bound 130.60
5% Trimmed Mean 126.83
Median 128.00
Variance 55.667
Std. Deviation 7.461
Minimum 112
Maximum 145
Range 33
Interquartile Range 9
Skewness .185 .524
Kurtosis 1.163 1.014
Diastolic(mmHg) before task Adult Mean 77.97 1.384
95% Confidence Interval for Mean
Lower Bound 75.14
Upper Bound 80.79
5% Trimmed Mean 78.23
Median 80.00
Variance 59.366
31
Paraphrase This Document
Need a fresh take? Get an instant paraphrase of this document with our AI Paraphraser
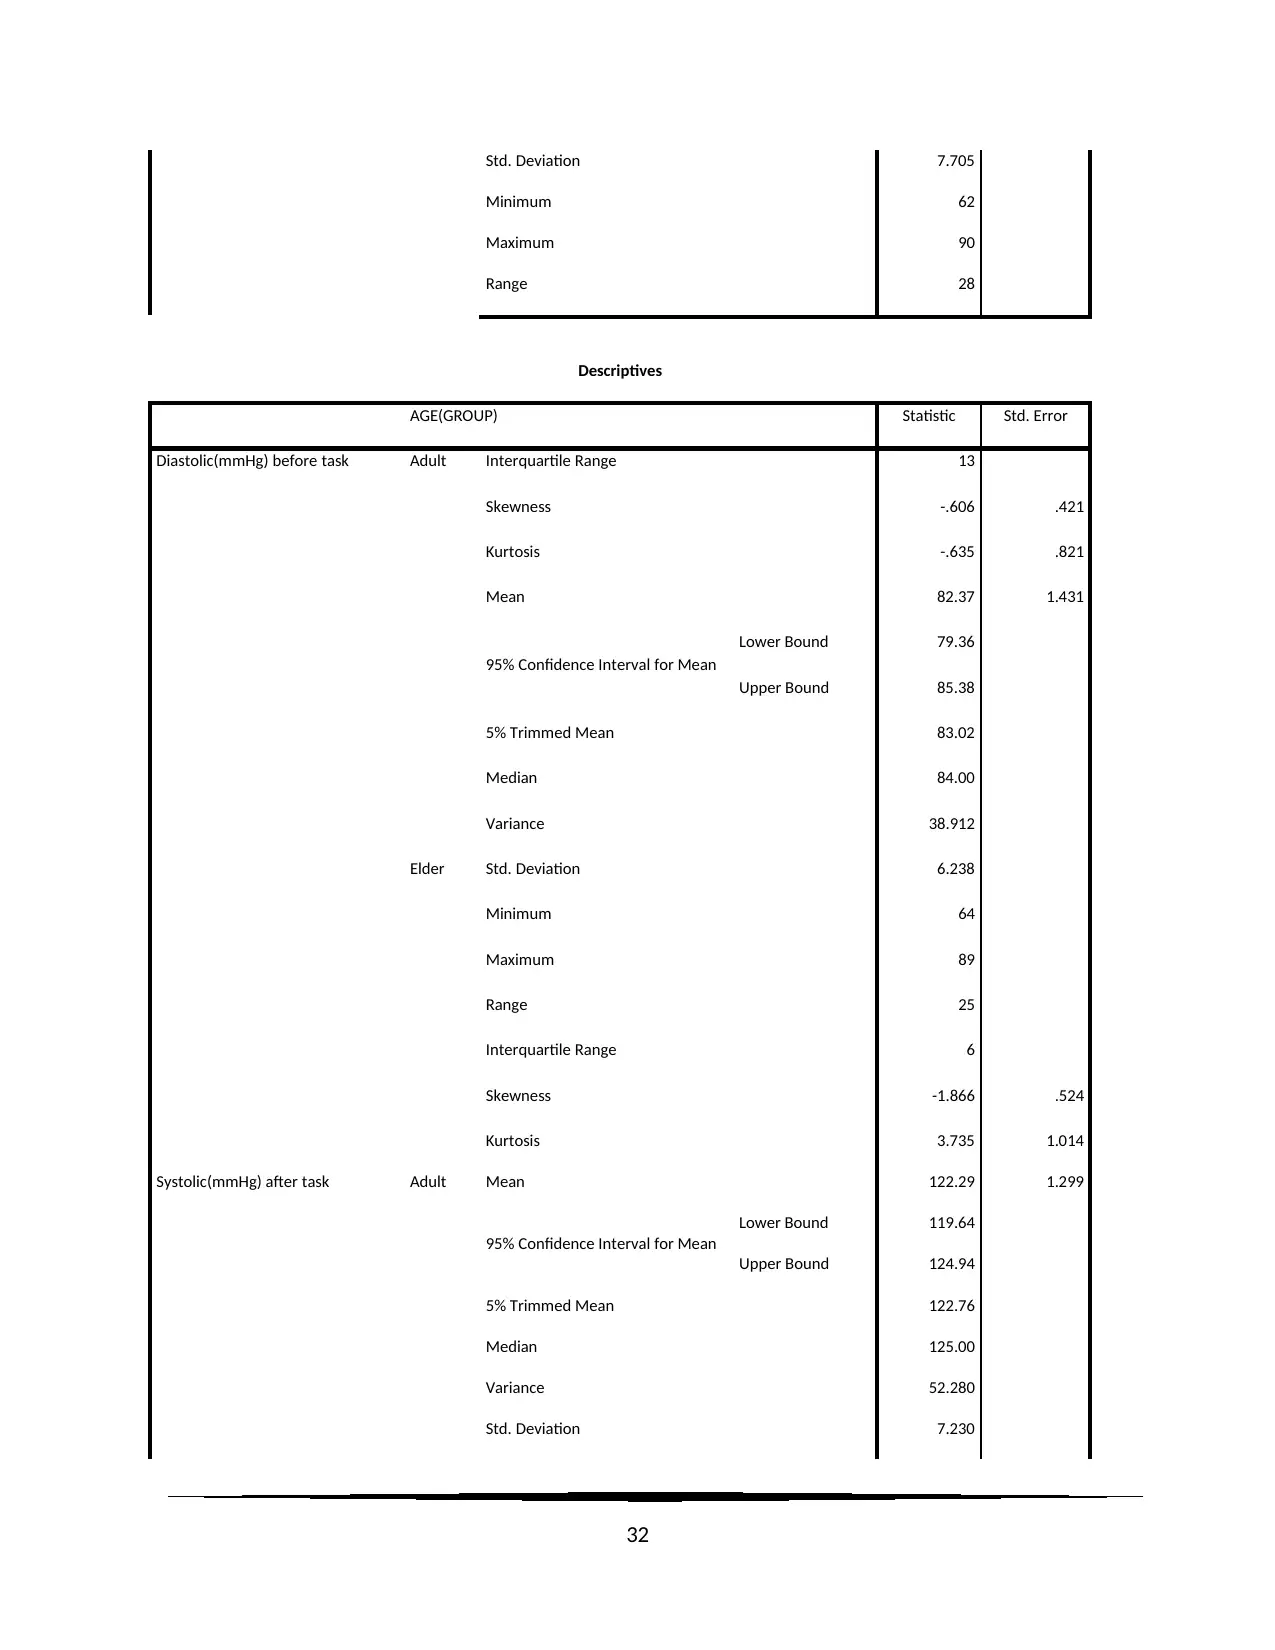
Std. Deviation 7.705
Minimum 62
Maximum 90
Range 28
Descriptives
AGE(GROUP) Statistic Std. Error
Diastolic(mmHg) before task Adult Interquartile Range 13
Skewness -.606 .421
Kurtosis -.635 .821
Elder
Mean 82.37 1.431
95% Confidence Interval for Mean
Lower Bound 79.36
Upper Bound 85.38
5% Trimmed Mean 83.02
Median 84.00
Variance 38.912
Std. Deviation 6.238
Minimum 64
Maximum 89
Range 25
Interquartile Range 6
Skewness -1.866 .524
Kurtosis 3.735 1.014
Systolic(mmHg) after task Adult Mean 122.29 1.299
95% Confidence Interval for Mean
Lower Bound 119.64
Upper Bound 124.94
5% Trimmed Mean 122.76
Median 125.00
Variance 52.280
Std. Deviation 7.230
32
Minimum 104
Maximum 131
Range 27
Interquartile Range 10
Skewness -1.076 .421
Kurtosis .125 .821
Elder
Mean 128.32 1.508
95% Confidence Interval for Mean
Lower Bound 125.15
Upper Bound 131.48
5% Trimmed Mean 128.24
Median 128.00
Variance 43.228
Std. Deviation 6.575
Descriptives
AGE(GROUP) Statistic Std. Error
Systolic(mmHg) after task Elder Minimum 113
Maximum 145
Range 32
Interquartile Range 5
Skewness -.136 .524
Kurtosis 2.942 1.014
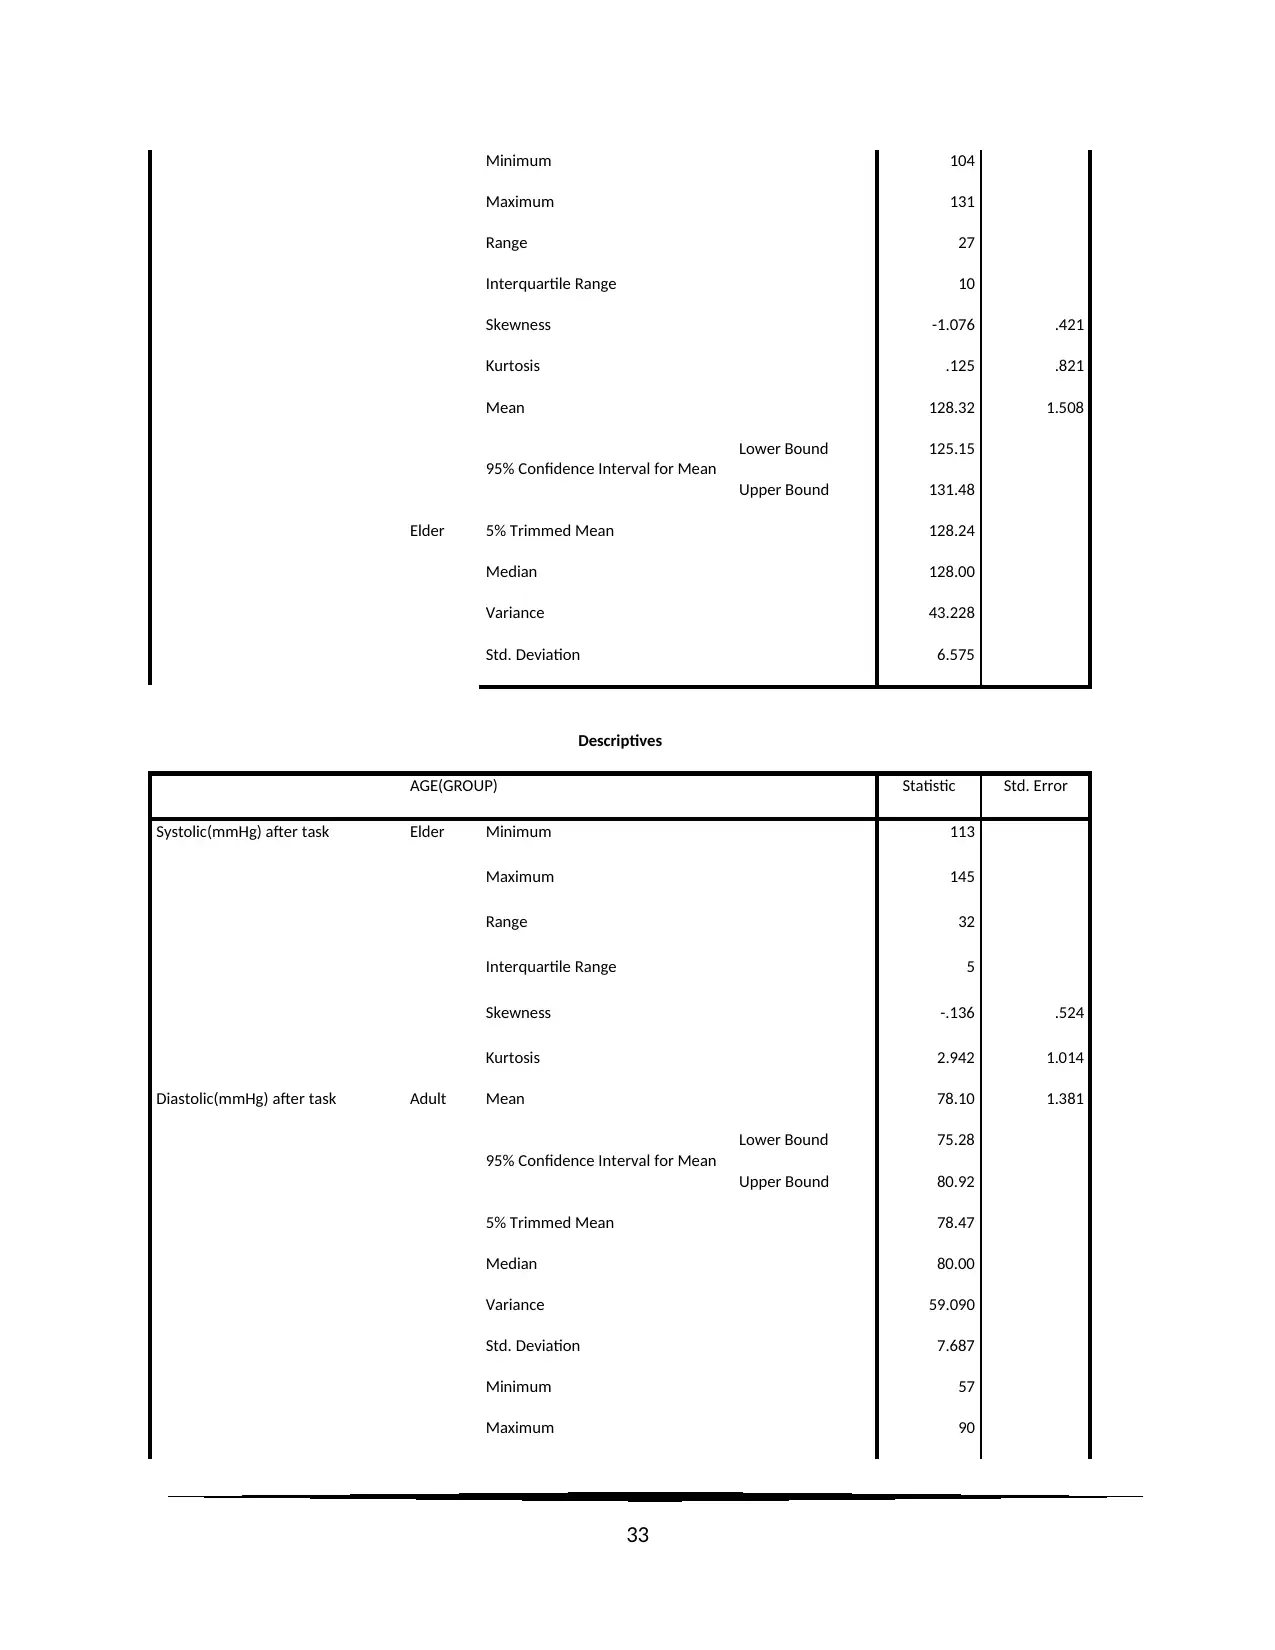
Diastolic(mmHg) after task Adult Mean 78.10 1.381
95% Confidence Interval for Mean
Lower Bound 75.28
Upper Bound 80.92
5% Trimmed Mean 78.47
Median 80.00
Variance 59.090
Std. Deviation 7.687
Minimum 57
Maximum 90
33
Maximum 131
Range 27
Interquartile Range 10
Skewness -1.076 .421
Kurtosis .125 .821
Elder
Mean 128.32 1.508
95% Confidence Interval for Mean
Lower Bound 125.15
Upper Bound 131.48
5% Trimmed Mean 128.24
Median 128.00
Variance 43.228
Std. Deviation 6.575
Descriptives
AGE(GROUP) Statistic Std. Error
Systolic(mmHg) after task Elder Minimum 113
Maximum 145
Range 32
Interquartile Range 5
Skewness -.136 .524
Kurtosis 2.942 1.014
Diastolic(mmHg) after task Adult Mean 78.10 1.381
95% Confidence Interval for Mean
Lower Bound 75.28
Upper Bound 80.92
5% Trimmed Mean 78.47
Median 80.00
Variance 59.090
Std. Deviation 7.687
Minimum 57
Maximum 90
33
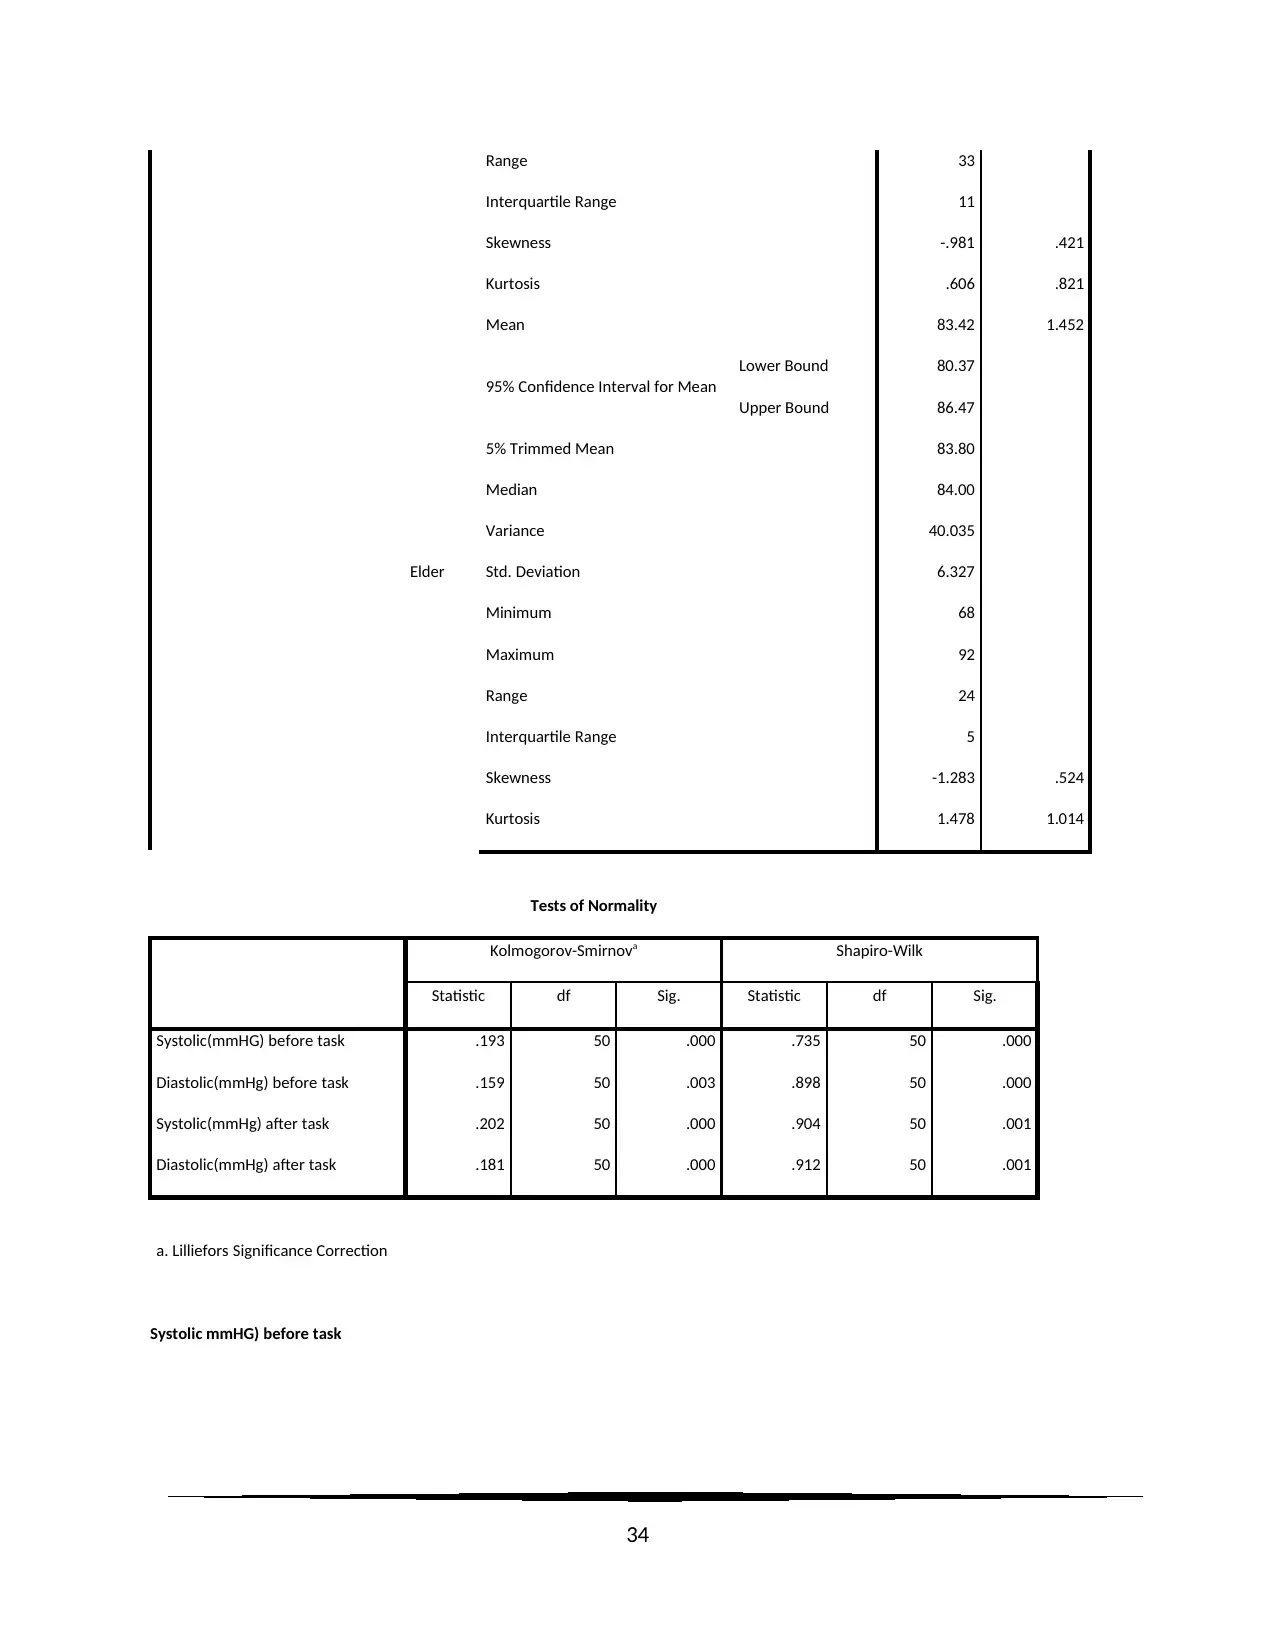
Range 33
Interquartile Range 11
Skewness -.981 .421
Kurtosis .606 .821
Elder
Mean 83.42 1.452
95% Confidence Interval for Mean
Lower Bound 80.37
Upper Bound 86.47
5% Trimmed Mean 83.80
Median 84.00
Variance 40.035
Std. Deviation 6.327
Minimum 68
Maximum 92
Range 24
Interquartile Range 5
Skewness -1.283 .524
Kurtosis 1.478 1.014
Tests of Normality
Kolmogorov-Smirnova Shapiro-Wilk
Statistic df Sig. Statistic df Sig.
Systolic(mmHG) before task .193 50 .000 .735 50 .000
Diastolic(mmHg) before task .159 50 .003 .898 50 .000
Systolic(mmHg) after task .202 50 .000 .904 50 .001
Diastolic(mmHg) after task .181 50 .000 .912 50 .001
a. Lilliefors Significance Correction
Systolic mmHG) before task
34
Secure Best Marks with AI Grader
Need help grading? Try our AI Grader for instant feedback on your assignments.
35
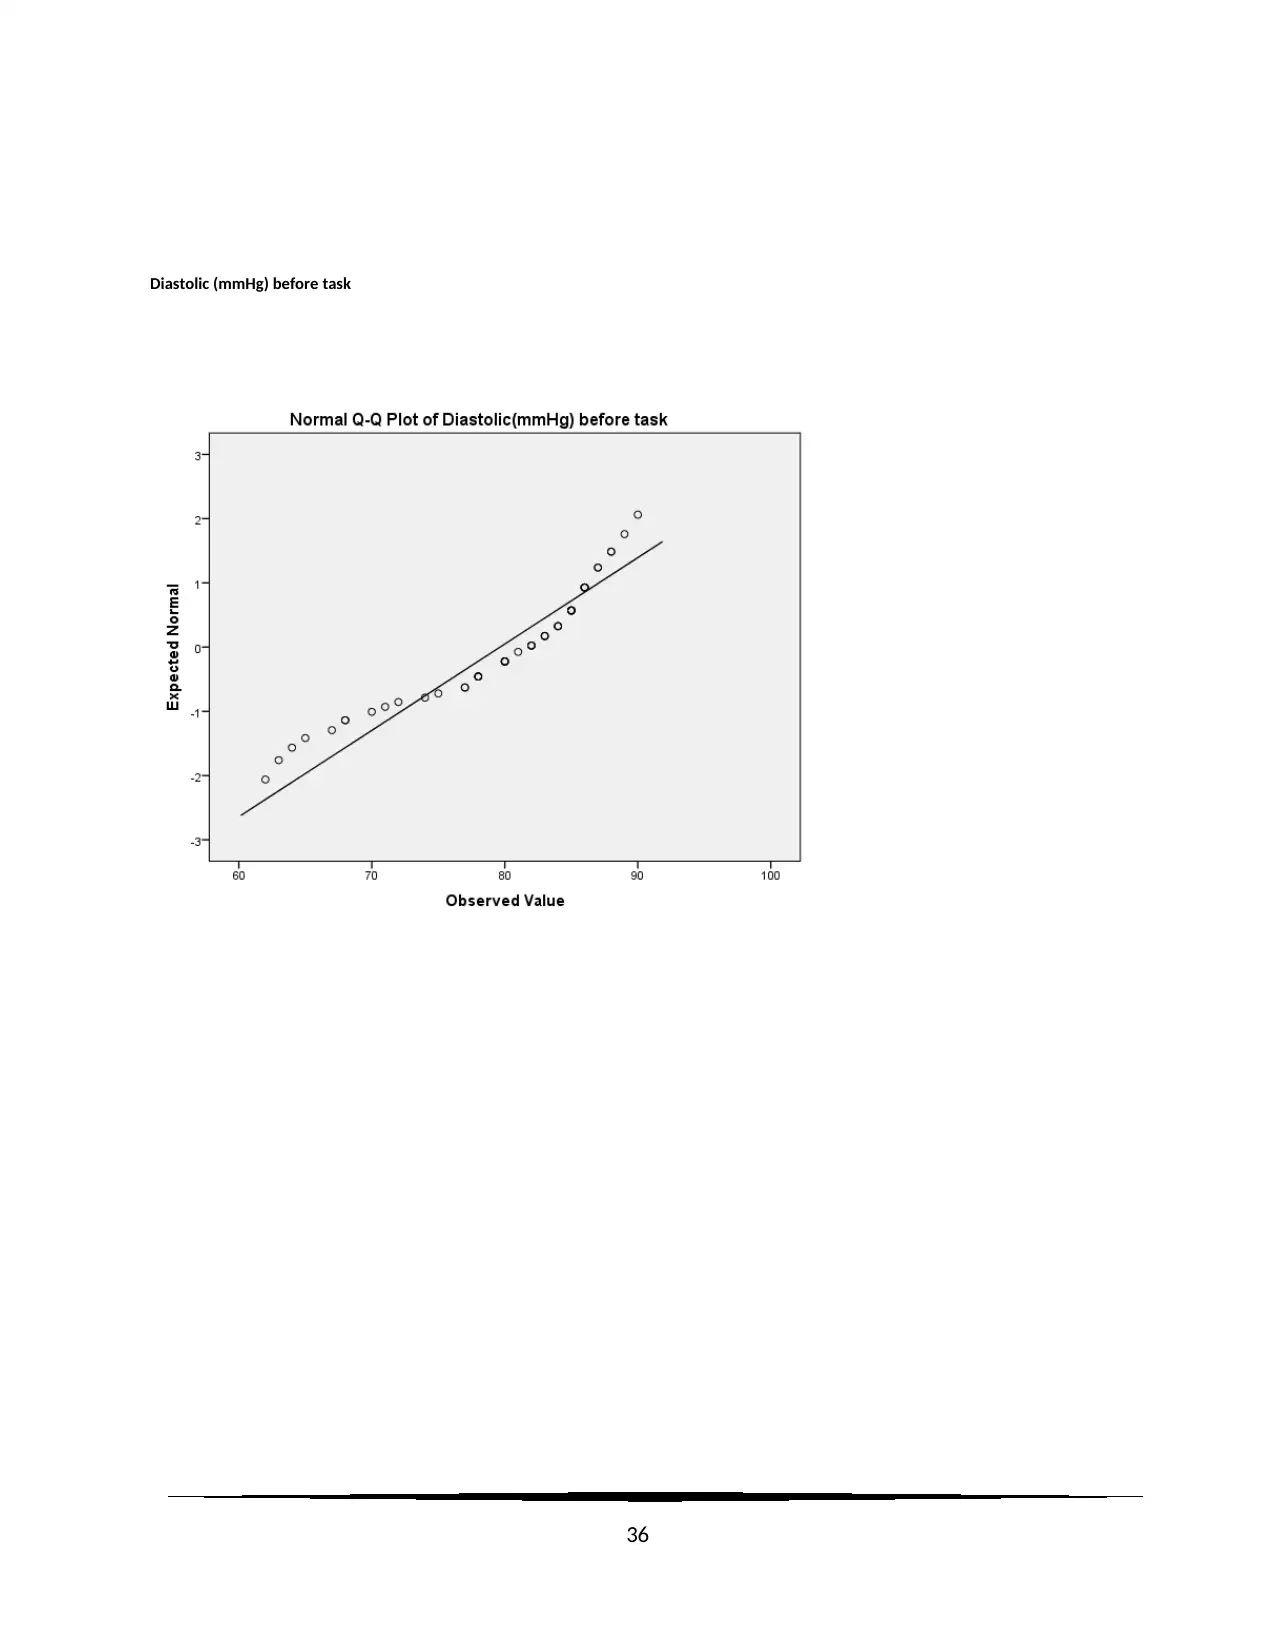
Diastolic (mmHg) before task
36
36
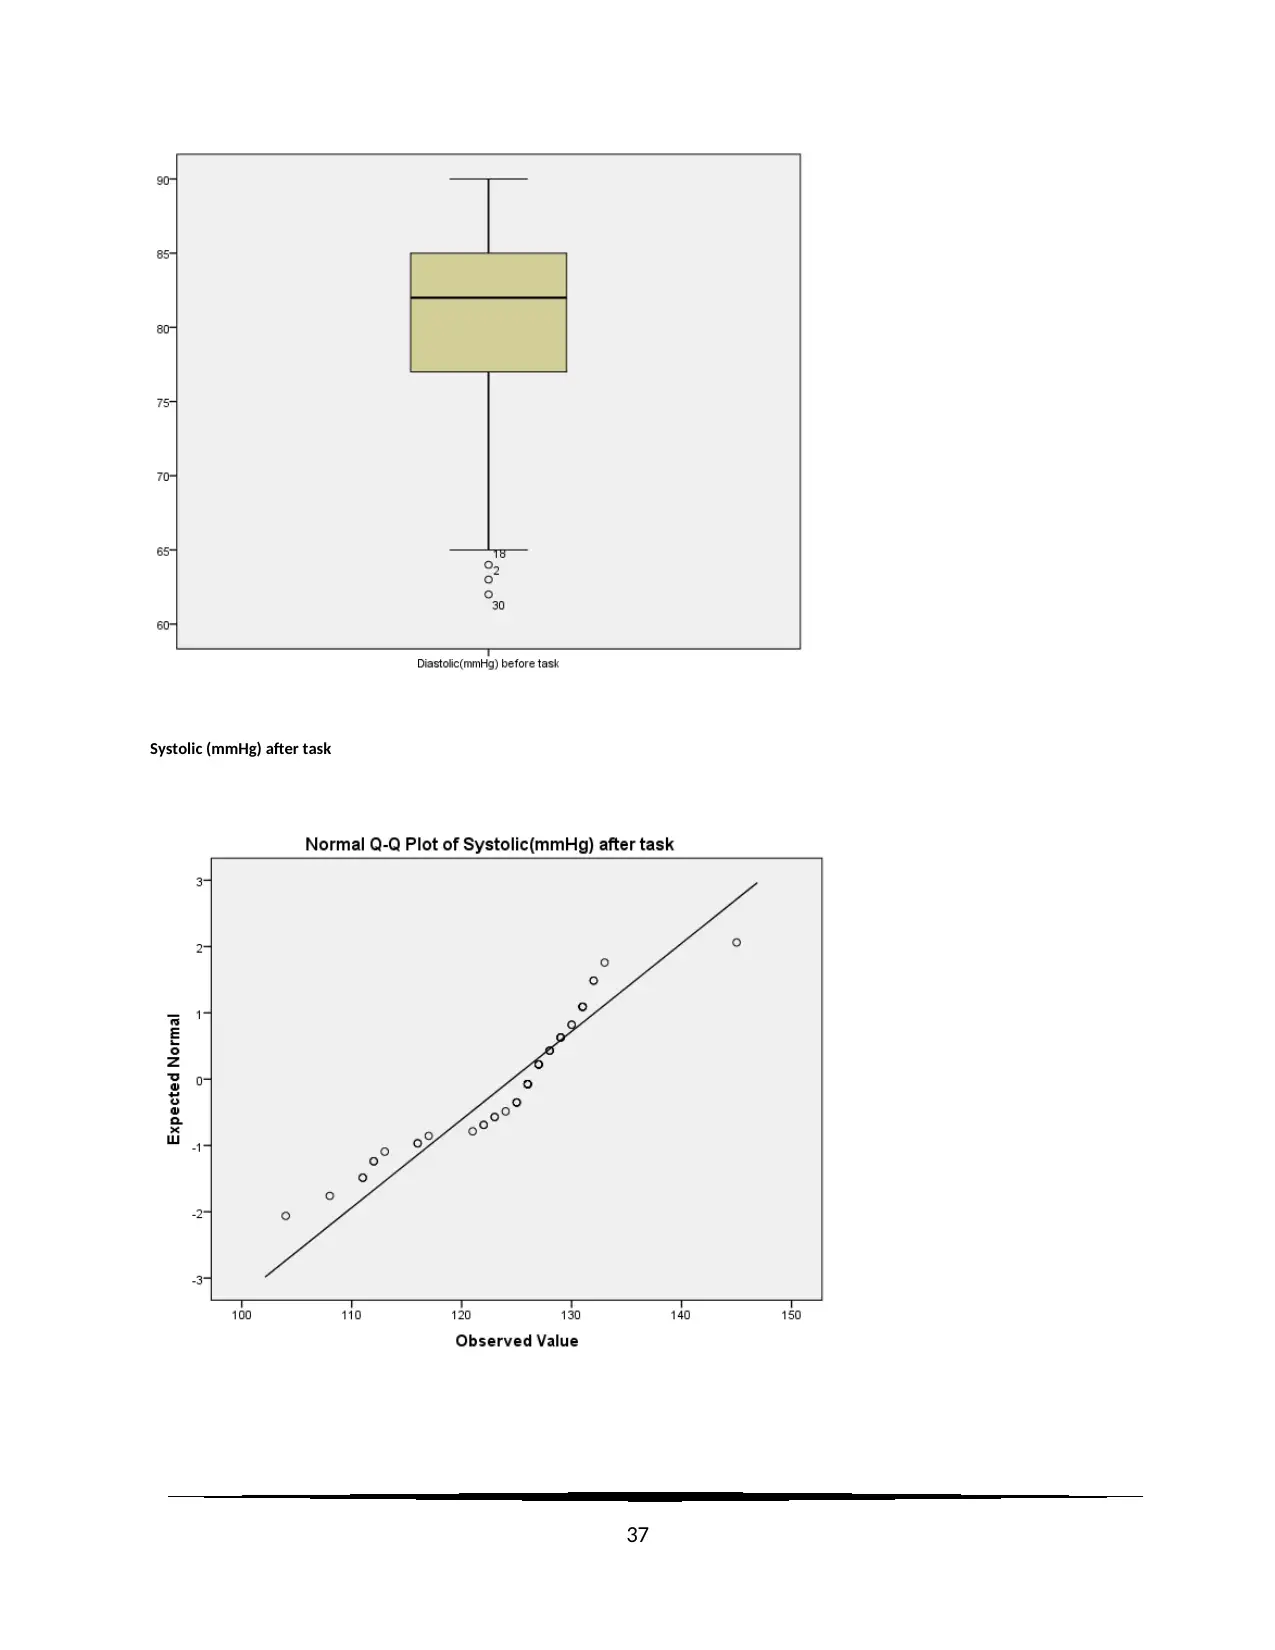
Systolic (mmHg) after task
37
37
Paraphrase This Document
Need a fresh take? Get an instant paraphrase of this document with our AI Paraphraser
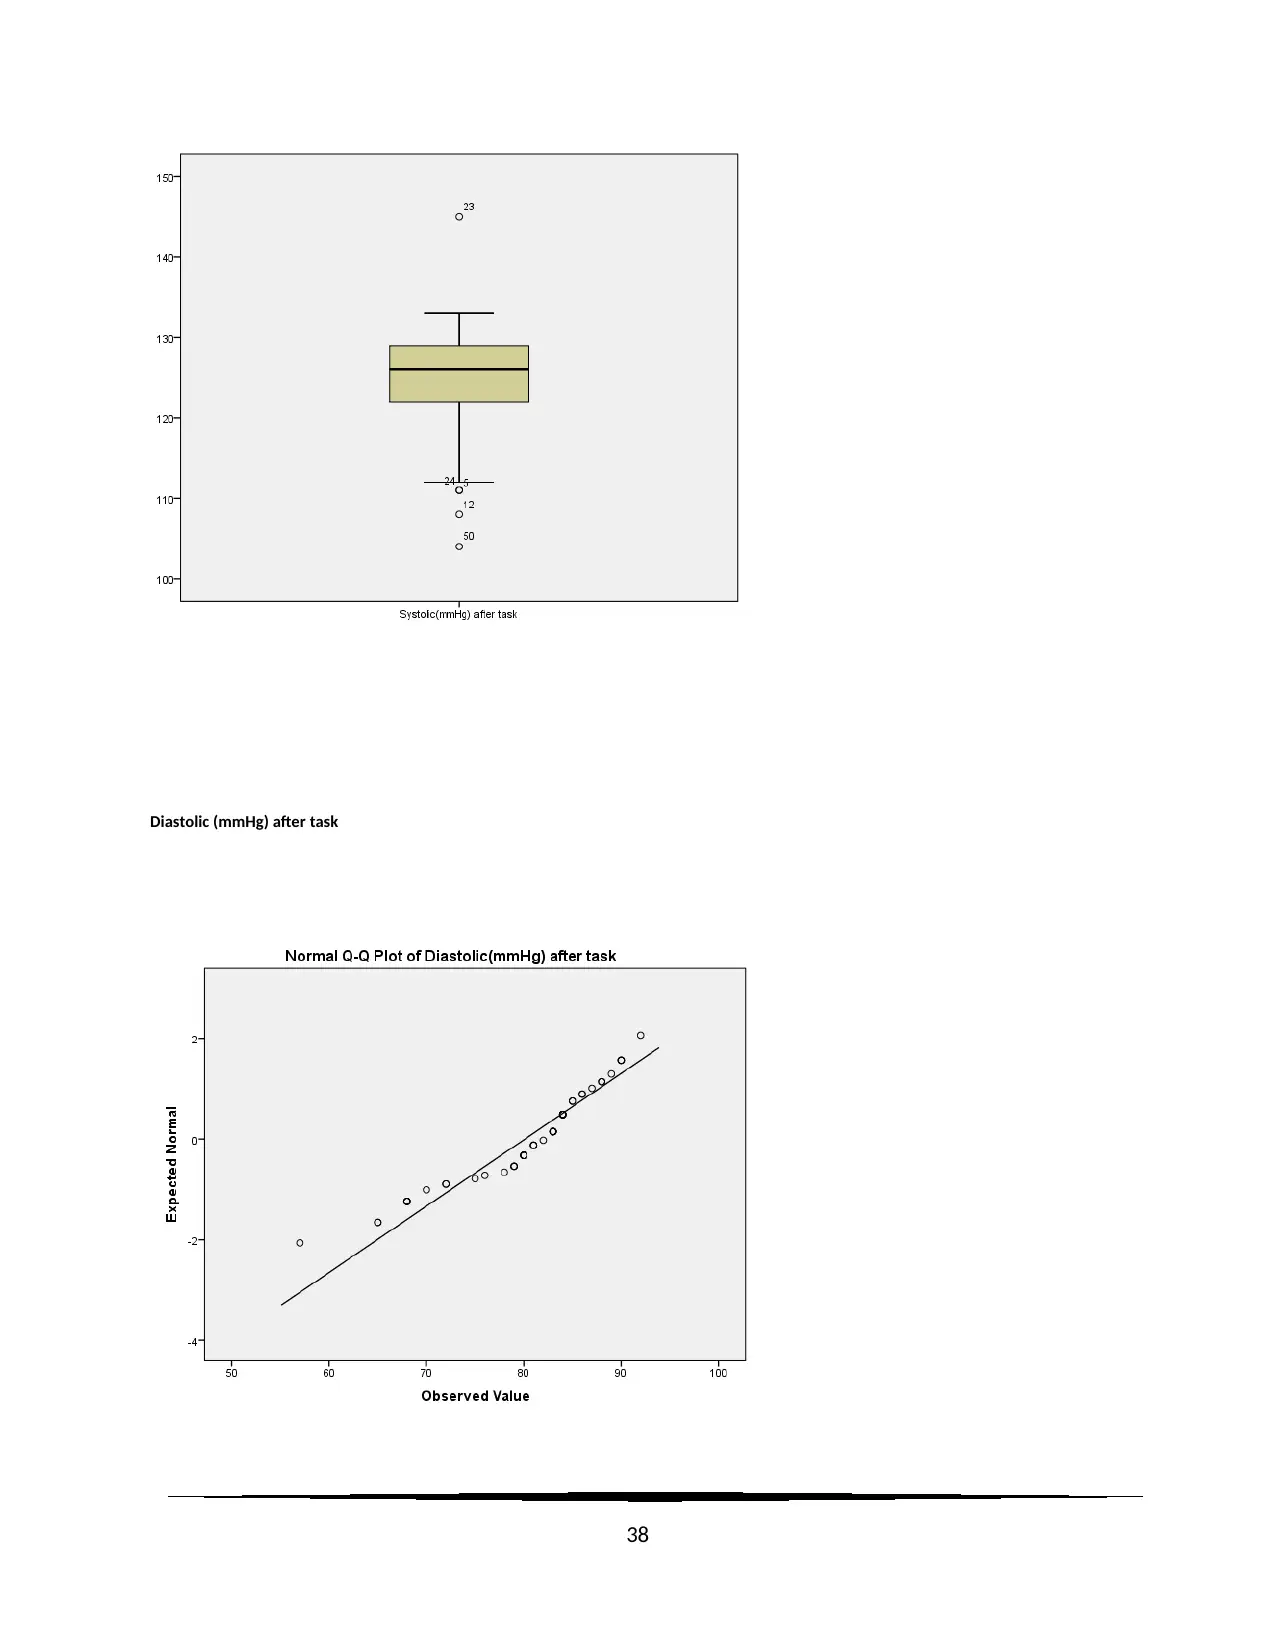
Diastolic (mmHg) after task
38
38
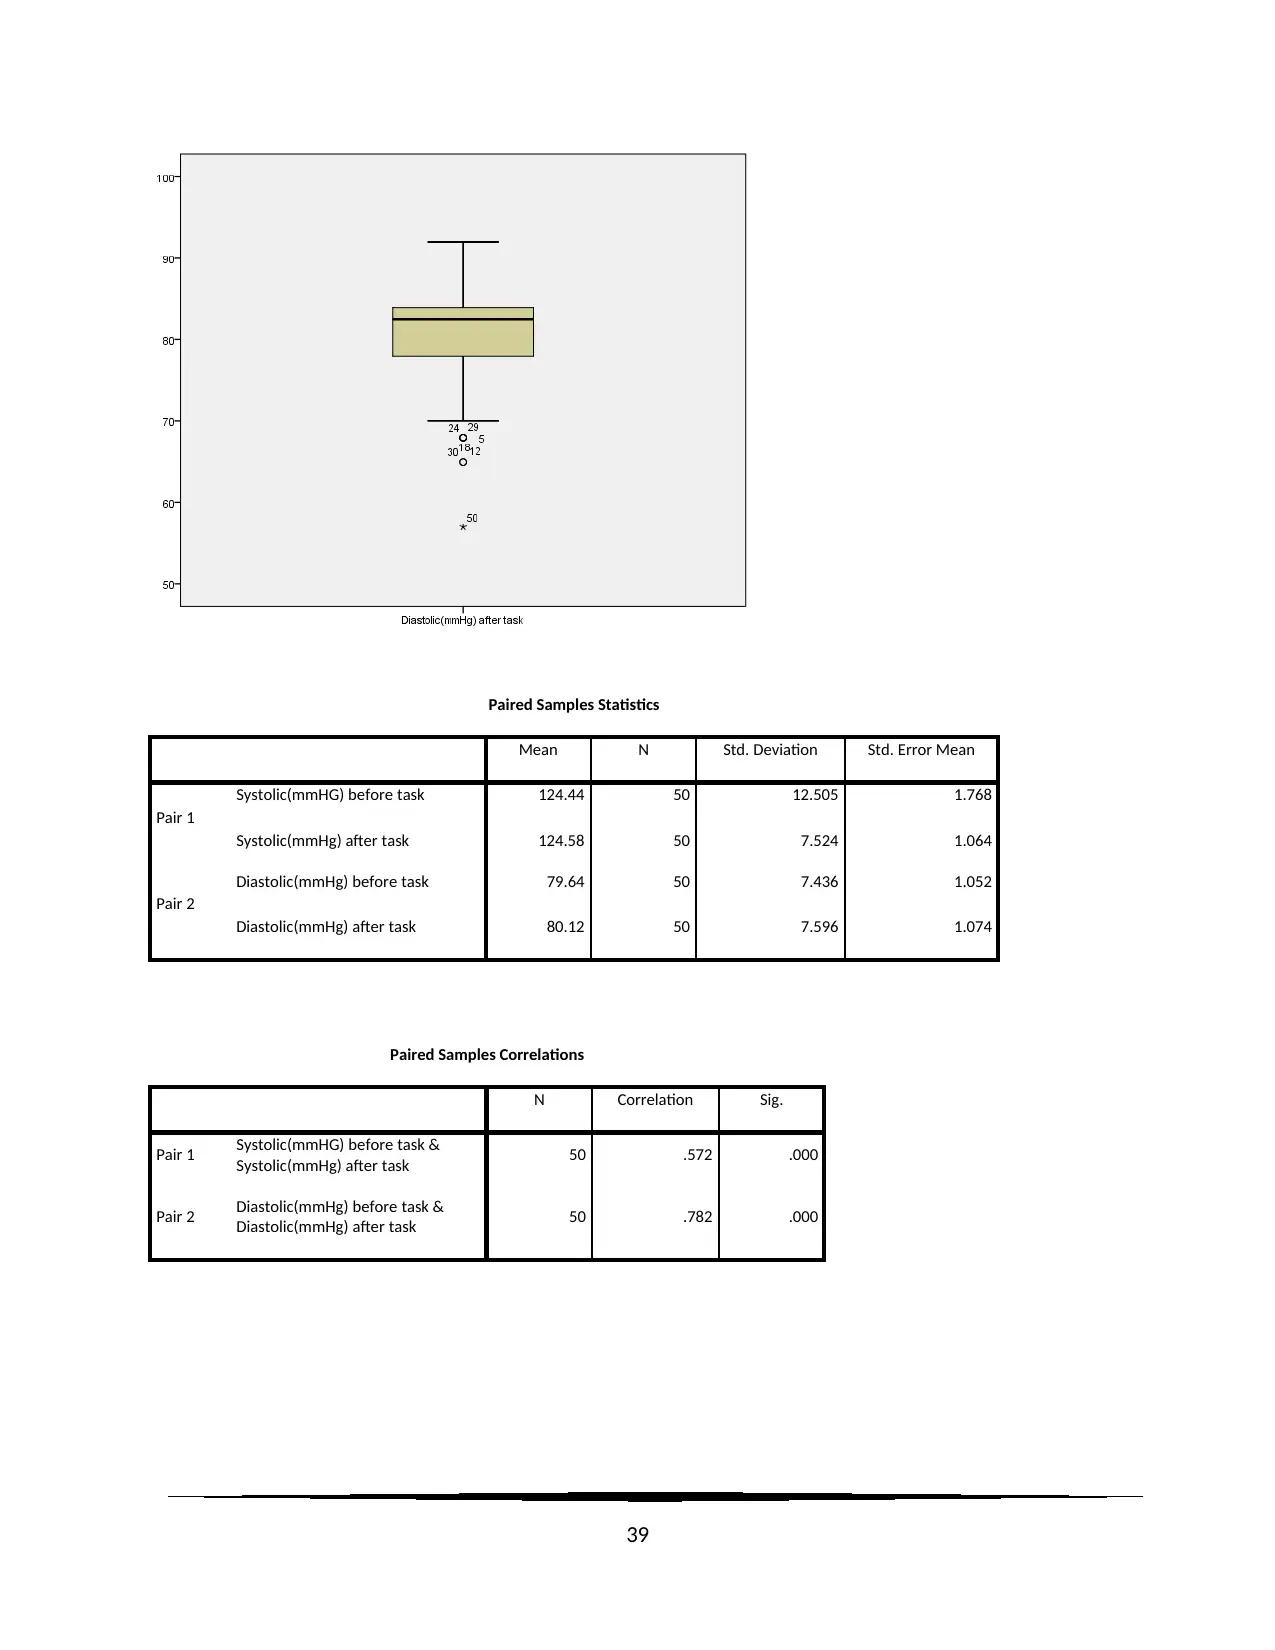
Paired Samples Statistics
Mean N Std. Deviation Std. Error Mean
Pair 1
Systolic(mmHG) before task 124.44 50 12.505 1.768
Systolic(mmHg) after task 124.58 50 7.524 1.064
Pair 2
Diastolic(mmHg) before task 79.64 50 7.436 1.052
Diastolic(mmHg) after task 80.12 50 7.596 1.074
Paired Samples Correlations
N Correlation Sig.
Pair 1 Systolic(mmHG) before task &
Systolic(mmHg) after task 50 .572 .000
Pair 2 Diastolic(mmHg) before task &
Diastolic(mmHg) after task 50 .782 .000
39
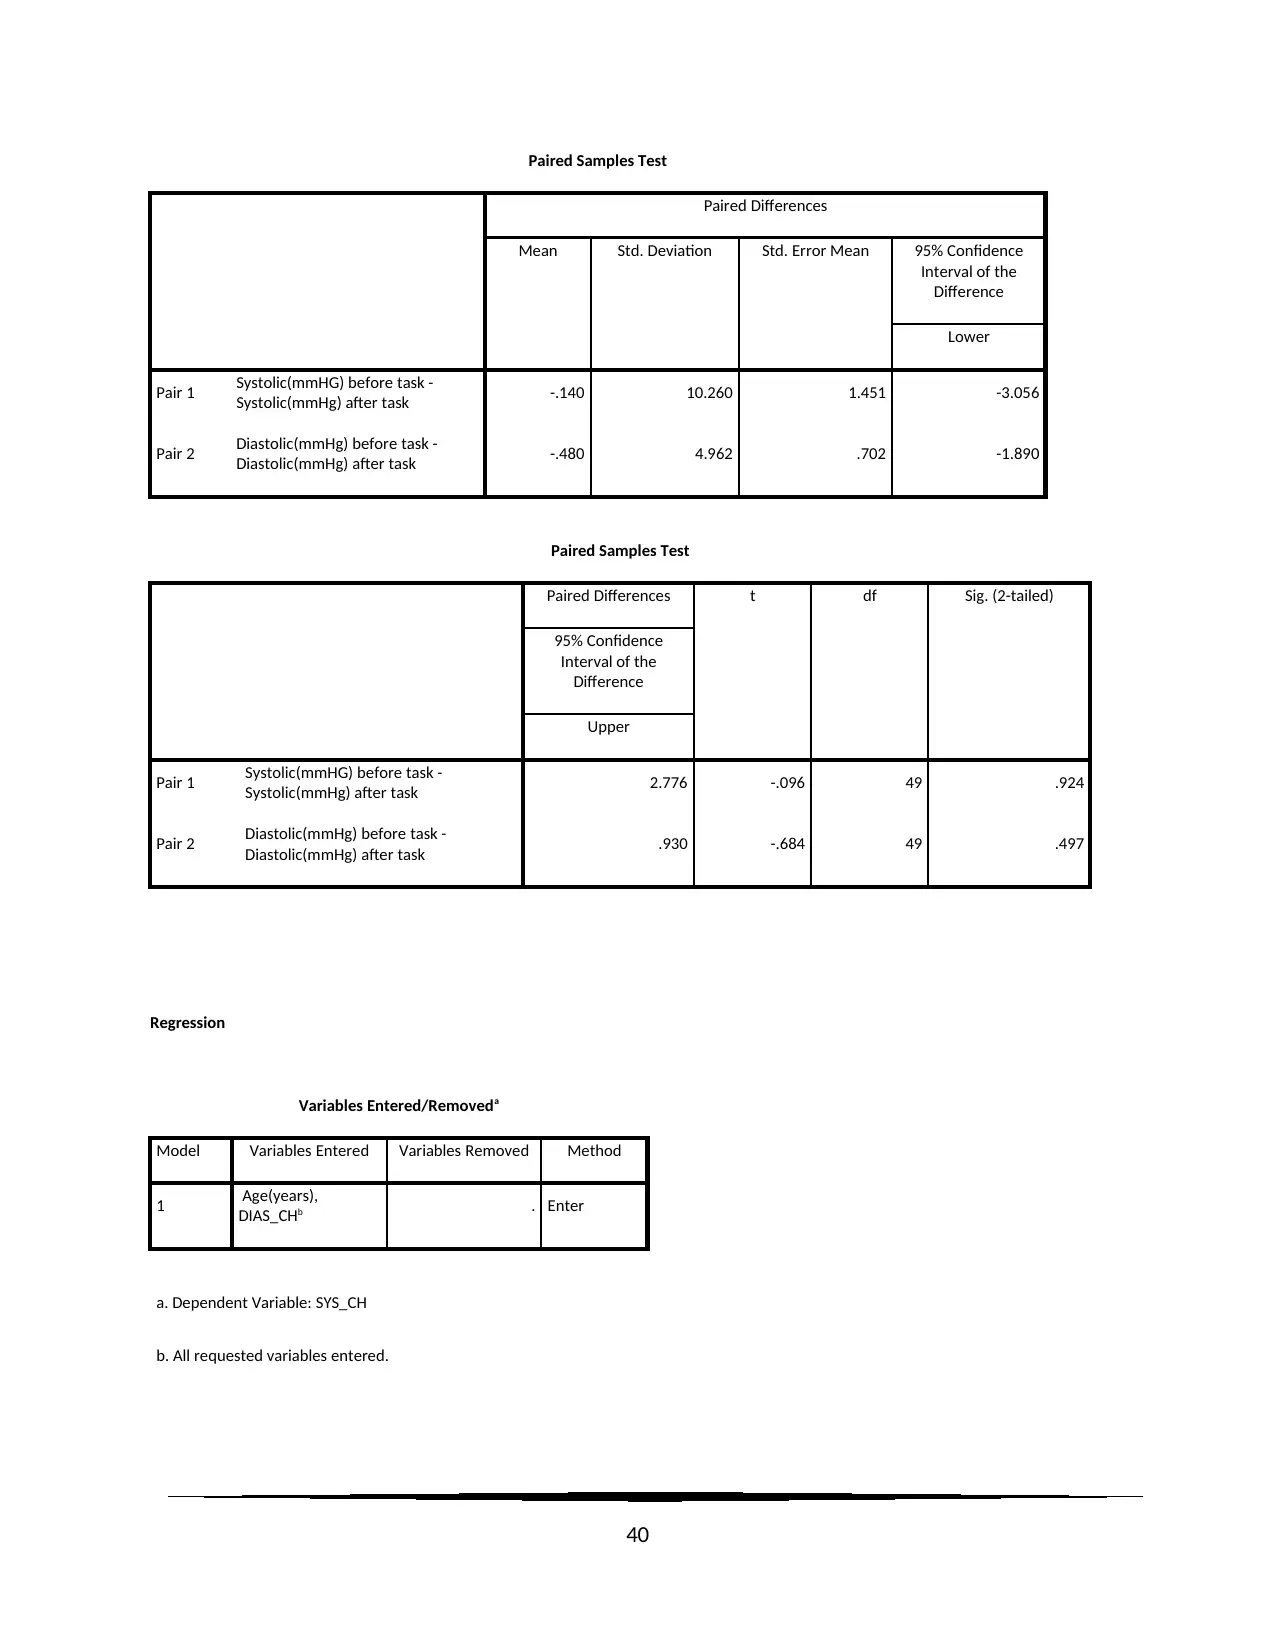
Paired Samples Test
Paired Differences
Mean Std. Deviation Std. Error Mean 95% Confidence
Interval of the
Difference
Lower
Pair 1 Systolic(mmHG) before task -
Systolic(mmHg) after task -.140 10.260 1.451 -3.056
Pair 2 Diastolic(mmHg) before task -
Diastolic(mmHg) after task -.480 4.962 .702 -1.890
Paired Samples Test
Paired Differences t df Sig. (2-tailed)
95% Confidence
Interval of the
Difference
Upper
Pair 1 Systolic(mmHG) before task -
Systolic(mmHg) after task 2.776 -.096 49 .924
Pair 2 Diastolic(mmHg) before task -
Diastolic(mmHg) after task .930 -.684 49 .497
Regression
Variables Entered/Removeda
Model Variables Entered Variables Removed Method
1 Age(years),
DIAS_CHb . Enter
a. Dependent Variable: SYS_CH
b. All requested variables entered.
40
Secure Best Marks with AI Grader
Need help grading? Try our AI Grader for instant feedback on your assignments.
Model Summaryb
Model R R Square Adjusted R Square Std. Error of the
Estimate
Change Statistics
R Square Change F Change
1 .107a .011 -.031 10.41564 .011 .273
Model Summaryb
Model Change Statistics
df1 df2 Sig. F Change
1 2a 47 .762
a. Predictors: (Constant), Age(years), DIAS_CH
b. Dependent Variable: SYS_CH
ANOVAa
Model Sum of Squares df Mean Square F Sig.
1
Regression 59.198 2 29.599 .273 .762b
Residual 5098.822 47 108.486
Total 5158.020 49
a. Dependent Variable: SYS_CH
b. Predictors: (Constant), Age(years), DIAS_CH
Coefficientsa
Model Unstandardized Coefficients Standardized
Coefficients
t Sig.
B Std. Error Beta
1
(Constant) -3.690 5.567 -.663 .511
DIAS_CH -.062 .300 -.030 -.207 .837
Age(years) .152 .212 .104 .718 .476
41
Coefficientsa
Model Correlations Collinearity Statistics
Zero-order Partial Part Tolerance VIF
1
(Constant)
DIAS_CH -.025 -.030 -.030 .998 1.002
Age(years) .103 .104 .104 .998 1.002
a. Dependent Variable: SYS_CH
Collinearity Diagnosticsa
Model Dimension Eigenvalue Condition Index Variance Proportions
(Constant) DIAS_CH Age(years)
1
1 1.985 1.000 .02 .01 .02
2 .979 1.424 .00 .99 .00
3 .036 7.467 .98 .00 .98
a. Dependent Variable: SYS_CH
Casewise Diagnosticsa
Case Number Std. Residual SYS_CH Predicted Value Residual
28 -6.068 -64.00 -.7983 -63.20171
a. Dependent Variable: SYS_CH
Residuals Statisticsa
Minimum Maximum Mean Std. Deviation N
Predicted Value -1.1087 5.4987 .1400 1.09915 50
Residual -63.20171 11.04318 .00000 10.20086 50
Std. Predicted Value -1.136 4.875 .000 1.000 50
42
Std. Residual -6.068 1.060 .000 .979 50
a. Dependent Variable: SYS_CH
Charts
Regression
Variables Entered/Removeda
Model Variables Entered Variables Removed Method
1 Gender, DIAS_CHb . Enter
a. Dependent Variable: SYS_CH
43
a. Dependent Variable: SYS_CH
Charts
Regression
Variables Entered/Removeda
Model Variables Entered Variables Removed Method
1 Gender, DIAS_CHb . Enter
a. Dependent Variable: SYS_CH
43
Paraphrase This Document
Need a fresh take? Get an instant paraphrase of this document with our AI Paraphraser
b. All requested variables entered.
Model Summaryb
Model R R Square Adjusted R Square Std. Error of the
Estimate
Change Statistics
R Square Change F Change
1 .157a .025 -.017 10.34563 .025 .596
Model Summaryb
Model Change Statistics
df1 df2 Sig. F Change
1 2a 47 .555
a. Predictors: (Constant), Gender, DIAS_CH
b. Dependent Variable: SYS_CH
ANOVAa
Model Sum of Squares df Mean Square F Sig.
1
Regression 127.513 2 63.757 .596 .555b
Residual 5030.507 47 107.032
Total 5158.020 49
a. Dependent Variable: SYS_CH
b. Predictors: (Constant), Gender, DIAS_CH
Coefficientsa
Model Unstandardized Coefficients Standardized
Coefficients
t Sig.
B Std. Error Beta
44
Model Summaryb
Model R R Square Adjusted R Square Std. Error of the
Estimate
Change Statistics
R Square Change F Change
1 .157a .025 -.017 10.34563 .025 .596
Model Summaryb
Model Change Statistics
df1 df2 Sig. F Change
1 2a 47 .555
a. Predictors: (Constant), Gender, DIAS_CH
b. Dependent Variable: SYS_CH
ANOVAa
Model Sum of Squares df Mean Square F Sig.
1
Regression 127.513 2 63.757 .596 .555b
Residual 5030.507 47 107.032
Total 5158.020 49
a. Dependent Variable: SYS_CH
b. Predictors: (Constant), Gender, DIAS_CH
Coefficientsa
Model Unstandardized Coefficients Standardized
Coefficients
t Sig.
B Std. Error Beta
44
1
(Constant) 5.058 4.773 1.060 .295
DIAS_CH -.009 .300 -.004 -.031 .976
Gender -3.191 2.961 -.157 -1.078 .287
Coefficientsa
Model Correlations Collinearity Statistics
Zero-order Partial Part Tolerance VIF
1
(Constant)
DIAS_CH -.025 -.004 -.004 .983 1.017
Gender -.157 -.155 -.155 .983 1.017
a. Dependent Variable: SYS_CH
Collinearity Diagnosticsa
Model Dimension Eigenvalue Condition Index Variance Proportions
(Constant) DIAS_CH Gender
1
1 1.978 1.000 .02 .01 .02
2 .974 1.425 .00 .97 .00
3 .048 6.426 .98 .01 .98
a. Dependent Variable: SYS_CH
Casewise Diagnosticsa
Case Number Std. Residual SYS_CH Predicted Value Residual
28 -6.058 -64.00 -1.3234 -62.67662
a. Dependent Variable: SYS_CH
45
Residuals Statisticsa
Minimum Maximum Mean Std. Deviation N
Predicted Value -1.4160 1.9787 .1400 1.61317 50
Residual -62.67662 12.36971 .00000 10.13230 50
Std. Predicted Value -.965 1.140 .000 1.000 50
Std. Residual -6.058 1.196 .000 .979 50
a. Dependent Variable: SYS_CH
Charts
46
Minimum Maximum Mean Std. Deviation N
Predicted Value -1.4160 1.9787 .1400 1.61317 50
Residual -62.67662 12.36971 .00000 10.13230 50
Std. Predicted Value -.965 1.140 .000 1.000 50
Std. Residual -6.058 1.196 .000 .979 50
a. Dependent Variable: SYS_CH
Charts
46
Secure Best Marks with AI Grader
Need help grading? Try our AI Grader for instant feedback on your assignments.
47
1 out of 47
Related Documents


Your All-in-One AI-Powered Toolkit for Academic Success.
+13062052269
info@desklib.com
Available 24*7 on WhatsApp / Email
![[object Object]](/_next/static/media/star-bottom.7253800d.svg)
Unlock your academic potential
© 2024 | Zucol Services PVT LTD | All rights reserved.