logo

Which Stock Should I Invest In PHUONG THAO BUI

11 Pages2540 Words64 Views
   

Added on  2023-05-05

About This Document

In this report we will discuss about Investing and below are the summaries point:-

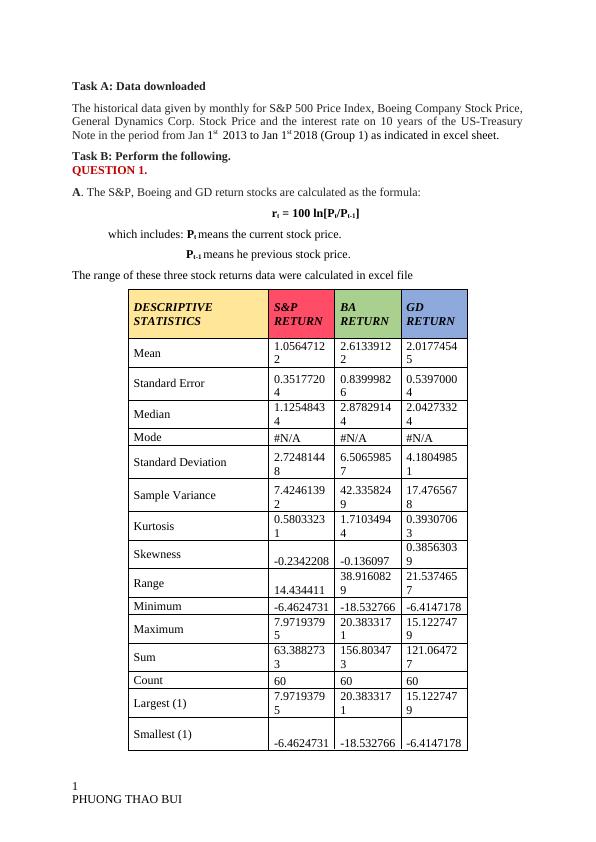
  • Monthly historical data was given for S&P 500 Price Index, Boeing Company Stock Price, General Dynamics Corp. Stock Price, and interest rate on 10 years of the US-Treasury Note from Jan 1st 2013 to Jan 1st 2018 (Group 1).

  • The average return and standard deviation of Boeing (BA) stocks were 2.6134 and 6.5066 respectively, while GD stocks had an average return of 2.0177 with a standard deviation of 4.1805.

  • Boeing Company had a higher average return than that of General Dynamics Corporate, but BA stock was riskier than GD stocks based on the standard deviation.

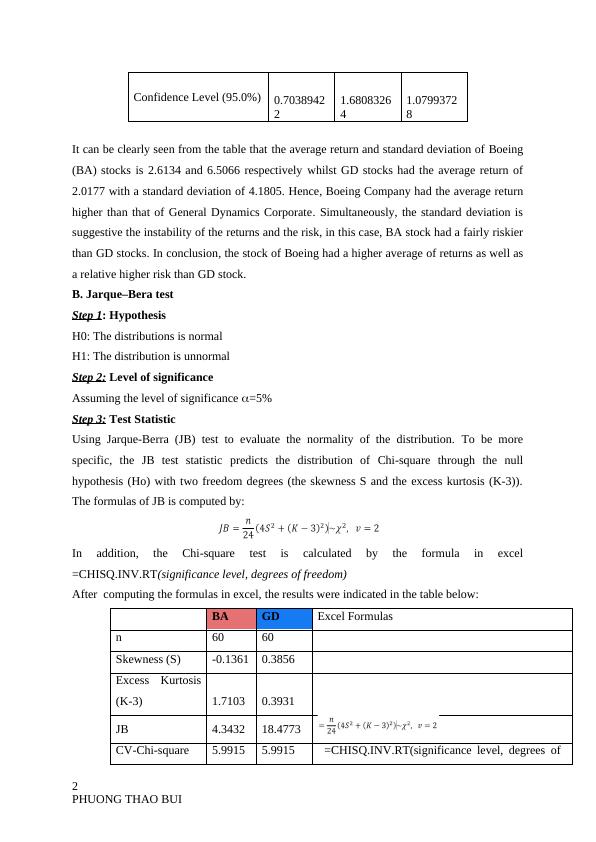
  • The null hypothesis (H0) was that the distribution of both stocks was normal, and the alternative hypothesis (H1) was that the distribution was unnormal with a level of significance of 5%.

  • The Jarque-Berra (JB) test was used to evaluate the normality of the distribution, and the test statistic was computed using the formulas for JB.

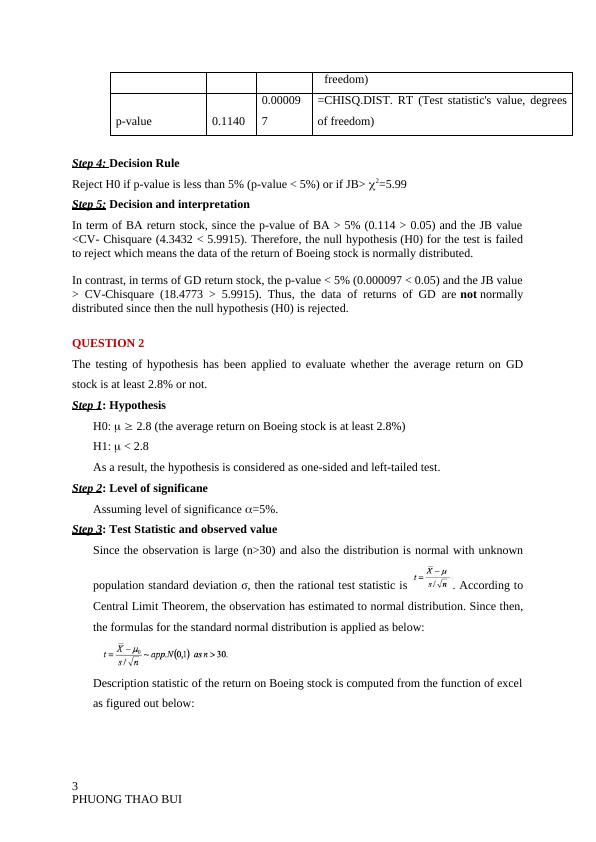
  • For BA return stock, the null hypothesis was not rejected as p-value > 5% and the JB value < CV-Chisquare.

  • For GD return stock, the null hypothesis was rejected as p-value < 5% and the JB value > CV-Chisquare.

  • The F-test was used to test the null hypothesis that the variances of the two stocks were equal.

Which Stock Should I Invest In PHUONG THAO BUI

   Added on 2023-05-05

ShareRelated Documents
WHICH STOCK SHOULD I INVEST IN
PHUONG THAO BUI
Which Stock Should I Invest In PHUONG THAO BUI_1
Task A: Data downloaded
The historical data given by monthly for S&P 500 Price Index, Boeing Company Stock Price,
General Dynamics Corp. Stock Price and the interest rate on 10 years of the US-Treasury
Note in the period from Jan 1st 2013 to Jan 1st 2018 (Group 1) as indicated in excel sheet.
Task B: Perform the following.
QUESTION 1.
A. The S&P, Boeing and GD return stocks are calculated as the formula:
rt = 100 ln[Pt/Pt-1]
which includes: Pt means the current stock price.
Pt-1 means he previous stock price.
The range of these three stock returns data were calculated in excel file
DESCRIPTIVE
STATISTICS
S&P
RETURN
BA
RETURN
GD
RETURN
Mean 1.0564712
2
2.6133912
2
2.0177454
5
Standard Error 0.3517720
4
0.8399982
6
0.5397000
4
Median 1.1254843
4
2.8782914
4
2.0427332
4
Mode #N/A #N/A #N/A
Standard Deviation 2.7248144
8
6.5065985
7
4.1804985
1
Sample Variance 7.4246139
2
42.335824
9
17.476567
8
Kurtosis 0.5803323
1
1.7103494
4
0.3930706
3
Skewness -0.2342208 -0.136097
0.3856303
9
Range 14.434411
38.916082
9
21.537465
7
Minimum -6.4624731 -18.532766 -6.4147178
Maximum 7.9719379
5
20.383317
1
15.122747
9
Sum 63.388273
3
156.80347
3
121.06472
7
Count 60 60 60
Largest (1) 7.9719379
5
20.383317
1
15.122747
9
Smallest (1) -6.4624731 -18.532766 -6.4147178
1
PHUONG THAO BUI
Which Stock Should I Invest In PHUONG THAO BUI_2
Confidence Level (95.0%) 0.7038942
2
1.6808326
4
1.0799372
8
It can be clearly seen from the table that the average return and standard deviation of Boeing
(BA) stocks is 2.6134 and 6.5066 respectively whilst GD stocks had the average return of
2.0177 with a standard deviation of 4.1805. Hence, Boeing Company had the average return
higher than that of General Dynamics Corporate. Simultaneously, the standard deviation is
suggestive the instability of the returns and the risk, in this case, BA stock had a fairly riskier
than GD stocks. In conclusion, the stock of Boeing had a higher average of returns as well as
a relative higher risk than GD stock.
B. Jarque–Bera test
Step 1: Hypothesis
H0: The distributions is normal
H1: The distribution is unnormal
Step 2: Level of significance
Assuming the level of significance =5%
Step 3: Test Statistic
Using Jarque-Berra (JB) test to evaluate the normality of the distribution. To be more
specific, the JB test statistic predicts the distribution of Chi-square through the null
hypothesis (Ho) with two freedom degrees (the skewness S and the excess kurtosis (K-3)).
The formulas of JB is computed by:
In addition, the Chi-square test is calculated by the formula in excel
=CHISQ.INV.RT(significance level, degrees of freedom)
After computing the formulas in excel, the results were indicated in the table below:
BA GD Excel Formulas
n 60 60
Skewness (S) -0.1361 0.3856
Excess Kurtosis
(K-3) 1.7103 0.3931
JB 4.3432 18.4773
CV-Chi-square 5.9915 5.9915 =CHISQ.INV.RT(significance level, degrees of
2
PHUONG THAO BUI
Which Stock Should I Invest In PHUONG THAO BUI_3
freedom)
p-value 0.1140
0.00009
7
=CHISQ.DIST. RT (Test statistic's value, degrees
of freedom)
Step 4: Decision Rule
Reject H0 if p-value is less than 5% (p-value < 5%) or if JB> 2=5.99
Step 5: Decision and interpretation
In term of BA return stock, since the p-value of BA > 5% (0.114 > 0.05) and the JB value
<CV- Chisquare (4.3432 < 5.9915). Therefore, the null hypothesis (H0) for the test is failed
to reject which means the data of the return of Boeing stock is normally distributed.
In contrast, in terms of GD return stock, the p-value < 5% (0.000097 < 0.05) and the JB value
> CV-Chisquare (18.4773 > 5.9915). Thus, the data of returns of GD are not normally
distributed since then the null hypothesis (H0) is rejected.
QUESTION 2
The testing of hypothesis has been applied to evaluate whether the average return on GD
stock is at least 2.8% or not.
Step 1: Hypothesis
H0: 2.8 (the average return on Boeing stock is at least 2.8%)
H1: < 2.8
As a result, the hypothesis is considered as one-sided and left-tailed test.
Step 2: Level of significane
Assuming level of significance =5%.
Step 3: Test Statistic and observed value
Since the observation is large (n>30) and also the distribution is normal with unknown
population standard deviation σ, then the rational test statistic is . According to
Central Limit Theorem, the observation has estimated to normal distribution. Since then,
the formulas for the standard normal distribution is applied as below:
Description statistic of the return on Boeing stock is computed from the function of excel
as figured out below:
3
PHUONG THAO BUI
Which Stock Should I Invest In PHUONG THAO BUI_4

End of preview

Want to access all the pages? Upload your documents or become a member.

Related Documents
Statistics for Business and Finance Assignment
|15
|3064
|264

Comparison of Boeing Company (BA) and General Dynamics (GD) Stock Prices: Analysis and Findings
|15
|4454
|391

Statistical Analysis and Comparison between Stock Prices of Boeing Company and General Dynamics
|12
|4094
|443

Stock Return Analysis
|8
|1300
|101

Statistical Inference & Regression PDF
|9
|2780
|61

Statistics of Business and Finance - Hypothesis Testing and Interpretation
|10
|1319
|496