HLT362v: Analyzing Healthcare Data Using Descriptive Statistics

Verified

Added on  2023/06/08

|4
|687
|489
Homework Assignment
AI Summary
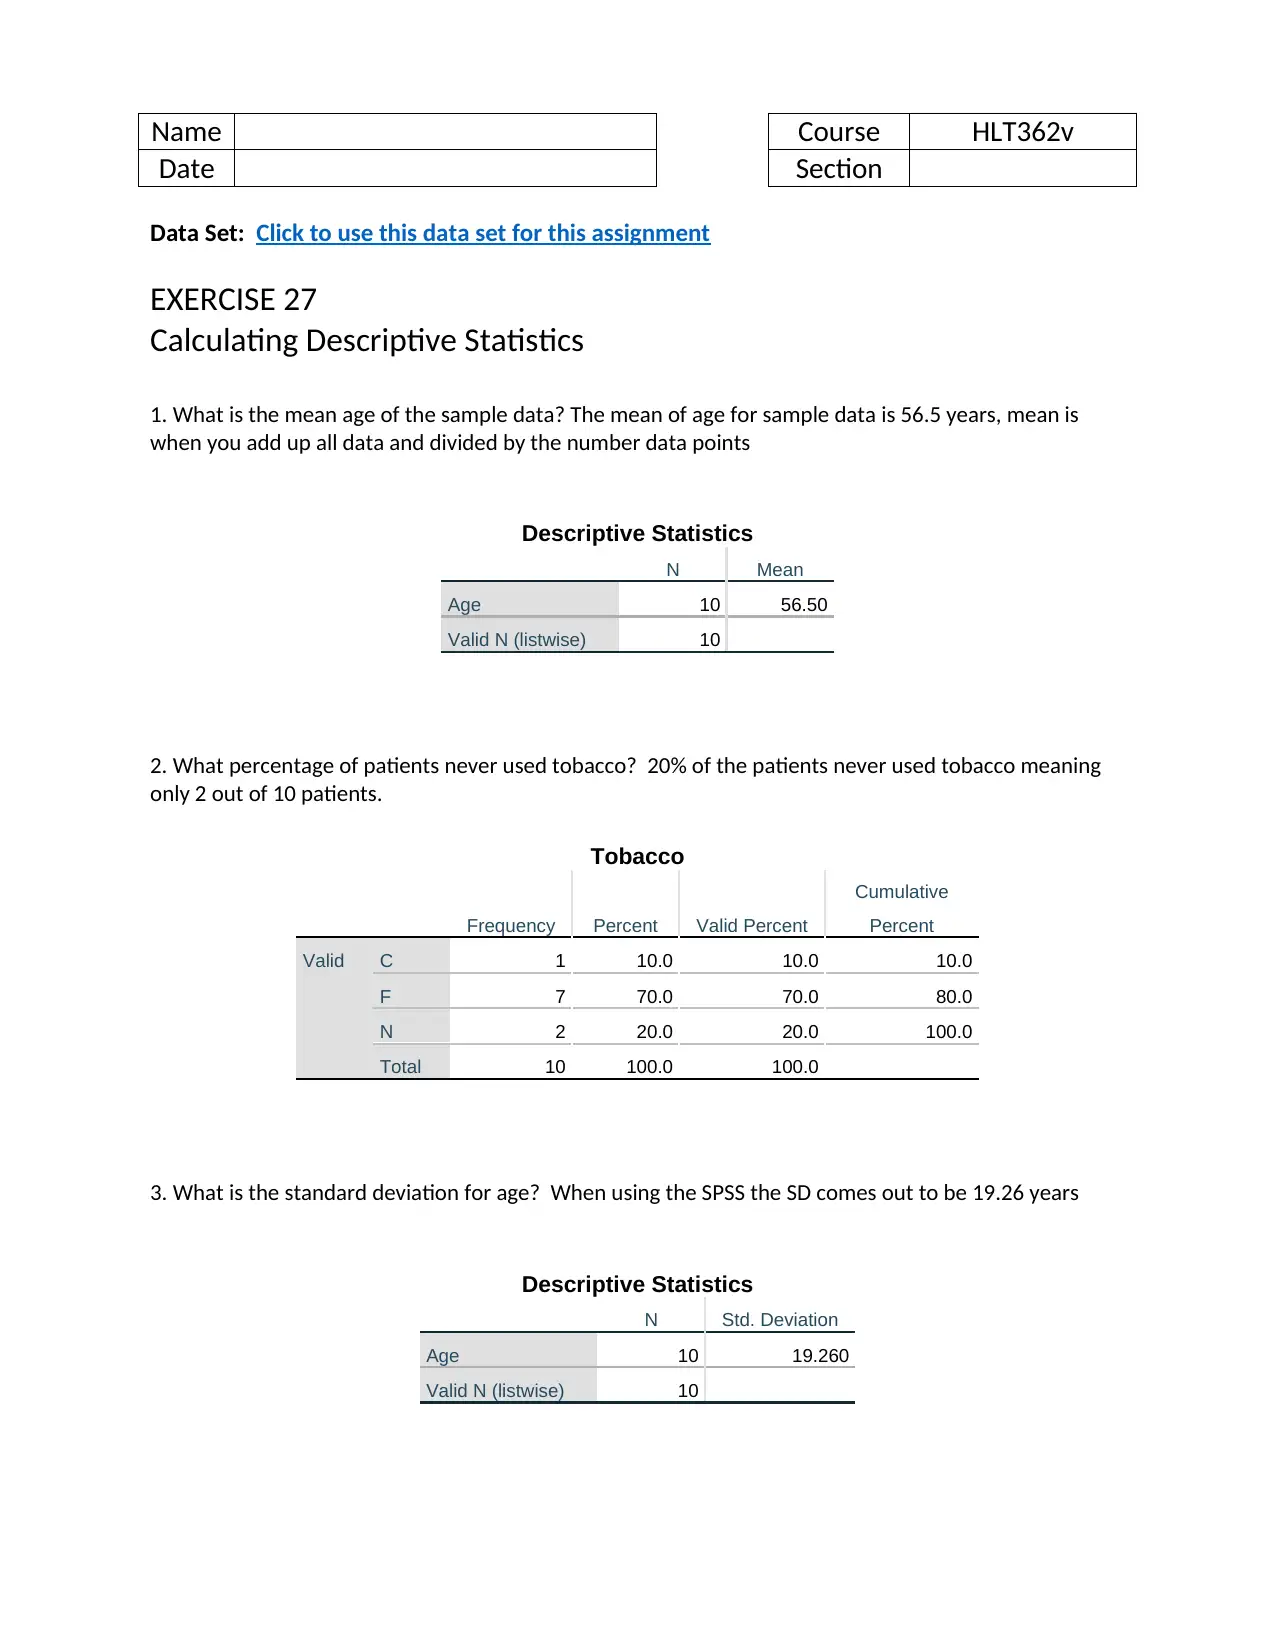
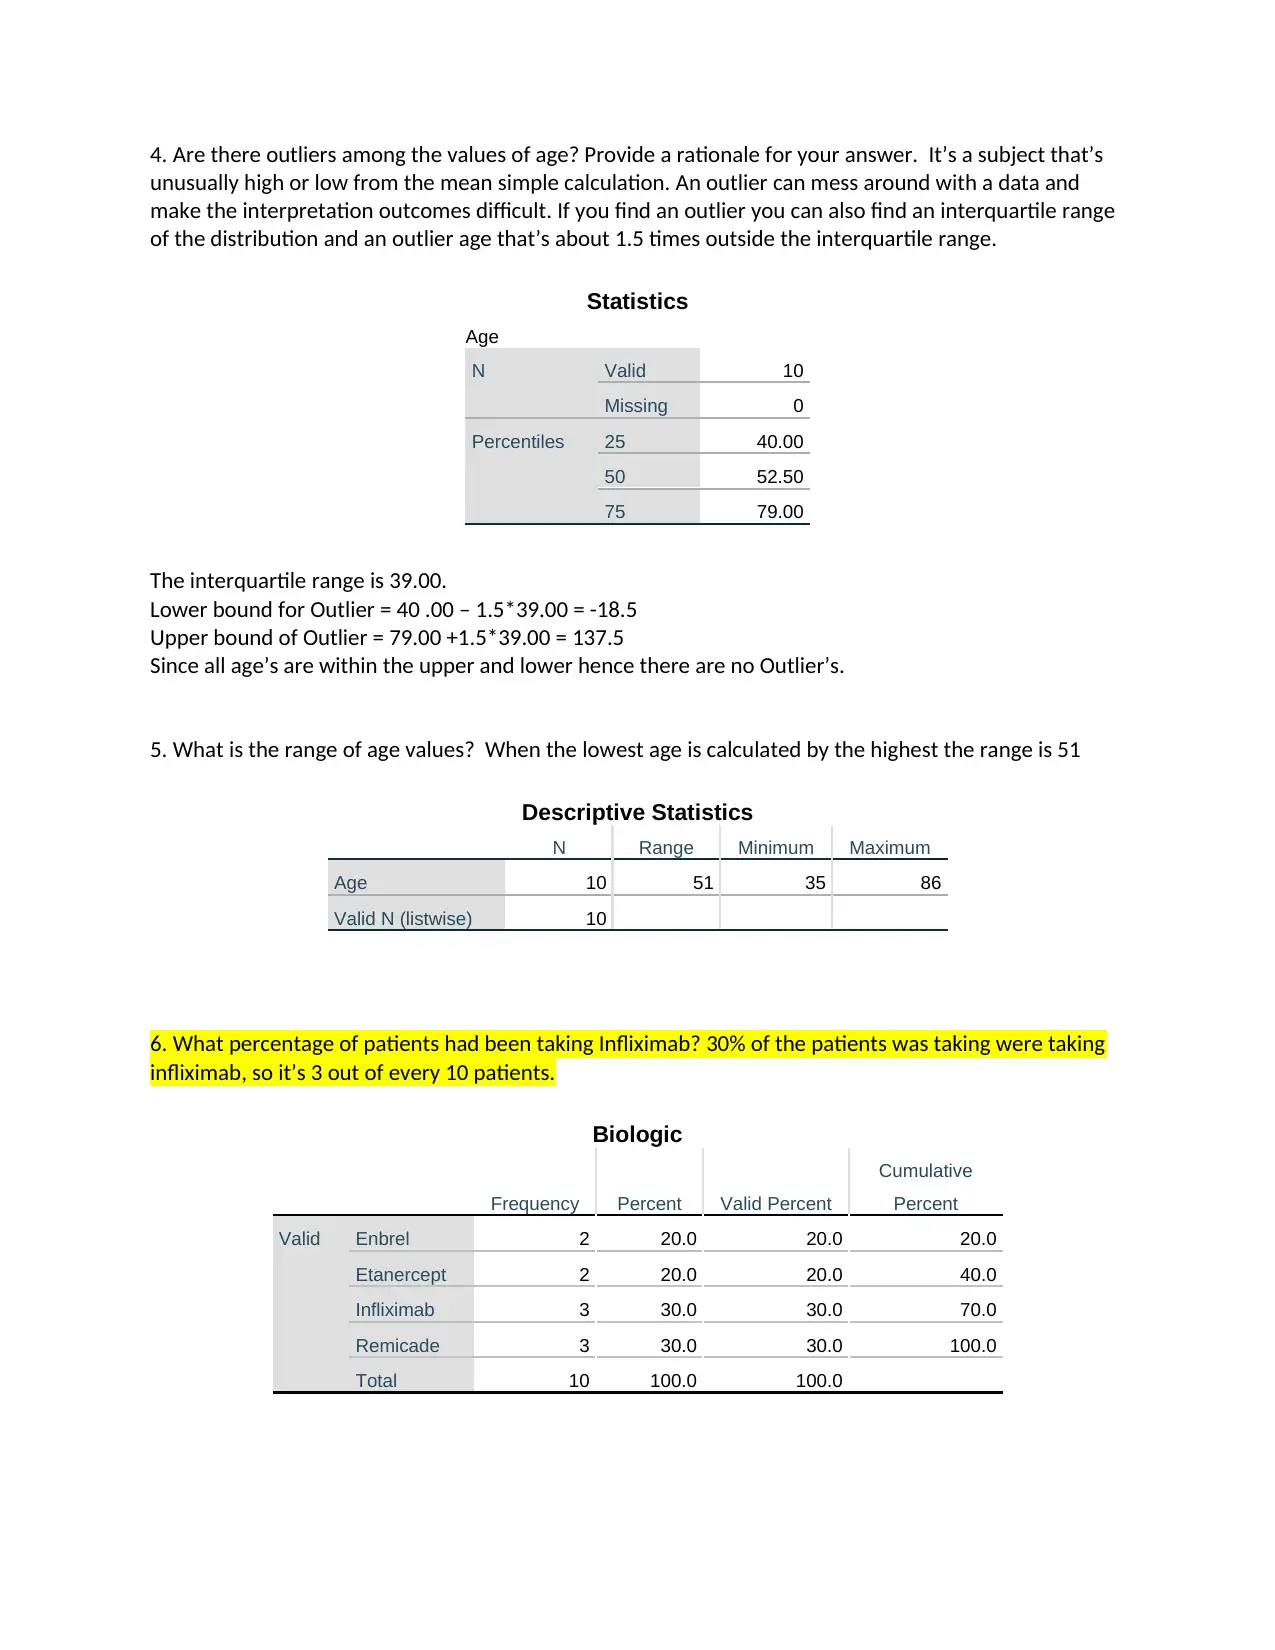
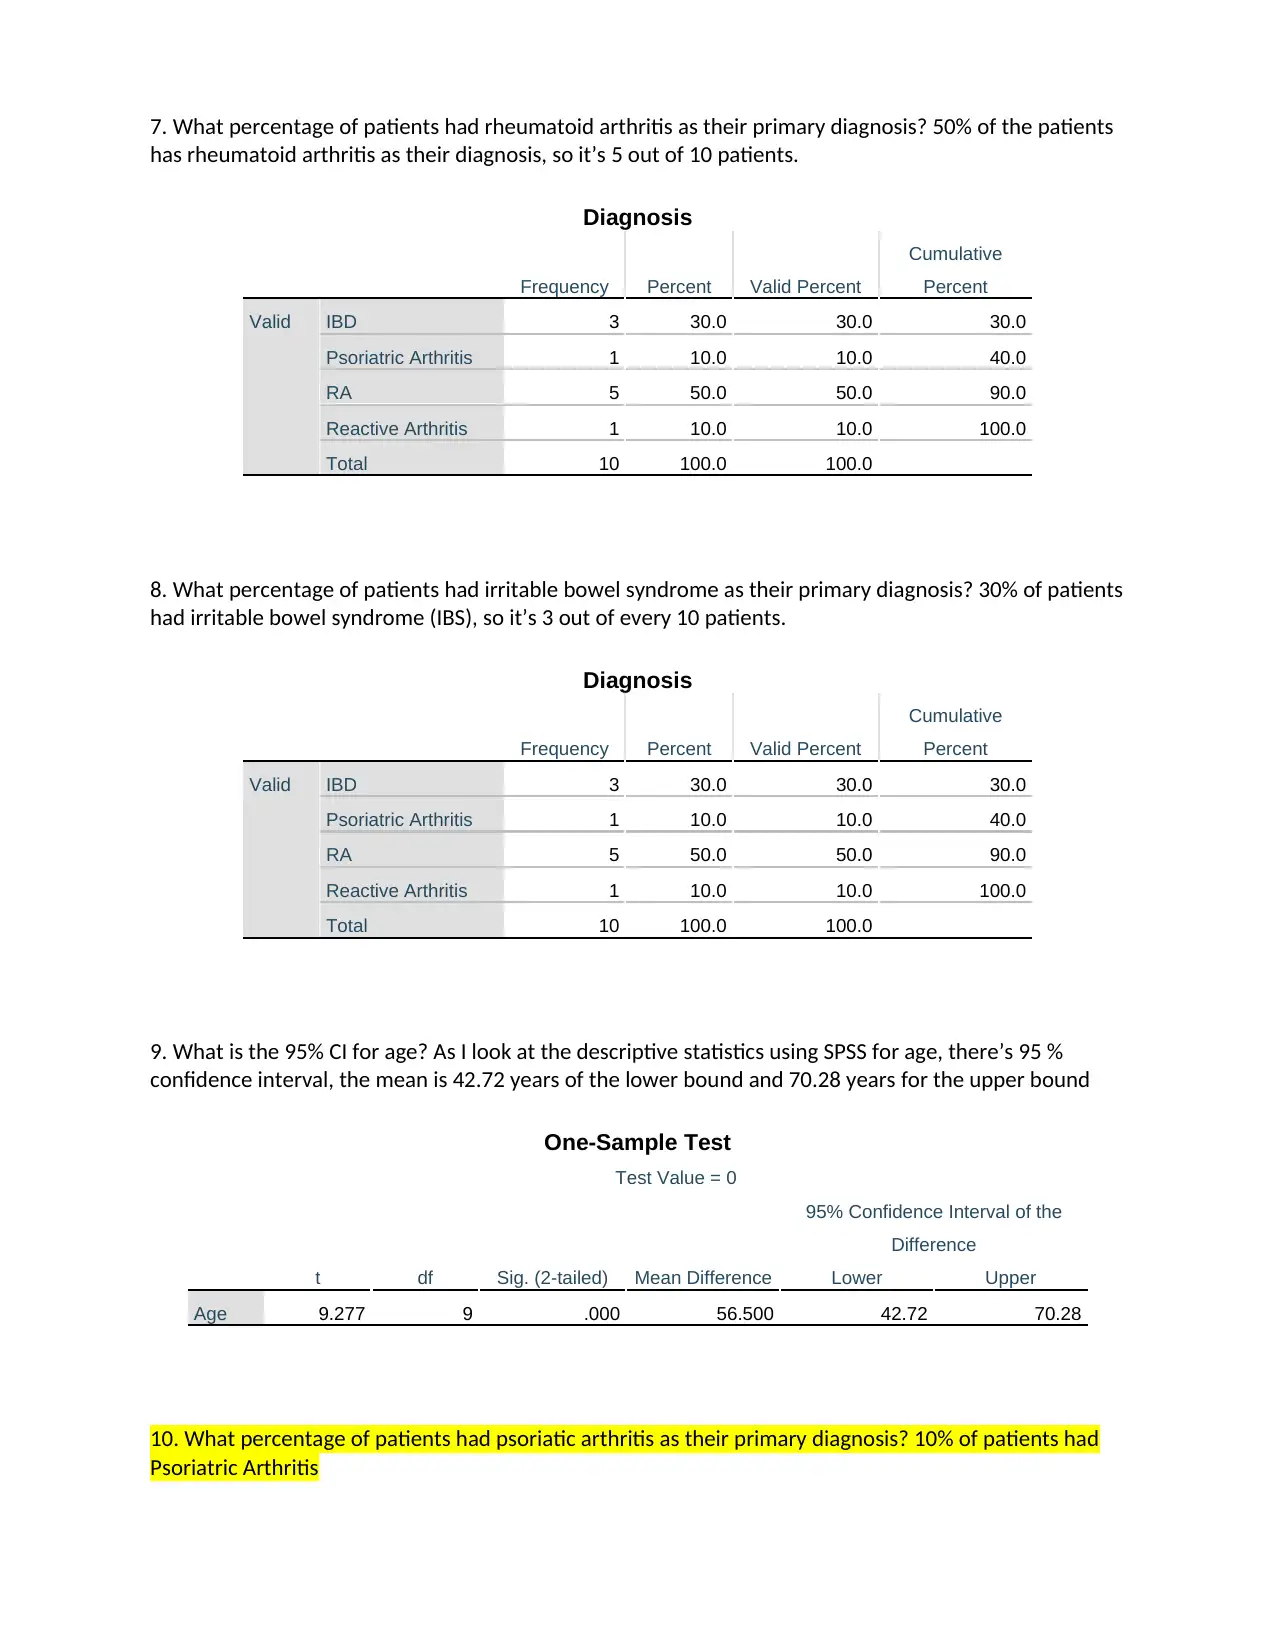
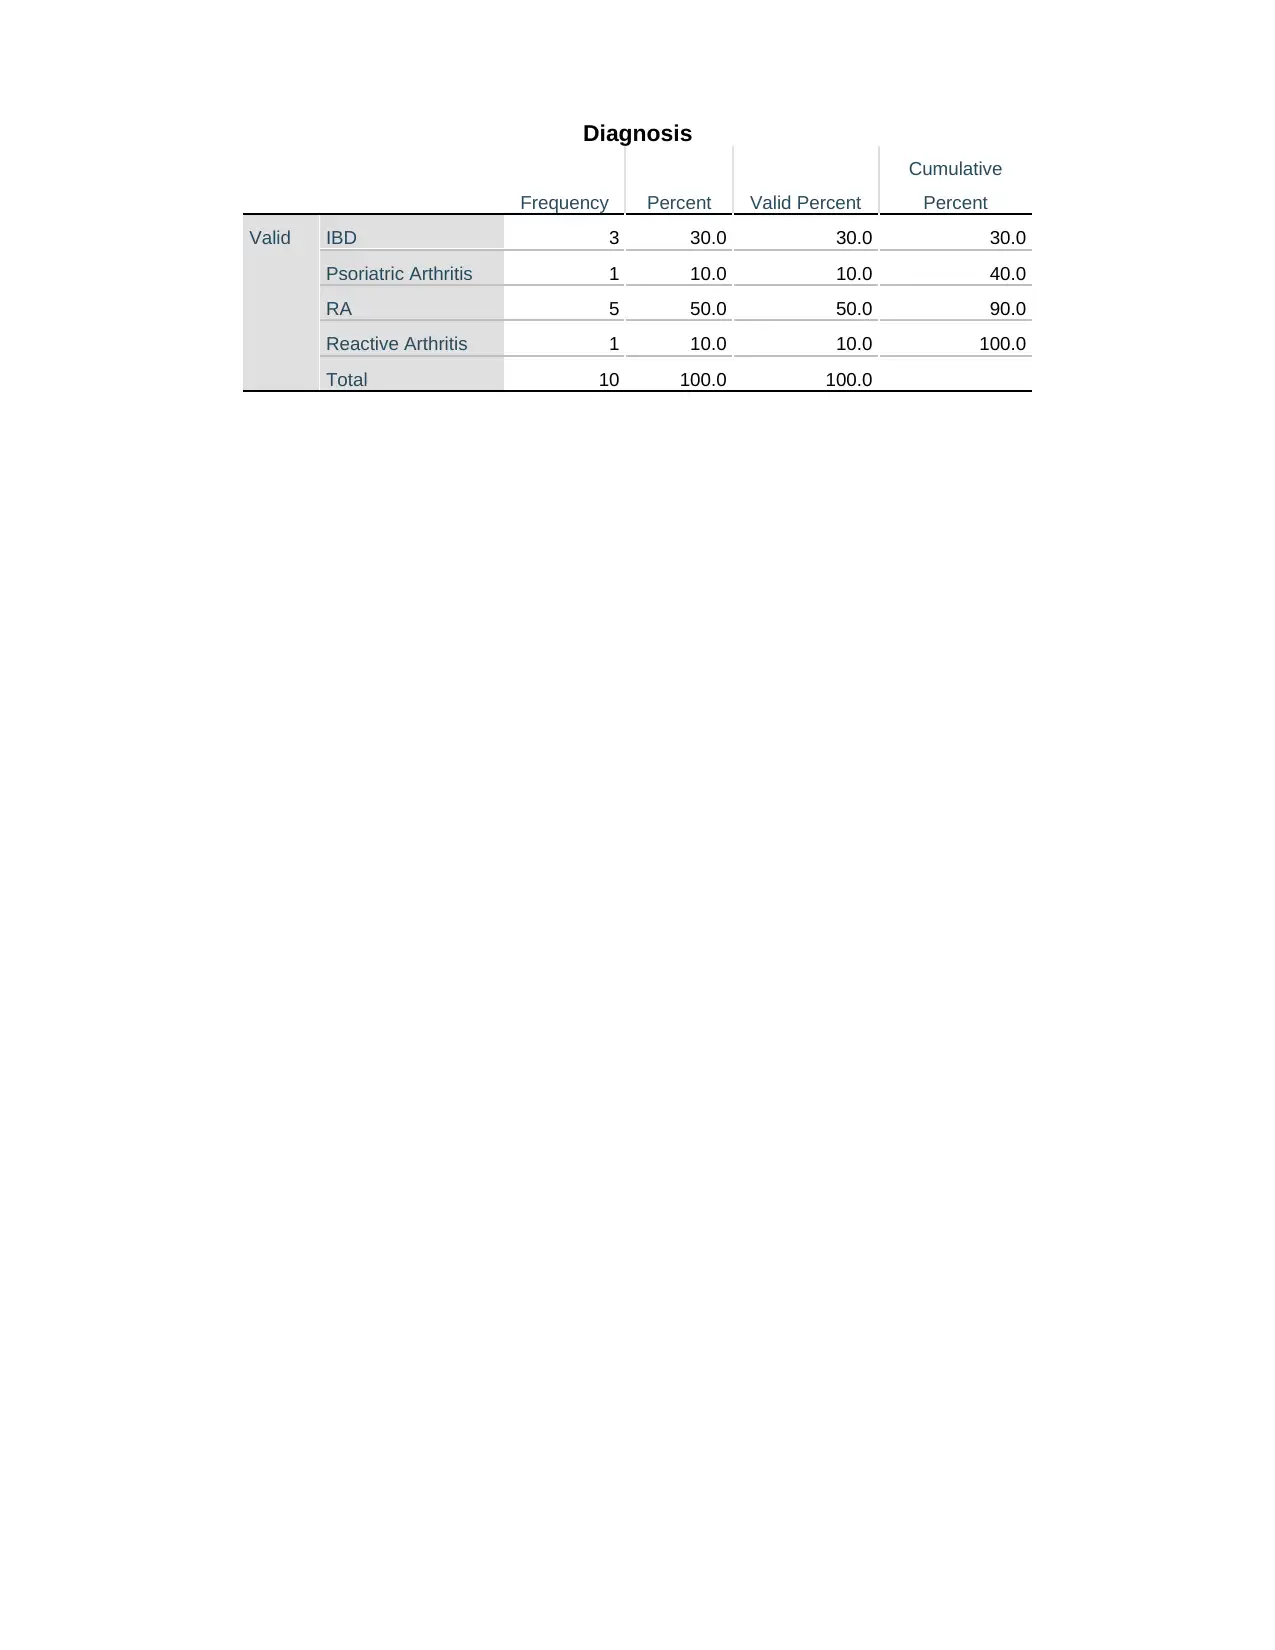
This assignment solution for HLT362v focuses on calculating and interpreting descriptive statistics from a given healthcare dataset using SPSS. It addresses questions related to mean age, percentage of patients with specific characteristics (tobacco use, Infliximab treatment, primary diagnoses), standard deviation for age, outlier analysis, range of age values, and the 95% confidence interval for age. The solution provides detailed calculations and explanations for each question, including SPSS outputs and interpretations. For example, it determines the mean age to be 56.5 years, identifies that 20% of patients never used tobacco, and calculates the standard deviation for age as 19.26 years. Furthermore, it assesses the absence of outliers in the age data by comparing the age values with calculated upper and lower bounds. The assignment also provides the percentage of patients with rheumatoid arthritis (50%) and irritable bowel syndrome (30%) as their primary diagnosis. Desklib provides access to this and other solved assignments to support student learning.
Document Page
Name Course HLT362v
Date Section
Data Set: Click to use this data set for this assignment
EXERCISE 27
Calculating Descriptive Statistics
1. What is the mean age of the sample data? The mean of age for sample data is 56.5 years, mean is
when you add up all data and divided by the number data points
Descriptive Statistics
N Mean
Age 10 56.50
Valid N (listwise) 10
2. What percentage of patients never used tobacco? 20% of the patients never used tobacco meaning
only 2 out of 10 patients.
Tobacco
Frequency Percent Valid Percent
Cumulative
Percent
Valid C 1 10.0 10.0 10.0
F 7 70.0 70.0 80.0
N 2 20.0 20.0 100.0
Total 10 100.0 100.0
3. What is the standard deviation for age? When using the SPSS the SD comes out to be 19.26 years
Descriptive Statistics
N Std. Deviation
Age 10 19.260
Valid N (listwise) 10
tabler-icon-diamond-filled.svg

Paraphrase This Document

Need a fresh take? Get an instant paraphrase of this document with our AI Paraphraser
Document Page
4. Are there outliers among the values of age? Provide a rationale for your answer. It’s a subject that’s
unusually high or low from the mean simple calculation. An outlier can mess around with a data and
make the interpretation outcomes difficult. If you find an outlier you can also find an interquartile range
of the distribution and an outlier age that’s about 1.5 times outside the interquartile range.
Statistics
Age
N Valid 10
Missing 0
Percentiles 25 40.00
50 52.50
75 79.00
The interquartile range is 39.00.
Lower bound for Outlier = 40 .00 – 1.5*39.00 = -18.5
Upper bound of Outlier = 79.00 +1.5*39.00 = 137.5
Since all age’s are within the upper and lower hence there are no Outlier’s.
5. What is the range of age values? When the lowest age is calculated by the highest the range is 51
Descriptive Statistics
N Range Minimum Maximum
Age 10 51 35 86
Valid N (listwise) 10
6. What percentage of patients had been taking Infliximab? 30% of the patients was taking were taking
infliximab, so it’s 3 out of every 10 patients.
Biologic
Frequency Percent Valid Percent
Cumulative
Percent
Valid Enbrel 2 20.0 20.0 20.0
Etanercept 2 20.0 20.0 40.0
Infliximab 3 30.0 30.0 70.0
Remicade 3 30.0 30.0 100.0
Total 10 100.0 100.0
Document Page
7. What percentage of patients had rheumatoid arthritis as their primary diagnosis? 50% of the patients
has rheumatoid arthritis as their diagnosis, so it’s 5 out of 10 patients.
Diagnosis
Frequency Percent Valid Percent
Cumulative
Percent
Valid IBD 3 30.0 30.0 30.0
Psoriatric Arthritis 1 10.0 10.0 40.0
RA 5 50.0 50.0 90.0
Reactive Arthritis 1 10.0 10.0 100.0
Total 10 100.0 100.0
8. What percentage of patients had irritable bowel syndrome as their primary diagnosis? 30% of patients
had irritable bowel syndrome (IBS), so it’s 3 out of every 10 patients.
Diagnosis
Frequency Percent Valid Percent
Cumulative
Percent
Valid IBD 3 30.0 30.0 30.0
Psoriatric Arthritis 1 10.0 10.0 40.0
RA 5 50.0 50.0 90.0
Reactive Arthritis 1 10.0 10.0 100.0
Total 10 100.0 100.0
9. What is the 95% CI for age? As I look at the descriptive statistics using SPSS for age, there’s 95 %
confidence interval, the mean is 42.72 years of the lower bound and 70.28 years for the upper bound
One-Sample Test
Test Value = 0
t df Sig. (2-tailed) Mean Difference
95% Confidence Interval of the
Difference
Lower Upper
Age 9.277 9 .000 56.500 42.72 70.28
10. What percentage of patients had psoriatic arthritis as their primary diagnosis? 10% of patients had
Psoriatric Arthritis
Document Page
Diagnosis
Frequency Percent Valid Percent
Cumulative
Percent
Valid IBD 3 30.0 30.0 30.0
Psoriatric Arthritis 1 10.0 10.0 40.0
RA 5 50.0 50.0 90.0
Reactive Arthritis 1 10.0 10.0 100.0
Total 10 100.0 100.0
chevron_up_icon
1 out of 4
circle_padding
hide_on_mobile
zoom_out_icon
[object Object]