Downstream Supply Chain Optimisation in Coca-Cola Bottling
VerifiedAdded on 2023/06/15
|41
|12116
|248
Project
AI Summary
This project focuses on optimising the downstream supply chain of Aujan Coca-Cola Bottling Company (ACCBC), a subsidiary of Coca-Cola in the UAE. The study identifies the problem of domestic distribution inefficiencies and aims to reduce shipment costs by integrating various modes of transport using linear programming techniques in Excel Solver. The research includes a literature review supporting the use of mathematical optimisation models, particularly linear programming, for supply chain management. The project also addresses Coca-Cola's Mission 2020 goals, including reducing carbon footprint. Data analysis reflects key findings and recommendations for improving ACCBC's outbound logistics.
Downstream supply chain Optimisation
1 | P a g e
Logistics and Supply Chain: An
analysis of the logistics functions
within Coca Cola Ltd Industry
1 | P a g e
Logistics and Supply Chain: An
analysis of the logistics functions
within Coca Cola Ltd Industry
Paraphrase This Document
Need a fresh take? Get an instant paraphrase of this document with our AI Paraphraser
Downstream supply chain Optimisation
ABSTRACT
The role played by Coca-Cola industries has a great impact on communities globally, this is due
to the reason that they provide largest seller of beverage and still selling all around the world, in
this condition it is necessary to optimize this organization in every possible way. In this report
we have tried to optimize the downstream supply chain of a company which is named as
ACCBC, which is subsidiary of Coca-Cola company in UAE. After defining the problem, we
have tried to optimize and integrate the all modes of transport with the help of linear
programming technique using excel solver. We have shown that integrating various mode of
transport can reduce the shipment cost to some extent. Various literature review is given to
support our findings,
2 | P a g e
Downstream supply chain Optimisation
Contents
Introduction......................................................................................................................................4
Mission 2020...............................................................................................................................4
Literature review..............................................................................................................................5
Background..................................................................................................................................5
Present Scenario...........................................................................................................................6
Problem Statement...........................................................................................................................8
Research methodology.....................................................................................................................9
Research Method.........................................................................................................................9
Data Collection..........................................................................................................................10
Data analysis and reflection of key findings..................................................................................14
Reduction of CO2 emission in this optimisation............................................................................18
Recommendation from the analysis...............................................................................................18
Conclusion.....................................................................................................................................18
References......................................................................................................................................19
3 | P a g e
⊘ This is a preview!⊘
Do you want full access?
Subscribe today to unlock all pages.
Trusted by 1+ million students worldwide
Downstream supply chain Optimisation
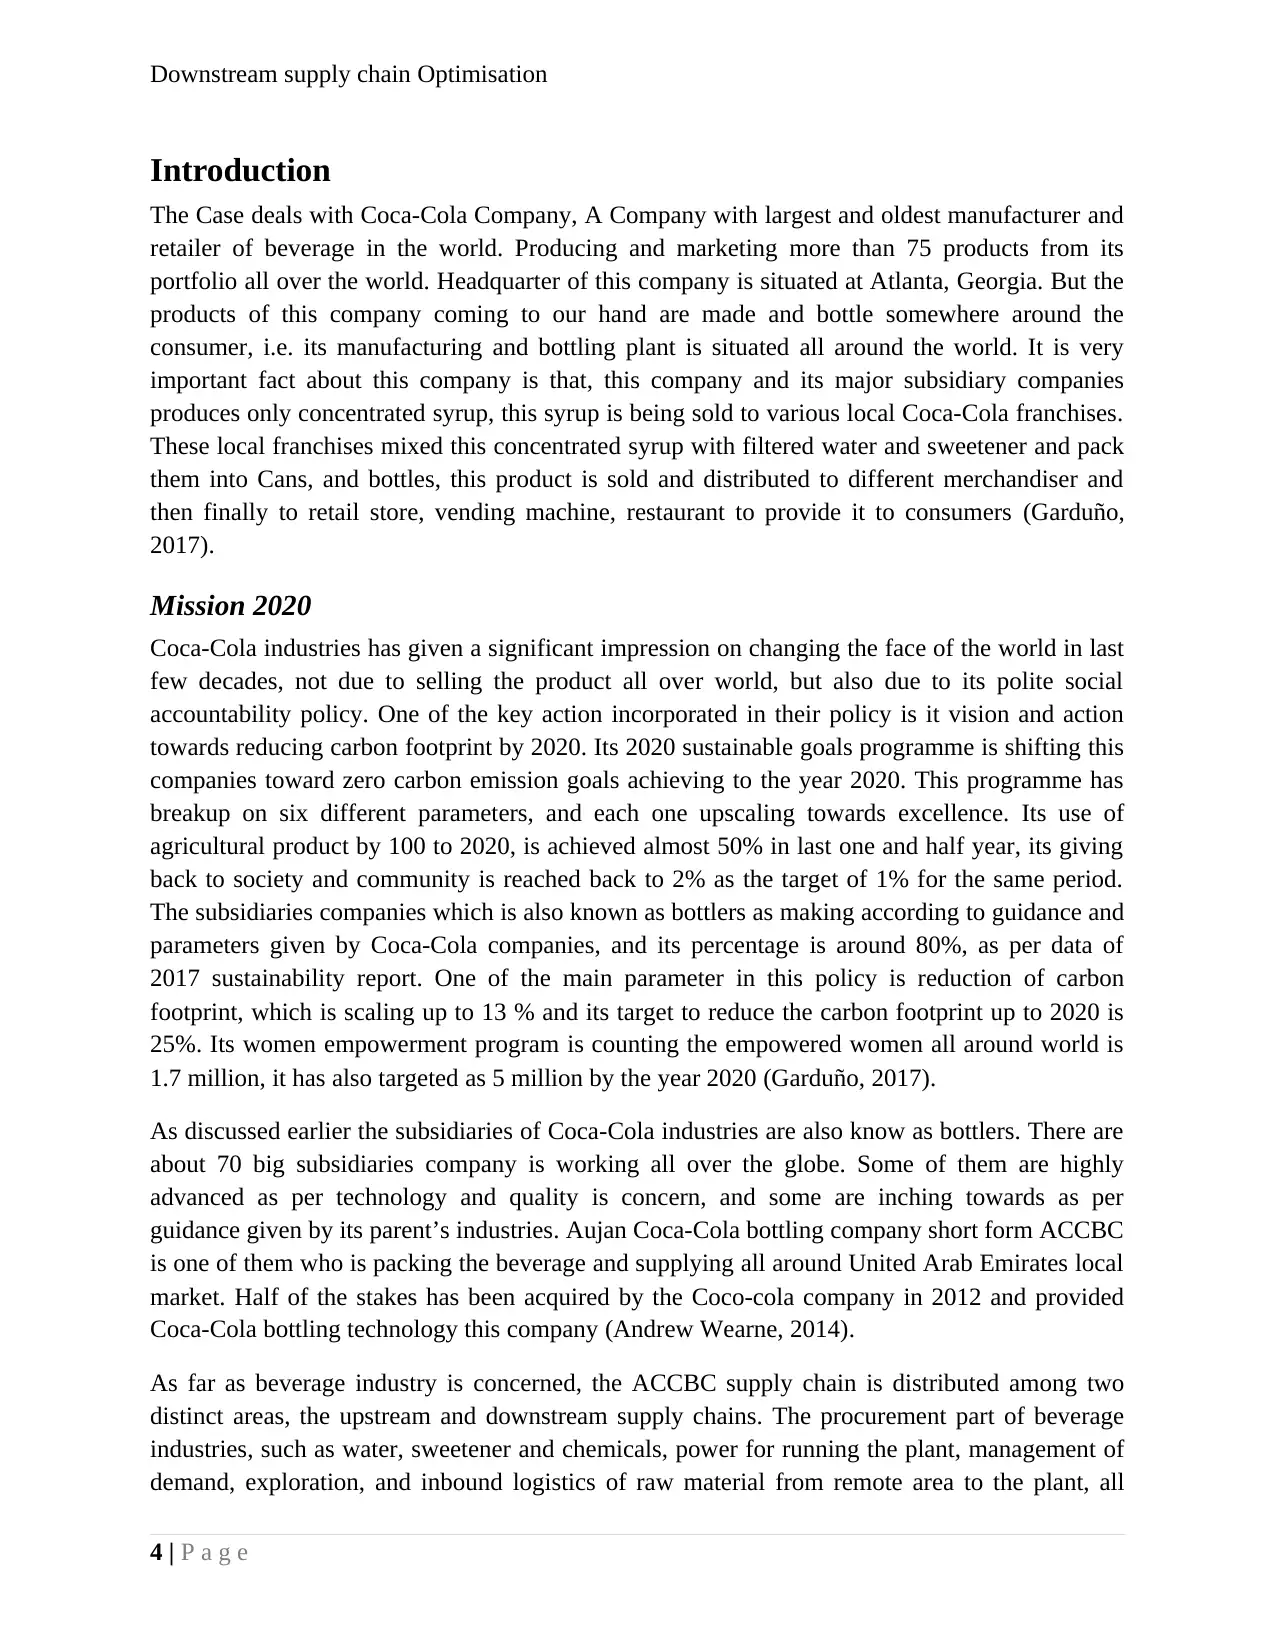
Introduction
The Case deals with Coca-Cola Company, A Company with largest and oldest manufacturer and
retailer of beverage in the world. Producing and marketing more than 75 products from its
portfolio all over the world. Headquarter of this company is situated at Atlanta, Georgia. But the
products of this company coming to our hand are made and bottle somewhere around the
consumer, i.e. its manufacturing and bottling plant is situated all around the world. It is very
important fact about this company is that, this company and its major subsidiary companies
produces only concentrated syrup, this syrup is being sold to various local Coca-Cola franchises.
These local franchises mixed this concentrated syrup with filtered water and sweetener and pack
them into Cans, and bottles, this product is sold and distributed to different merchandiser and
then finally to retail store, vending machine, restaurant to provide it to consumers (Garduño,
2017).
Mission 2020
Coca-Cola industries has given a significant impression on changing the face of the world in last
few decades, not due to selling the product all over world, but also due to its polite social
accountability policy. One of the key action incorporated in their policy is it vision and action
towards reducing carbon footprint by 2020. Its 2020 sustainable goals programme is shifting this
companies toward zero carbon emission goals achieving to the year 2020. This programme has
breakup on six different parameters, and each one upscaling towards excellence. Its use of
agricultural product by 100 to 2020, is achieved almost 50% in last one and half year, its giving
back to society and community is reached back to 2% as the target of 1% for the same period.
The subsidiaries companies which is also known as bottlers as making according to guidance and
parameters given by Coca-Cola companies, and its percentage is around 80%, as per data of
2017 sustainability report. One of the main parameter in this policy is reduction of carbon
footprint, which is scaling up to 13 % and its target to reduce the carbon footprint up to 2020 is
25%. Its women empowerment program is counting the empowered women all around world is
1.7 million, it has also targeted as 5 million by the year 2020 (Garduño, 2017).
As discussed earlier the subsidiaries of Coca-Cola industries are also know as bottlers. There are
about 70 big subsidiaries company is working all over the globe. Some of them are highly
advanced as per technology and quality is concern, and some are inching towards as per
guidance given by its parent’s industries. Aujan Coca-Cola bottling company short form ACCBC
is one of them who is packing the beverage and supplying all around United Arab Emirates local
market. Half of the stakes has been acquired by the Coco-cola company in 2012 and provided
Coca-Cola bottling technology this company (Andrew Wearne, 2014).
As far as beverage industry is concerned, the ACCBC supply chain is distributed among two
distinct areas, the upstream and downstream supply chains. The procurement part of beverage
industries, such as water, sweetener and chemicals, power for running the plant, management of
demand, exploration, and inbound logistics of raw material from remote area to the plant, all
4 | P a g e
Paraphrase This Document
Need a fresh take? Get an instant paraphrase of this document with our AI Paraphraser
Downstream supply chain Optimisation
comes under upstream supply chain. The down steam of supply chain consists of outbound
logistics, of finished concentrated syrup, forecasting of market, delivery of concentrated syrup to
the bottlers all over the world. The problem and solution are available in both the areas equally,
but my project in concerned about outbound logistics of the ACCBC limited.
Since product of beverage company is not having very complex process, this can be
accommodating in one plant activity, but a company like Coca-Cola who is having worldwide
presence, then it is a long process and time consuming also. As discussed above sweetener,
chemical and water are primarily the raw material for beverage industries. The process starts
with distillation which process water for various kind of chemical mixing including sweetener.
The processed water further goes to mixing with other chemical as raw material for packed in a
large container for shipping operation. This is the second stage of Coca-Cola process in which
we are getting various types of beverage in our hand, For the case of Coca-Cola it may be Coke,
Fanta, Sprite and so many other products under the brand of same company.
Literature review
Background
The best way to optimise the any supply chain system mathematical optimisation model, this is
because of the reason that, every system of supply chain is has some unique characteristics in
itself, and designing a commercial information system is difficult which can cover all the area of
supply chain for any industries. Most of the industries are procuring customised information
system according to their need. And second thing is that, basic of this system starts from
quantifying the problem and their solution according to our need of optimisation, which need
mathematics, number of crunchy data and its interpretation to achieve optimisation (Beaven,
2014).
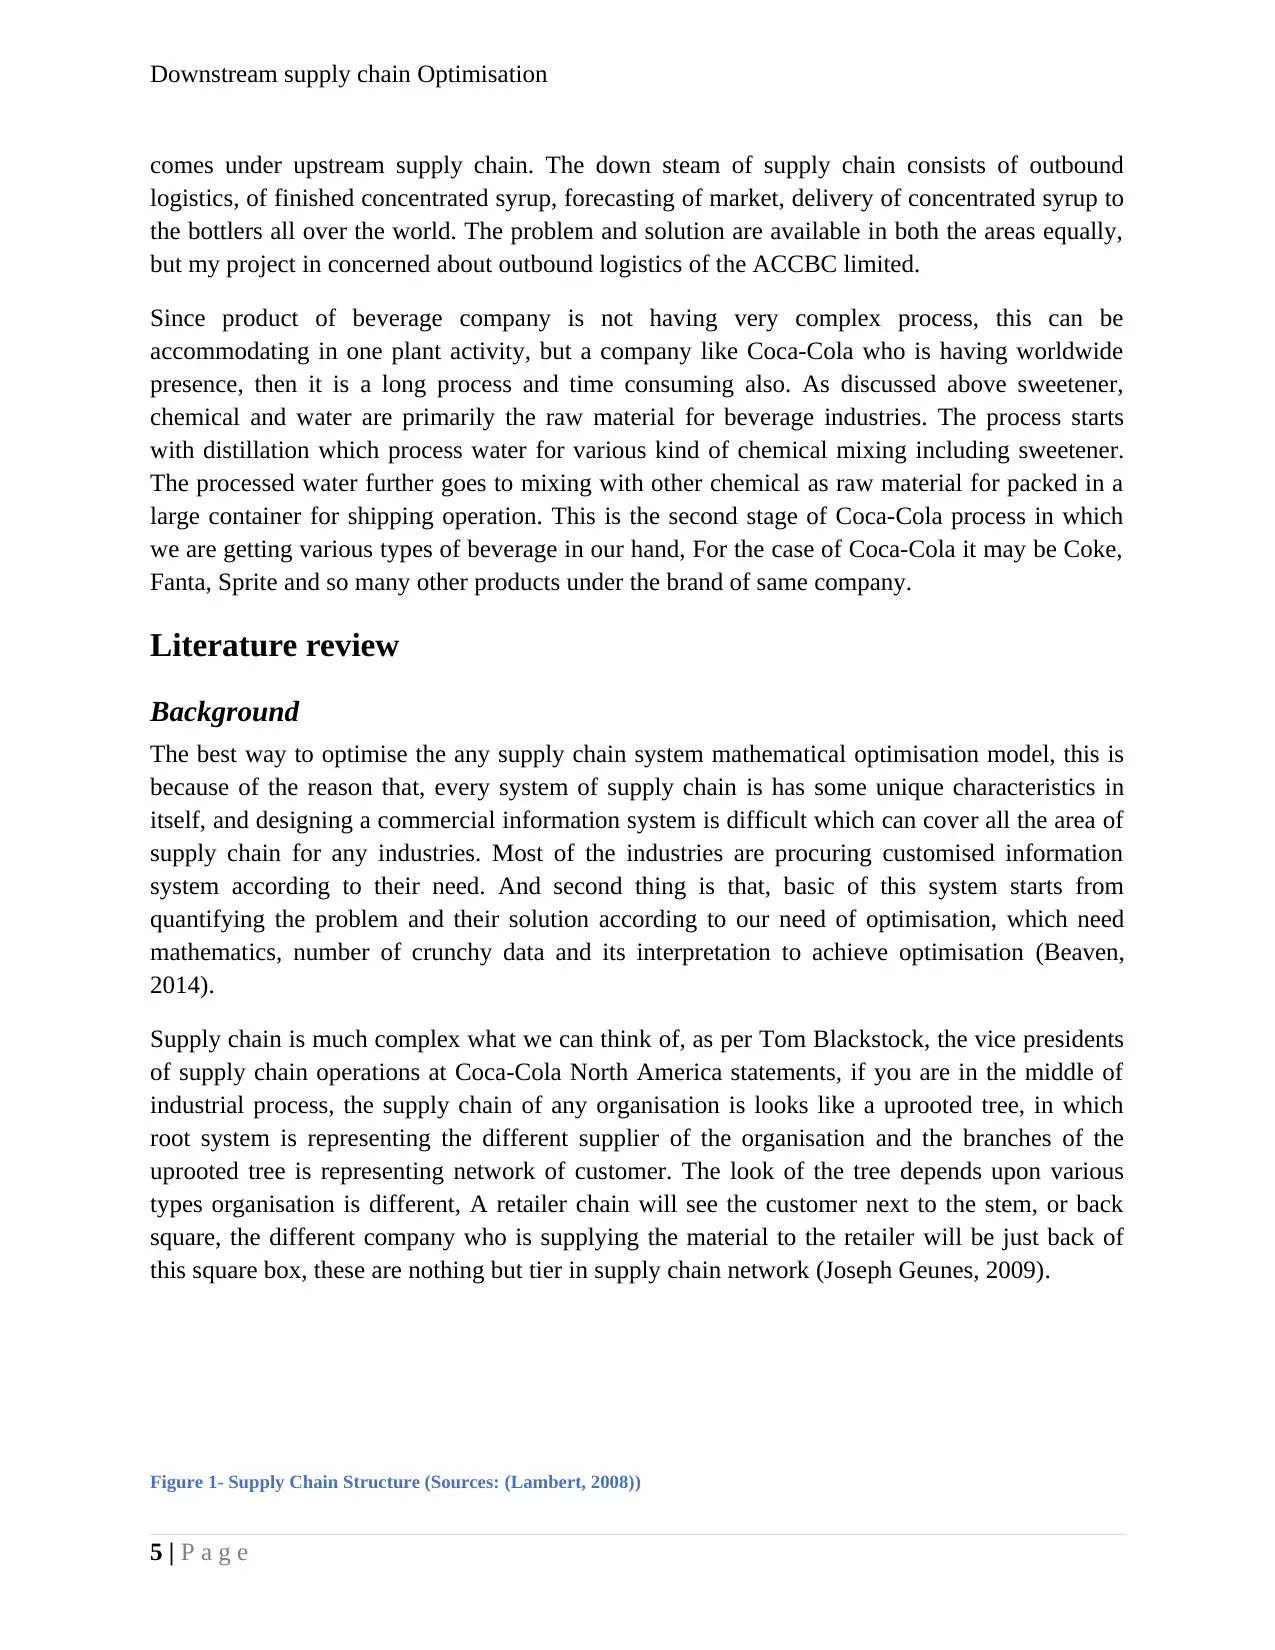
Supply chain is much complex what we can think of, as per Tom Blackstock, the vice presidents
of supply chain operations at Coca-Cola North America statements, if you are in the middle of
industrial process, the supply chain of any organisation is looks like a uprooted tree, in which
root system is representing the different supplier of the organisation and the branches of the
uprooted tree is representing network of customer. The look of the tree depends upon various
types organisation is different, A retailer chain will see the customer next to the stem, or back
square, the different company who is supplying the material to the retailer will be just back of
this square box, these are nothing but tier in supply chain network (Joseph Geunes, 2009).
Figure 1- Supply Chain Structure (Sources: (Lambert, 2008))
5 | P a g e
comes under upstream supply chain. The down steam of supply chain consists of outbound
logistics, of finished concentrated syrup, forecasting of market, delivery of concentrated syrup to
the bottlers all over the world. The problem and solution are available in both the areas equally,
but my project in concerned about outbound logistics of the ACCBC limited.
Since product of beverage company is not having very complex process, this can be
accommodating in one plant activity, but a company like Coca-Cola who is having worldwide
presence, then it is a long process and time consuming also. As discussed above sweetener,
chemical and water are primarily the raw material for beverage industries. The process starts
with distillation which process water for various kind of chemical mixing including sweetener.
The processed water further goes to mixing with other chemical as raw material for packed in a
large container for shipping operation. This is the second stage of Coca-Cola process in which
we are getting various types of beverage in our hand, For the case of Coca-Cola it may be Coke,
Fanta, Sprite and so many other products under the brand of same company.
Literature review
Background
The best way to optimise the any supply chain system mathematical optimisation model, this is
because of the reason that, every system of supply chain is has some unique characteristics in
itself, and designing a commercial information system is difficult which can cover all the area of
supply chain for any industries. Most of the industries are procuring customised information
system according to their need. And second thing is that, basic of this system starts from
quantifying the problem and their solution according to our need of optimisation, which need
mathematics, number of crunchy data and its interpretation to achieve optimisation (Beaven,
2014).
Supply chain is much complex what we can think of, as per Tom Blackstock, the vice presidents
of supply chain operations at Coca-Cola North America statements, if you are in the middle of
industrial process, the supply chain of any organisation is looks like a uprooted tree, in which
root system is representing the different supplier of the organisation and the branches of the
uprooted tree is representing network of customer. The look of the tree depends upon various
types organisation is different, A retailer chain will see the customer next to the stem, or back
square, the different company who is supplying the material to the retailer will be just back of
this square box, these are nothing but tier in supply chain network (Joseph Geunes, 2009).
Figure 1- Supply Chain Structure (Sources: (Lambert, 2008))
5 | P a g e
Downstream supply chain Optimisation
Supply chain is a complex task, but its management is more complex and challenging, managing
all supplier who is just behind you and serving all the customer according to their needs which
out to the forward from your side is overwhelming task, most of the supply chain manager
always try to manage their supply chain to the point of consumption, this main reason behind this
viewpoint is that those who have strong relationship with end customer, they have power in their
supply chain. The same theory fits best with the Coca-Cola Company, most of the acquisition
and merger happened in this company is based on strong relationship with customer and their
demand fulfilment (Iyan, 2016).
Present Scenario
For this paper we have gone through several research paper like, (Joseph Geunes, 2009),
(Michael Talmadge, 2016), (Štefan Kudláč, 2017), etc., all these has pioneer work in
mathematical modelling in various industries. The main aspect of all these literature reveals that
linear programming model best tools which can be employed for optimization problem. Stefan
states that the strategy of logistical planning can be best suited with linear programming model;
we can include the type of bulk transportation for solving the problem of distribution. The model
given by Li is based on nonlinear programming and several petroleum refineries and obtained
very effective result for integrated planning network. The formulation given by Neiro and Pinto
had given a very wide spectrum of refineries production with the help of mixed integer and non-
linear programming model which also includes the optimisation process in pipeline
transportation. The analysis given by Michael enhance the levels in further level, they have
analysed whole beverage industries in three tiers and accumulated the result for overall
optimisation for any particular organisation. Instead of several analyses with the help of linear
programming, some other researchers have also given mathematical model on the basis of fuzzy
6 | P a g e
⊘ This is a preview!⊘
Do you want full access?
Subscribe today to unlock all pages.
Trusted by 1+ million students worldwide
Downstream supply chain Optimisation
logics, stochastic demands and discrete analysis. To maintain connectivity between productions
plant to warehouses and warehouses to customer mixed is best analysed by Persson and Göthe-
Lundgren, with the help of inequality as a constraint in the linear programming. All of the above
researches have given their analysis irrespective of environmental consideration and pollution
point of view, but (Ba-Shammakh, 2009) clearly states that, review of energy and power
consumed by these refineries section including CO2 generation is must things to do, like other
subject where inclusion of environmental aspect is necessary, analysis is also not a different from
it, we must have some environmental related analysis to this project also (Yihua Zhong, 2013).
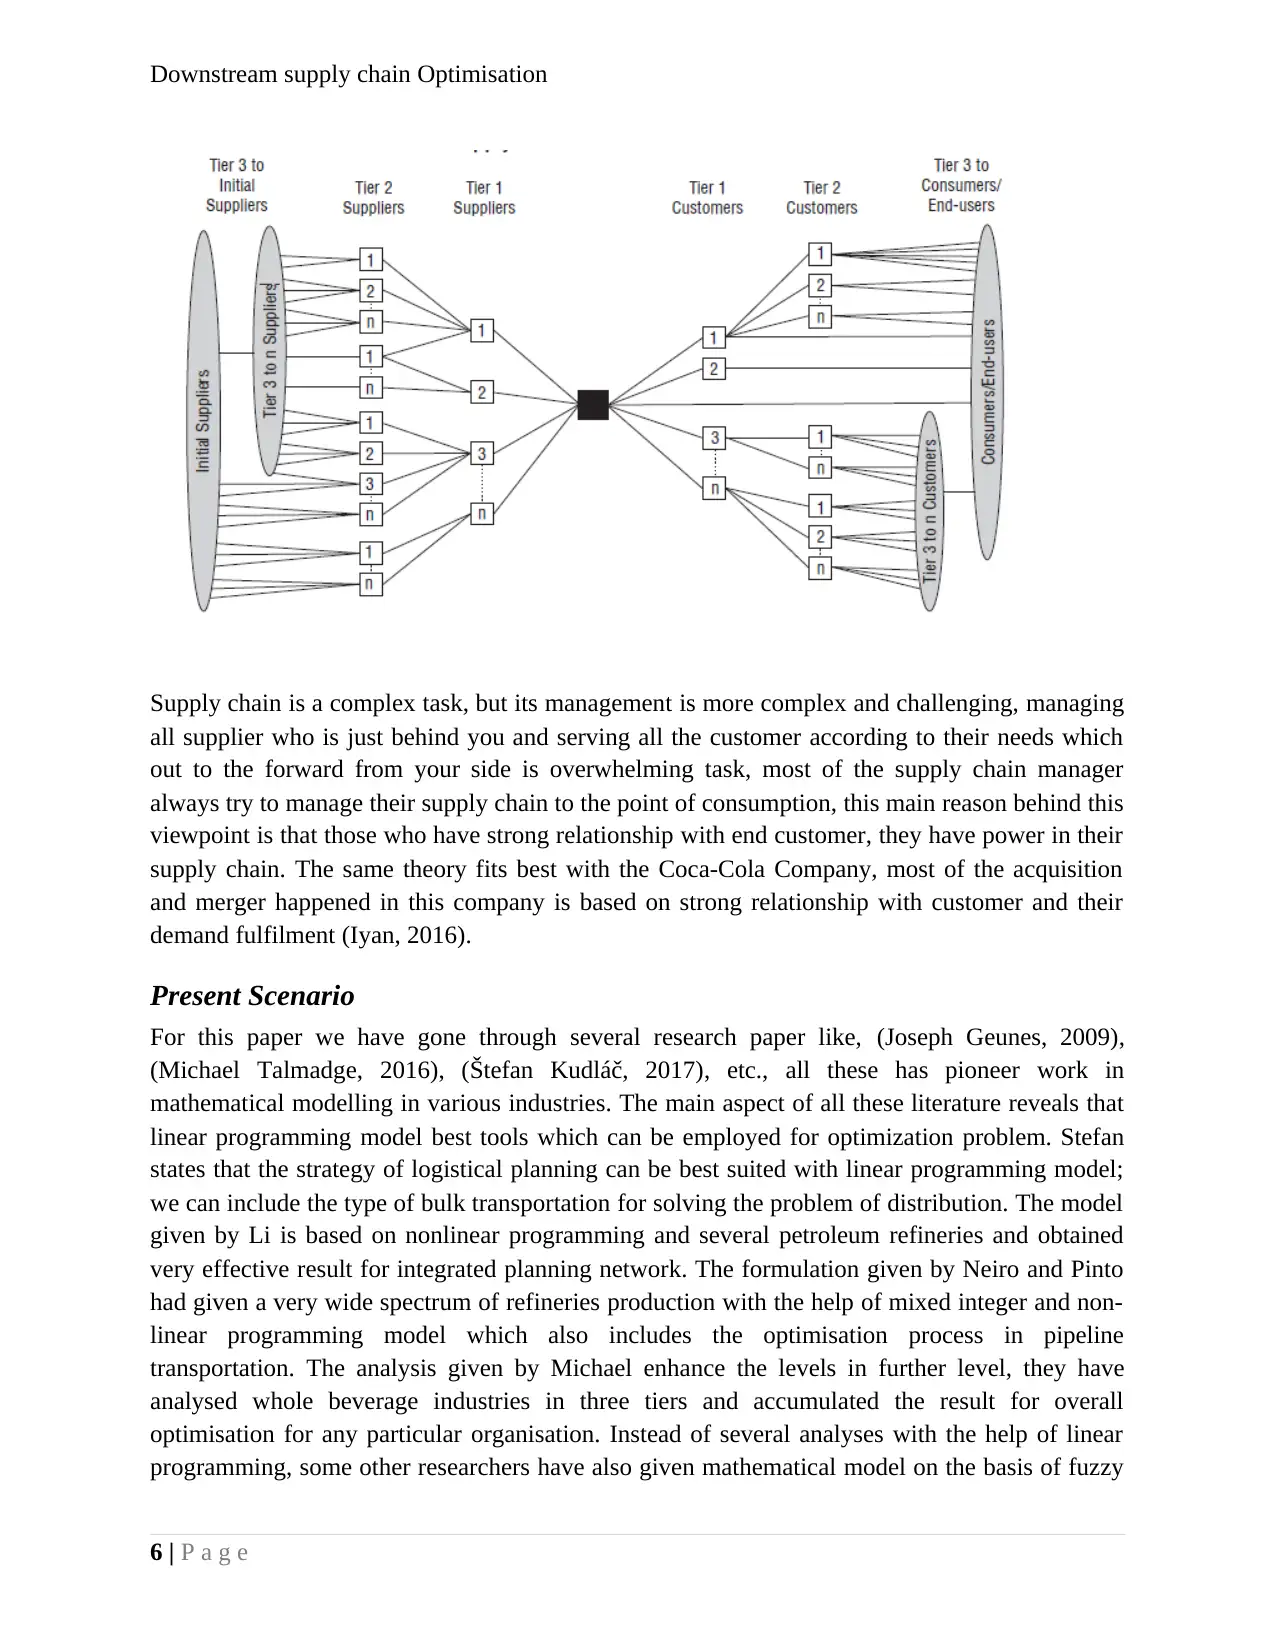
As discussed earlier, the present study is about shipping and despatch process of product from
ACCBC refineries, which also known as bottling of Coca-Cola, is since the ACCBC is partially
state-owned company, not listed in share market and does provide much data to analyse the
current situation.
Figure 2- Supply chain in for ACCBC
There ACCBC industries consists of two bottling unit and the current capacity of refining
including both the plant 800 pallets per day, in which 75 % of the product is going local five
cities. The major despatches are happening through Truck, Mini Truck and Pickup. The rest 25%
is being consumed in their rest of the cites in UAE. The project is based on these domestic
production and consumption of beverage from these five cities.
7 | P a g e
logics, stochastic demands and discrete analysis. To maintain connectivity between productions
plant to warehouses and warehouses to customer mixed is best analysed by Persson and Göthe-
Lundgren, with the help of inequality as a constraint in the linear programming. All of the above
researches have given their analysis irrespective of environmental consideration and pollution
point of view, but (Ba-Shammakh, 2009) clearly states that, review of energy and power
consumed by these refineries section including CO2 generation is must things to do, like other
subject where inclusion of environmental aspect is necessary, analysis is also not a different from
it, we must have some environmental related analysis to this project also (Yihua Zhong, 2013).
As discussed earlier, the present study is about shipping and despatch process of product from
ACCBC refineries, which also known as bottling of Coca-Cola, is since the ACCBC is partially
state-owned company, not listed in share market and does provide much data to analyse the
current situation.
Figure 2- Supply chain in for ACCBC
There ACCBC industries consists of two bottling unit and the current capacity of refining
including both the plant 800 pallets per day, in which 75 % of the product is going local five
cities. The major despatches are happening through Truck, Mini Truck and Pickup. The rest 25%
is being consumed in their rest of the cites in UAE. The project is based on these domestic
production and consumption of beverage from these five cities.
7 | P a g e
Paraphrase This Document
Need a fresh take? Get an instant paraphrase of this document with our AI Paraphraser
Downstream supply chain Optimisation
The product going to domestic market from plant is Petrol, Diesel and Octane petrol which is
also known as High speed petrol. There are five big depots for oil reserve which is used to store
the processed liquid and ready to go to the customer
Problem Statement
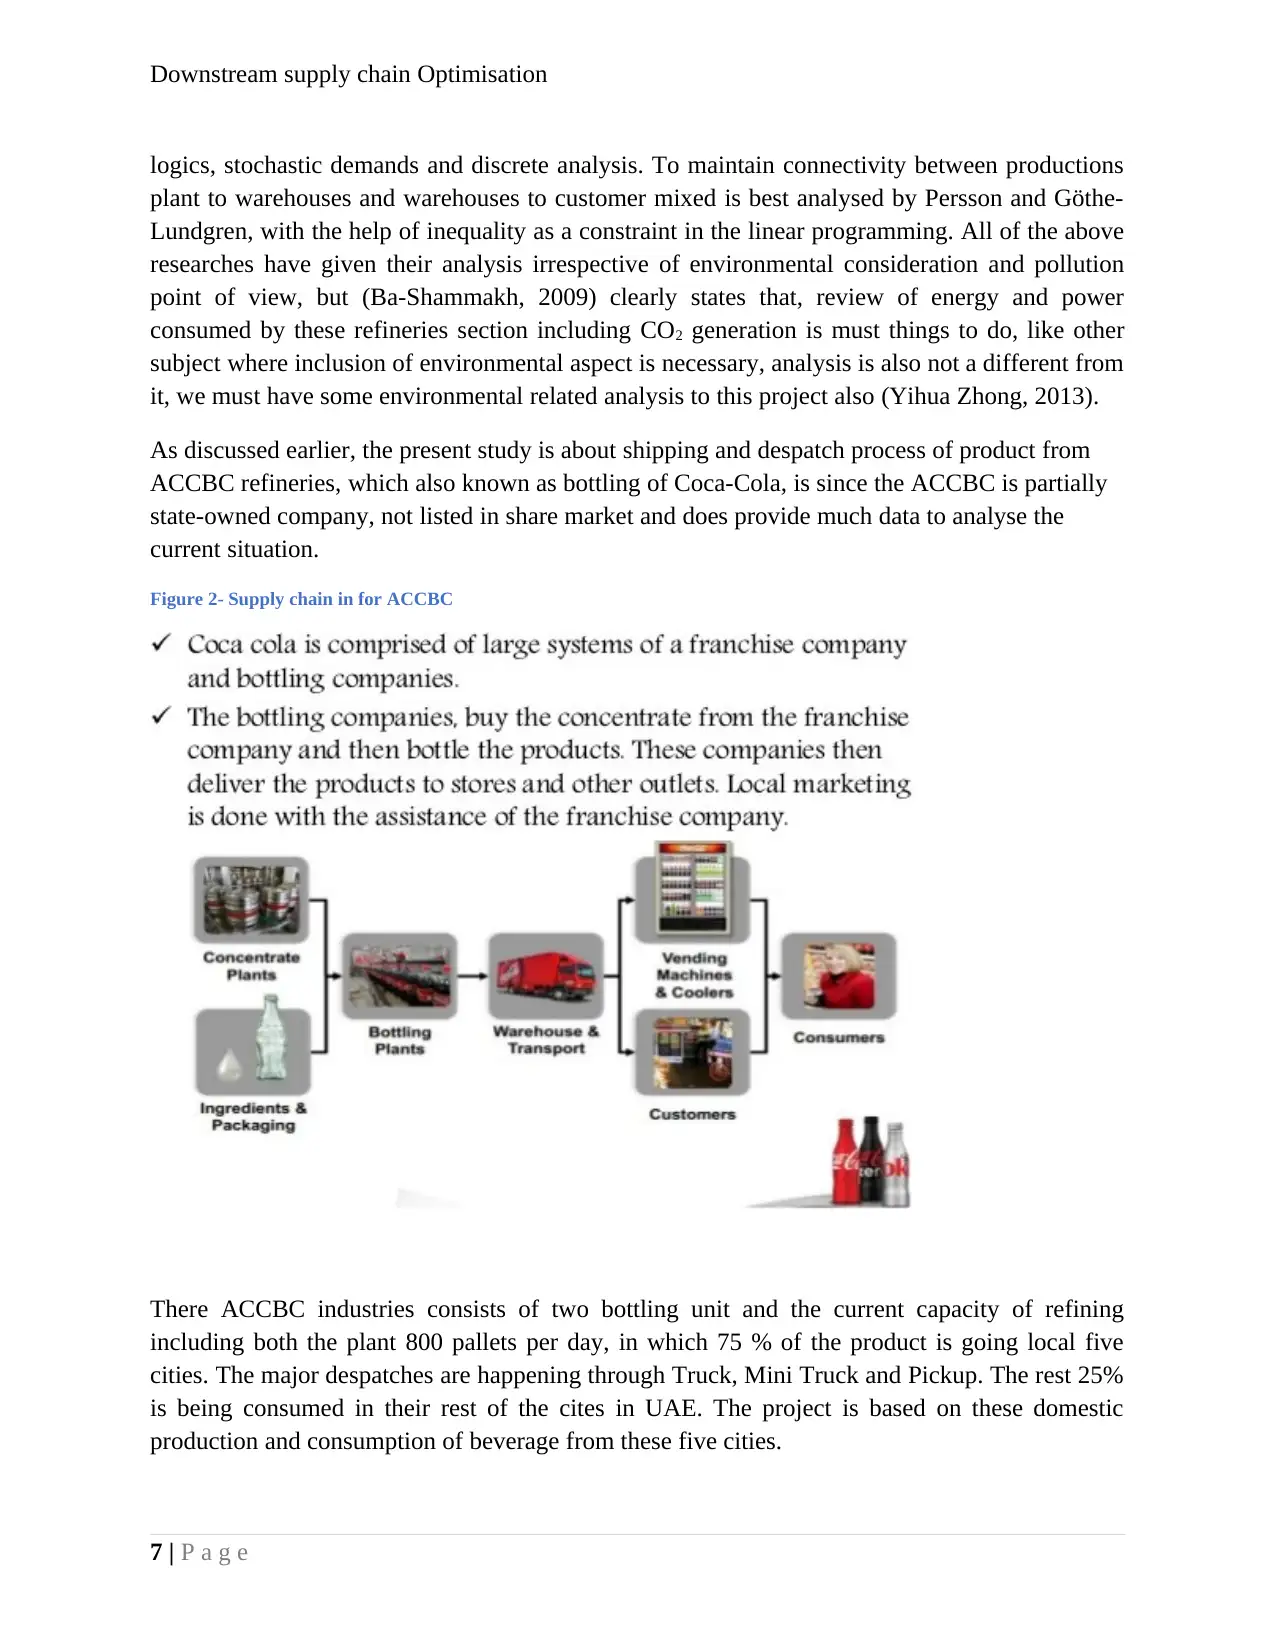
In recent years the supply chain operation for ACCBC is being performed smoothly, and not
making any supply issue news from international market. But Last two years we heard lot about
domestic distribution system. A place where oil and gas are being produced, is feeling scarcity in
beverage some places and in other places, no space to keep the Coca-Cola Product. The vehicle
which is owned by shipping and logistic company is transferring the material as usual. But due to
Figure 3-Problem with Aujan
ban opposed on Qatar, most of the companies who are hailed from Qatar are forced to leave the
UAE area, results that there is loss of some big transporter who has given their vehicle to
shipping and logistic company for transportation of product to domestic market. Due to this
reason some mismanagement has occurred within the company.
8 | P a g e
The product going to domestic market from plant is Petrol, Diesel and Octane petrol which is
also known as High speed petrol. There are five big depots for oil reserve which is used to store
the processed liquid and ready to go to the customer
Problem Statement
In recent years the supply chain operation for ACCBC is being performed smoothly, and not
making any supply issue news from international market. But Last two years we heard lot about
domestic distribution system. A place where oil and gas are being produced, is feeling scarcity in
beverage some places and in other places, no space to keep the Coca-Cola Product. The vehicle
which is owned by shipping and logistic company is transferring the material as usual. But due to
Figure 3-Problem with Aujan
ban opposed on Qatar, most of the companies who are hailed from Qatar are forced to leave the
UAE area, results that there is loss of some big transporter who has given their vehicle to
shipping and logistic company for transportation of product to domestic market. Due to this
reason some mismanagement has occurred within the company.
8 | P a g e
Downstream supply chain Optimisation
Research methodology
Research Method
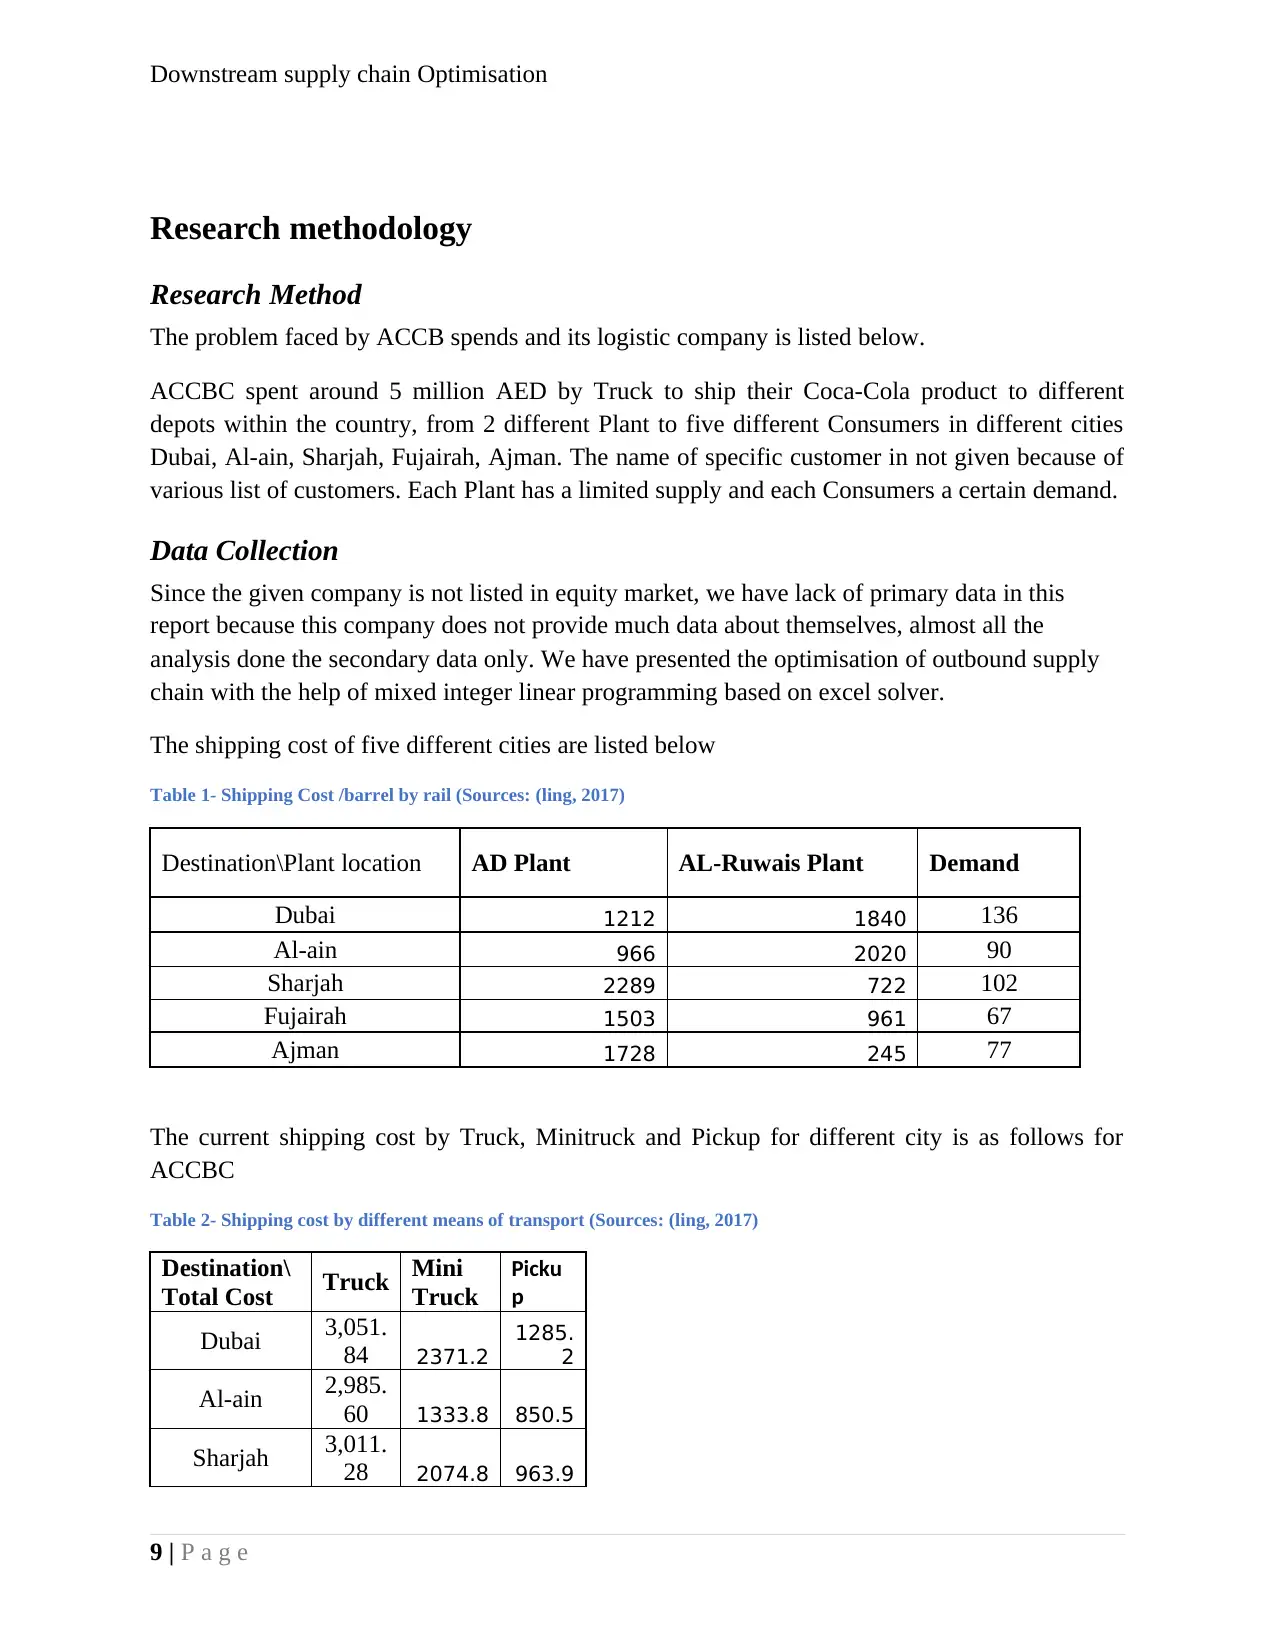
The problem faced by ACCB spends and its logistic company is listed below.
ACCBC spent around 5 million AED by Truck to ship their Coca-Cola product to different
depots within the country, from 2 different Plant to five different Consumers in different cities
Dubai, Al-ain, Sharjah, Fujairah, Ajman. The name of specific customer in not given because of
various list of customers. Each Plant has a limited supply and each Consumers a certain demand.
Data Collection
Since the given company is not listed in equity market, we have lack of primary data in this
report because this company does not provide much data about themselves, almost all the
analysis done the secondary data only. We have presented the optimisation of outbound supply
chain with the help of mixed integer linear programming based on excel solver.
The shipping cost of five different cities are listed below
Table 1- Shipping Cost /barrel by rail (Sources: (ling, 2017)
Destination\Plant location AD Plant AL-Ruwais Plant Demand
Dubai 1212 1840 136
Al-ain 966 2020 90
Sharjah 2289 722 102
Fujairah 1503 961 67
Ajman 1728 245 77
The current shipping cost by Truck, Minitruck and Pickup for different city is as follows for
ACCBC
Table 2- Shipping cost by different means of transport (Sources: (ling, 2017)
Destination\
Total Cost Truck Mini
Truck
Picku
p
Dubai 3,051.
84 2371.2
1285.
2
Al-ain 2,985.
60 1333.8 850.5
Sharjah 3,011.
28 2074.8 963.9
9 | P a g e
Research methodology
Research Method
The problem faced by ACCB spends and its logistic company is listed below.
ACCBC spent around 5 million AED by Truck to ship their Coca-Cola product to different
depots within the country, from 2 different Plant to five different Consumers in different cities
Dubai, Al-ain, Sharjah, Fujairah, Ajman. The name of specific customer in not given because of
various list of customers. Each Plant has a limited supply and each Consumers a certain demand.
Data Collection
Since the given company is not listed in equity market, we have lack of primary data in this
report because this company does not provide much data about themselves, almost all the
analysis done the secondary data only. We have presented the optimisation of outbound supply
chain with the help of mixed integer linear programming based on excel solver.
The shipping cost of five different cities are listed below
Table 1- Shipping Cost /barrel by rail (Sources: (ling, 2017)
Destination\Plant location AD Plant AL-Ruwais Plant Demand
Dubai 1212 1840 136
Al-ain 966 2020 90
Sharjah 2289 722 102
Fujairah 1503 961 67
Ajman 1728 245 77
The current shipping cost by Truck, Minitruck and Pickup for different city is as follows for
ACCBC
Table 2- Shipping cost by different means of transport (Sources: (ling, 2017)
Destination\
Total Cost Truck Mini
Truck
Picku
p
Dubai 3,051.
84 2371.2
1285.
2
Al-ain 2,985.
60 1333.8 850.5
Sharjah 3,011.
28 2074.8 963.9
9 | P a g e
⊘ This is a preview!⊘
Do you want full access?
Subscribe today to unlock all pages.
Trusted by 1+ million students worldwide
Downstream supply chain Optimisation
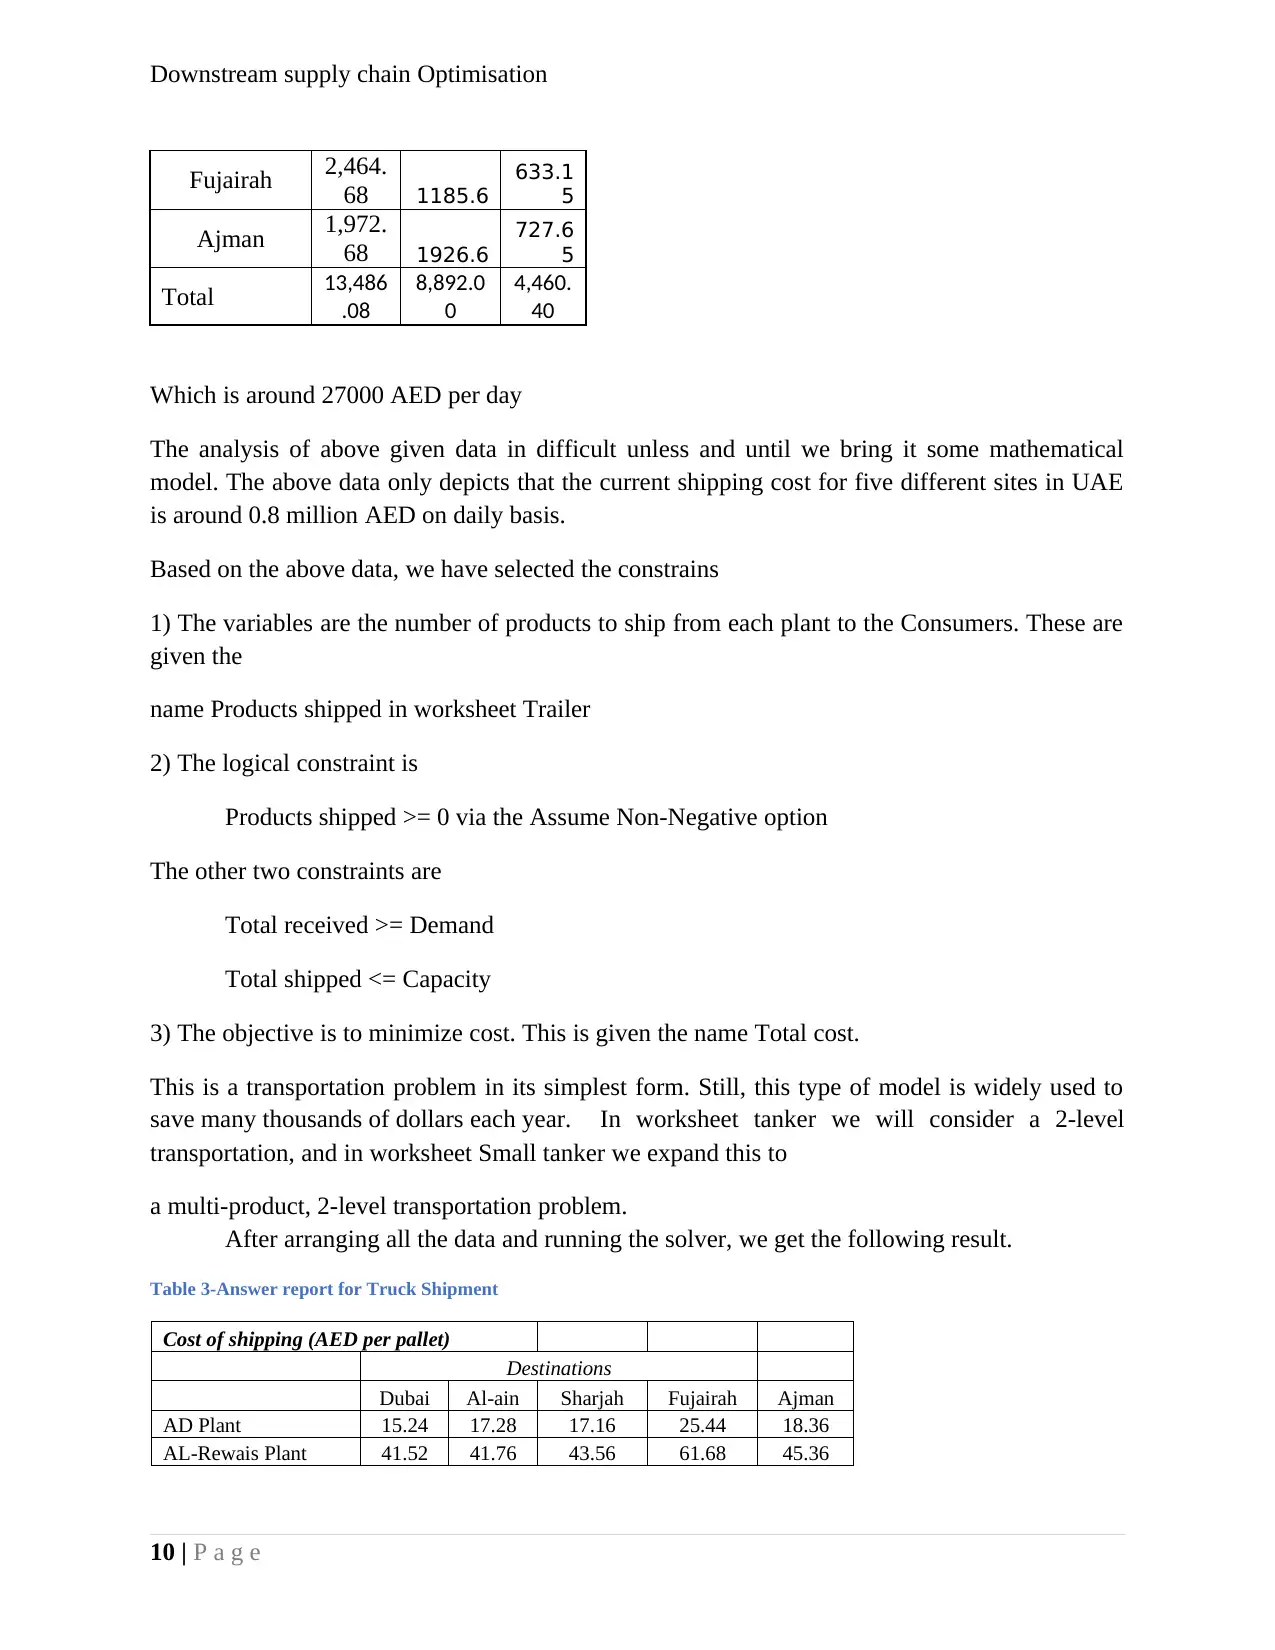
Fujairah 2,464.
68 1185.6
633.1
5
Ajman 1,972.
68 1926.6
727.6
5
Total 13,486
.08
8,892.0
0
4,460.
40
Which is around 27000 AED per day
The analysis of above given data in difficult unless and until we bring it some mathematical
model. The above data only depicts that the current shipping cost for five different sites in UAE
is around 0.8 million AED on daily basis.
Based on the above data, we have selected the constrains
1) The variables are the number of products to ship from each plant to the Consumers. These are
given the
name Products shipped in worksheet Trailer
2) The logical constraint is
Products shipped >= 0 via the Assume Non-Negative option
The other two constraints are
Total received >= Demand
Total shipped <= Capacity
3) The objective is to minimize cost. This is given the name Total cost.
This is a transportation problem in its simplest form. Still, this type of model is widely used to
save many thousands of dollars each year. In worksheet tanker we will consider a 2-level
transportation, and in worksheet Small tanker we expand this to
a multi-product, 2-level transportation problem.
After arranging all the data and running the solver, we get the following result.
Table 3-Answer report for Truck Shipment
Cost of shipping (AED per pallet)
Destinations
Dubai Al-ain Sharjah Fujairah Ajman
AD Plant 15.24 17.28 17.16 25.44 18.36
AL-Rewais Plant 41.52 41.76 43.56 61.68 45.36
10 | P a g e
Paraphrase This Document
Need a fresh take? Get an instant paraphrase of this document with our AI Paraphraser
Downstream supply chain Optimisation
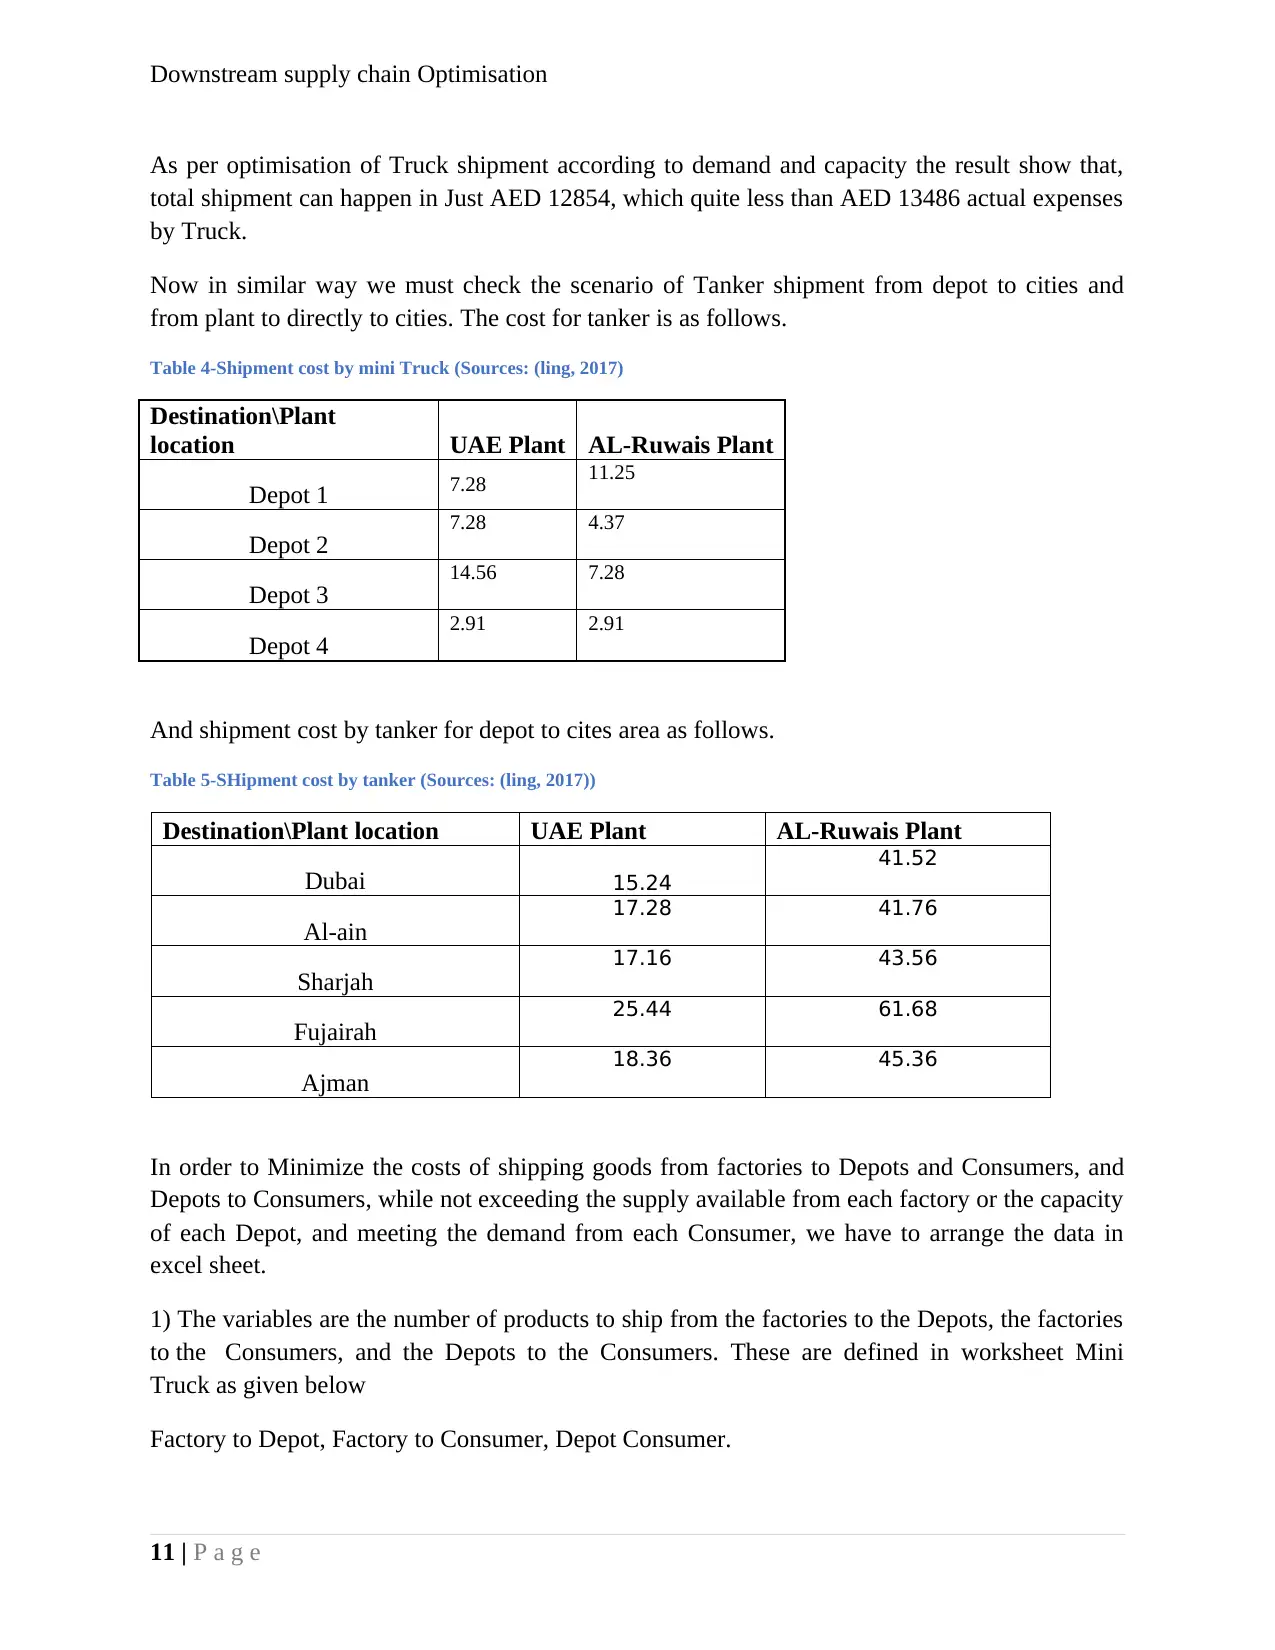
As per optimisation of Truck shipment according to demand and capacity the result show that,
total shipment can happen in Just AED 12854, which quite less than AED 13486 actual expenses
by Truck.
Now in similar way we must check the scenario of Tanker shipment from depot to cities and
from plant to directly to cities. The cost for tanker is as follows.
Table 4-Shipment cost by mini Truck (Sources: (ling, 2017)
Destination\Plant
location UAE Plant AL-Ruwais Plant
Depot 1 7.28 11.25
Depot 2 7.28 4.37
Depot 3 14.56 7.28
Depot 4 2.91 2.91
And shipment cost by tanker for depot to cites area as follows.
Table 5-SHipment cost by tanker (Sources: (ling, 2017))
Destination\Plant location UAE Plant AL-Ruwais Plant
Dubai 15.24
41.52
Al-ain 17.28 41.76
Sharjah 17.16 43.56
Fujairah 25.44 61.68
Ajman 18.36 45.36
In order to Minimize the costs of shipping goods from factories to Depots and Consumers, and
Depots to Consumers, while not exceeding the supply available from each factory or the capacity
of each Depot, and meeting the demand from each Consumer, we have to arrange the data in
excel sheet.
1) The variables are the number of products to ship from the factories to the Depots, the factories
to the Consumers, and the Depots to the Consumers. These are defined in worksheet Mini
Truck as given below
Factory to Depot, Factory to Consumer, Depot Consumer.
11 | P a g e
Downstream supply chain Optimisation
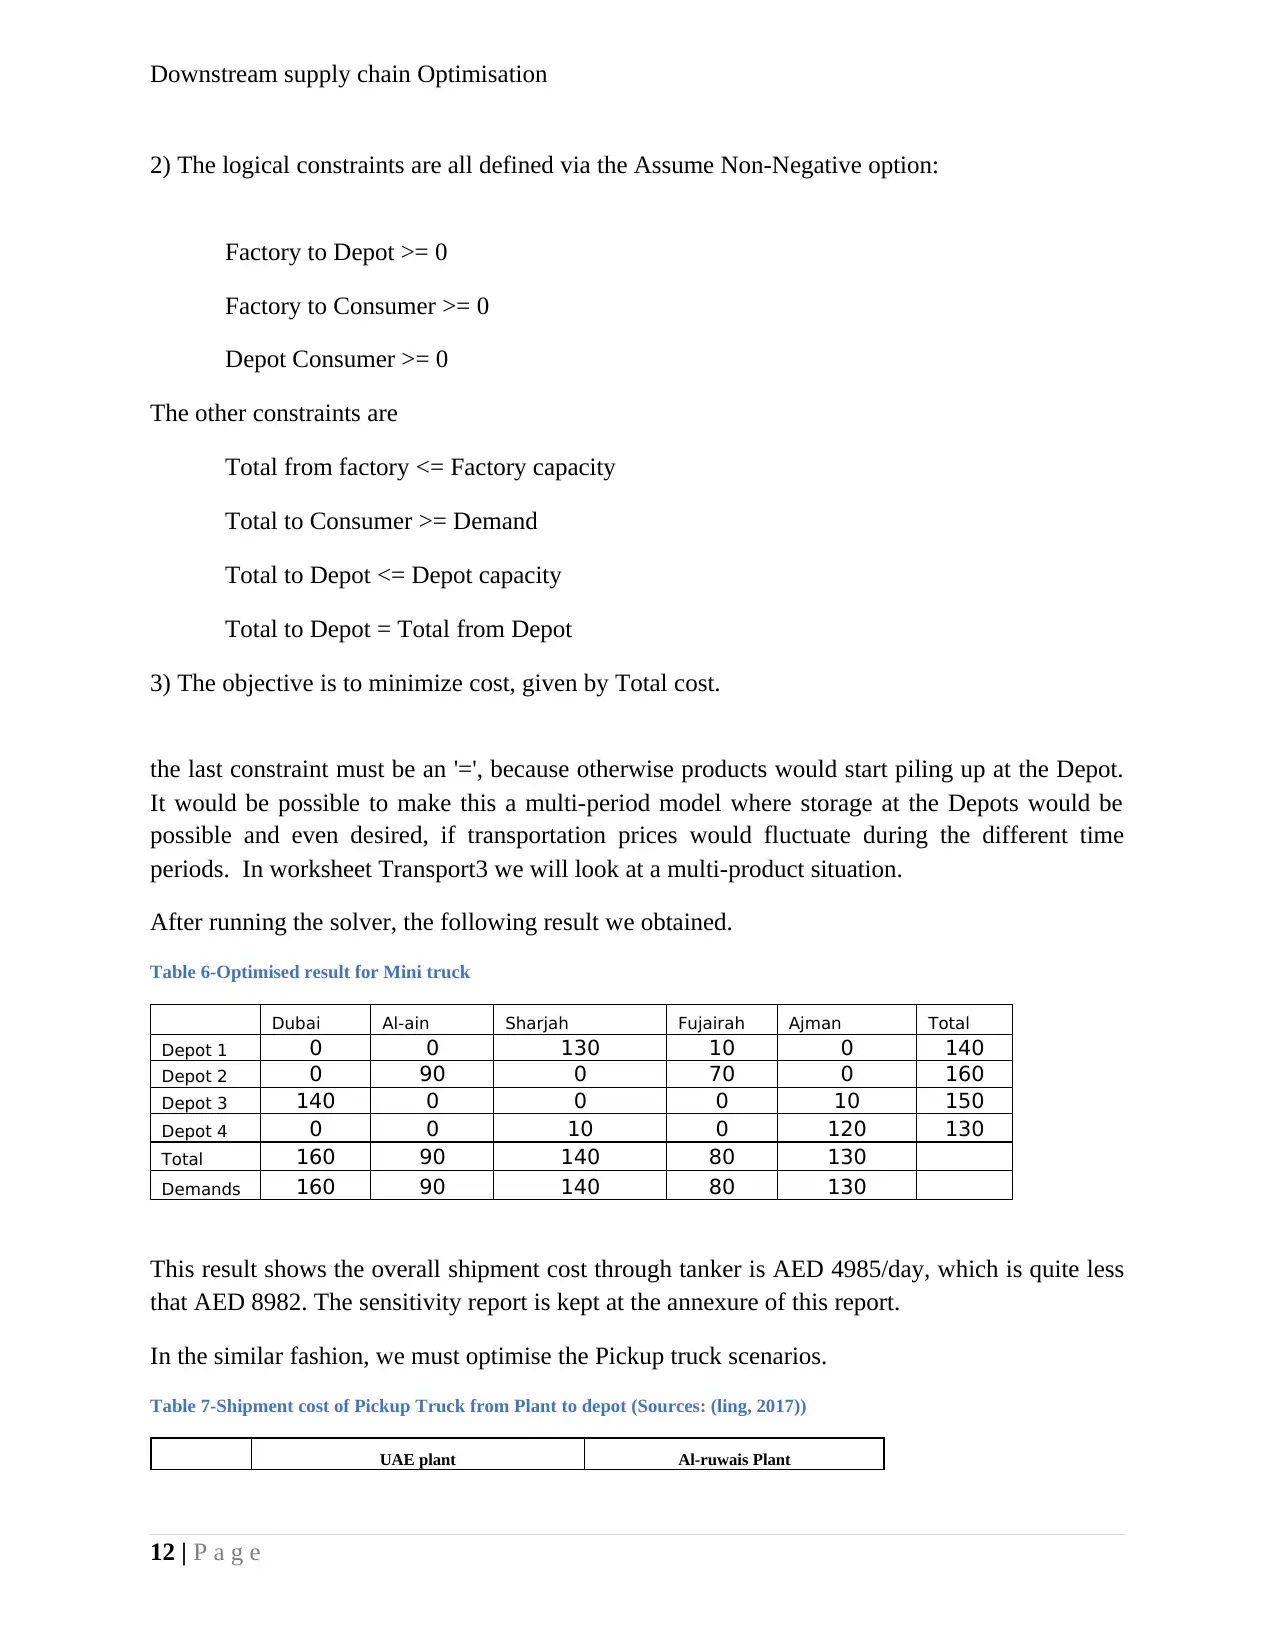
2) The logical constraints are all defined via the Assume Non-Negative option:
Factory to Depot >= 0
Factory to Consumer >= 0
Depot Consumer >= 0
The other constraints are
Total from factory <= Factory capacity
Total to Consumer >= Demand
Total to Depot <= Depot capacity
Total to Depot = Total from Depot
3) The objective is to minimize cost, given by Total cost.
the last constraint must be an '=', because otherwise products would start piling up at the Depot.
It would be possible to make this a multi-period model where storage at the Depots would be
possible and even desired, if transportation prices would fluctuate during the different time
periods. In worksheet Transport3 we will look at a multi-product situation.
After running the solver, the following result we obtained.
Table 6-Optimised result for Mini truck
Dubai Al-ain Sharjah Fujairah Ajman Total
Depot 1 0 0 130 10 0 140
Depot 2 0 90 0 70 0 160
Depot 3 140 0 0 0 10 150
Depot 4 0 0 10 0 120 130
Total 160 90 140 80 130
Demands 160 90 140 80 130
This result shows the overall shipment cost through tanker is AED 4985/day, which is quite less
that AED 8982. The sensitivity report is kept at the annexure of this report.
In the similar fashion, we must optimise the Pickup truck scenarios.
Table 7-Shipment cost of Pickup Truck from Plant to depot (Sources: (ling, 2017))
UAE plant Al-ruwais Plant
12 | P a g e
⊘ This is a preview!⊘
Do you want full access?
Subscribe today to unlock all pages.
Trusted by 1+ million students worldwide
1 out of 41
Related Documents


Your All-in-One AI-Powered Toolkit for Academic Success.
+13062052269
info@desklib.com
Available 24*7 on WhatsApp / Email
![[object Object]](/_next/static/media/star-bottom.7253800d.svg)
Unlock your academic potential
Copyright © 2020–2026 A2Z Services. All Rights Reserved. Developed and managed by ZUCOL.