Linear Regression Report
VerifiedAdded on 2023/04/21
|8
|1876
|378
AI Summary
This report evaluates the relationship between graduation and retention rate using linear regression analysis. Findings suggest a positive correlation between the two variables. The study uses a data sample of 29 colleges from the Online University Database. Descriptive statistics and a scatter plot are used to analyze the data. The regression equation y=0.2845x+25.423 is estimated to best describe the relationship. Recommendations include evaluating the quality of online education and improving service delivery in institutions with low retention and graduation rates.
Contribute Materials
Your contribution can guide someone’s learning journey. Share your
documents today.
Economics and Quantitative Analysis
1
ECONOMICS AND QUANTITAIVE ANALYSIS
by Students Name
Course
Professor
University
City
Date
1
ECONOMICS AND QUANTITAIVE ANALYSIS
by Students Name
Course
Professor
University
City
Date
Secure Best Marks with AI Grader
Need help grading? Try our AI Grader for instant feedback on your assignments.
Economics and Quantitative Analysis
2
Linear Regression Report
Purpose
The main aim of this report was to evaluate the relationship between the graduation
and the retention rate. This was be achieved by conducting a linear regression analysis.
Background
Online education is one of the technologies that is hastily sweeping across the
Australian education sector. Unlike in the past education system, currently individuals are
able to take university programmes at the comfort of their homes (Rubin 2012). No more
need to go to classrooms thanks to the quickly spreading internet coverage in the continent.
Due to the demand for education schedules that are flexible and time saving more and more
colleges are availing the online study programmes in their curriculum (Dunlap & Lowenthal
2010). Despite the advantage of making education more accessible the online studies have
made it hard for students to have a merit of evaluating the best school to attend. To assist
with this dilemma economists have come up with two rates that is the retention rate (RR0 and
the graduation rate (GR) (Callahan & Belcheir 2017).
RR is the percentage of first year students who enrol back in the same institution to
continue with their studies for the second year (University of Arkansas 2014). Meanwhile
graduation rate is the proportion o students in a college who join in first year and goes ahead
to graduate in at least 150% of the time needed to complete a programme.
Method
The study uses a data sample of 29 colleges from the Online University Database
which were selected at random. So as to conduct the regression analysis we modelled the
simple linear regression, in addition a scatter plot was drawn and a linear equation estimated
(Berg, 2009). This were analysed so as to arrive at the relevant conclusions. Analysis was
conducted using the Microsoft Excel software
Results
a. Descriptive statistics is a quantitative breakdown of the sample data to reflect
measures. In the table below we have a summary of measures of central tendency,
measures pf dispersion among others.
Economics and Quantitative Analysis
3
RR(%) GR(%)
Mean 57.4137931 Mean 41.75862069
Standard Error 4.315602704 Standard Error 1.832018976
Median 60 Median 39
Mode 51 Mode 36
Standard Deviation 23.24023181 Standard Deviation 9.865724115
Sample Variance 540.1083744 Sample Variance 97.33251232
Kurtosis 0.461757455 Kurtosis -0.882399313
Skewness -0.309920645 Skewness 0.176364432
Range 96 Range 36
Minimum 4 Minimum 25
Maximum 100 Maximum 61
Sum 1665 Sum 1211
Count 29 Count 29
Largest(1) 100 Largest(1) 61
Smallest(1) 4 Smallest(1) 25
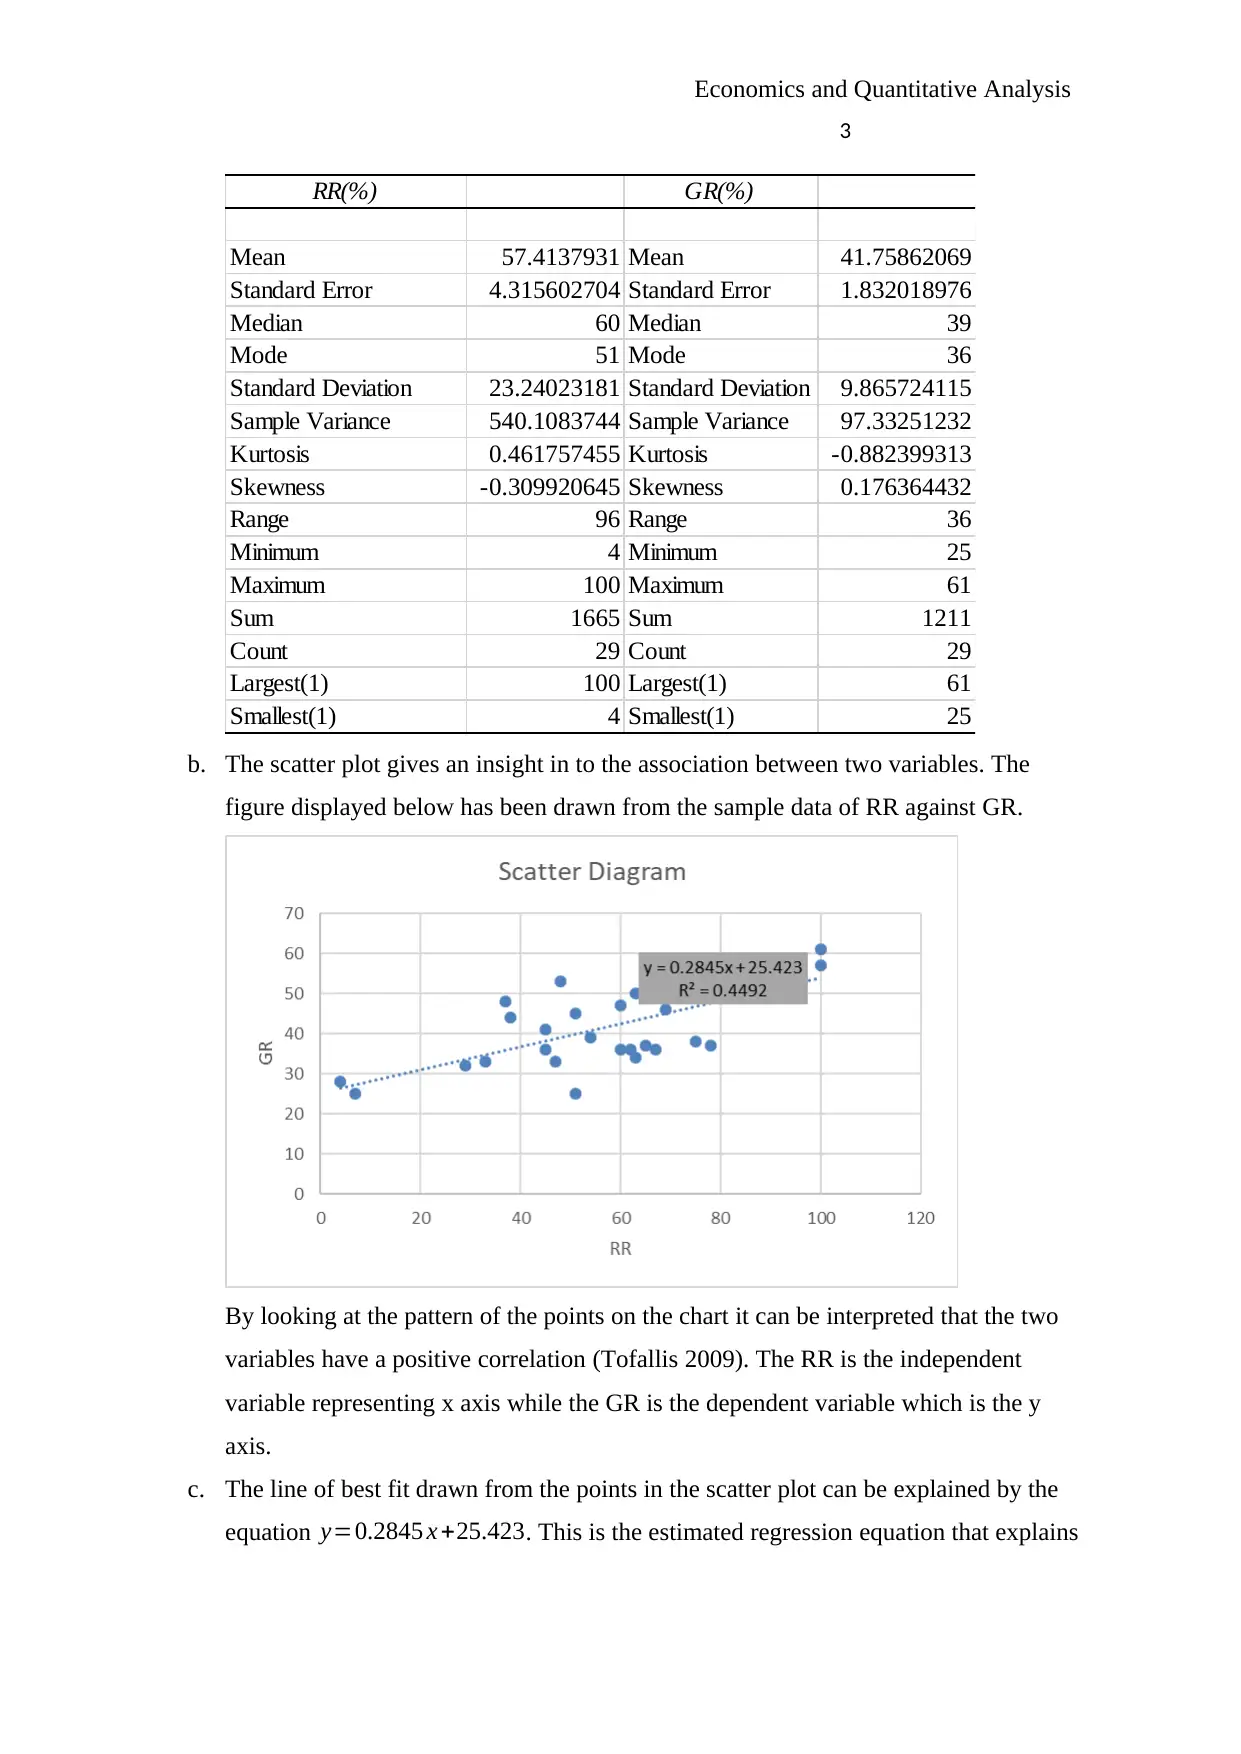
b. The scatter plot gives an insight in to the association between two variables. The
figure displayed below has been drawn from the sample data of RR against GR.
By looking at the pattern of the points on the chart it can be interpreted that the two
variables have a positive correlation (Tofallis 2009). The RR is the independent
variable representing x axis while the GR is the dependent variable which is the y
axis.
c. The line of best fit drawn from the points in the scatter plot can be explained by the
equation y=0.2845 x +25.423. This is the estimated regression equation that explains
3
RR(%) GR(%)
Mean 57.4137931 Mean 41.75862069
Standard Error 4.315602704 Standard Error 1.832018976
Median 60 Median 39
Mode 51 Mode 36
Standard Deviation 23.24023181 Standard Deviation 9.865724115
Sample Variance 540.1083744 Sample Variance 97.33251232
Kurtosis 0.461757455 Kurtosis -0.882399313
Skewness -0.309920645 Skewness 0.176364432
Range 96 Range 36
Minimum 4 Minimum 25
Maximum 100 Maximum 61
Sum 1665 Sum 1211
Count 29 Count 29
Largest(1) 100 Largest(1) 61
Smallest(1) 4 Smallest(1) 25
b. The scatter plot gives an insight in to the association between two variables. The
figure displayed below has been drawn from the sample data of RR against GR.
By looking at the pattern of the points on the chart it can be interpreted that the two
variables have a positive correlation (Tofallis 2009). The RR is the independent
variable representing x axis while the GR is the dependent variable which is the y
axis.
c. The line of best fit drawn from the points in the scatter plot can be explained by the
equation y=0.2845 x +25.423. This is the estimated regression equation that explains
Economics and Quantitative Analysis
4
the relationship between the retention and the graduation rates (Emerson, et al. 2013).
The linear equation is useful in forecasting institution’s graduation rates using the RR.
d. The equation y=0.2845 x +25.423 is the regression equation that best fits the sample
data. The equation has a gradient of 0.2845. First a positive gradient is an indication
of positive correlation between variables. In this case an increase in the RR by 1%
will lead to an increase in the GR by 0.2845%.
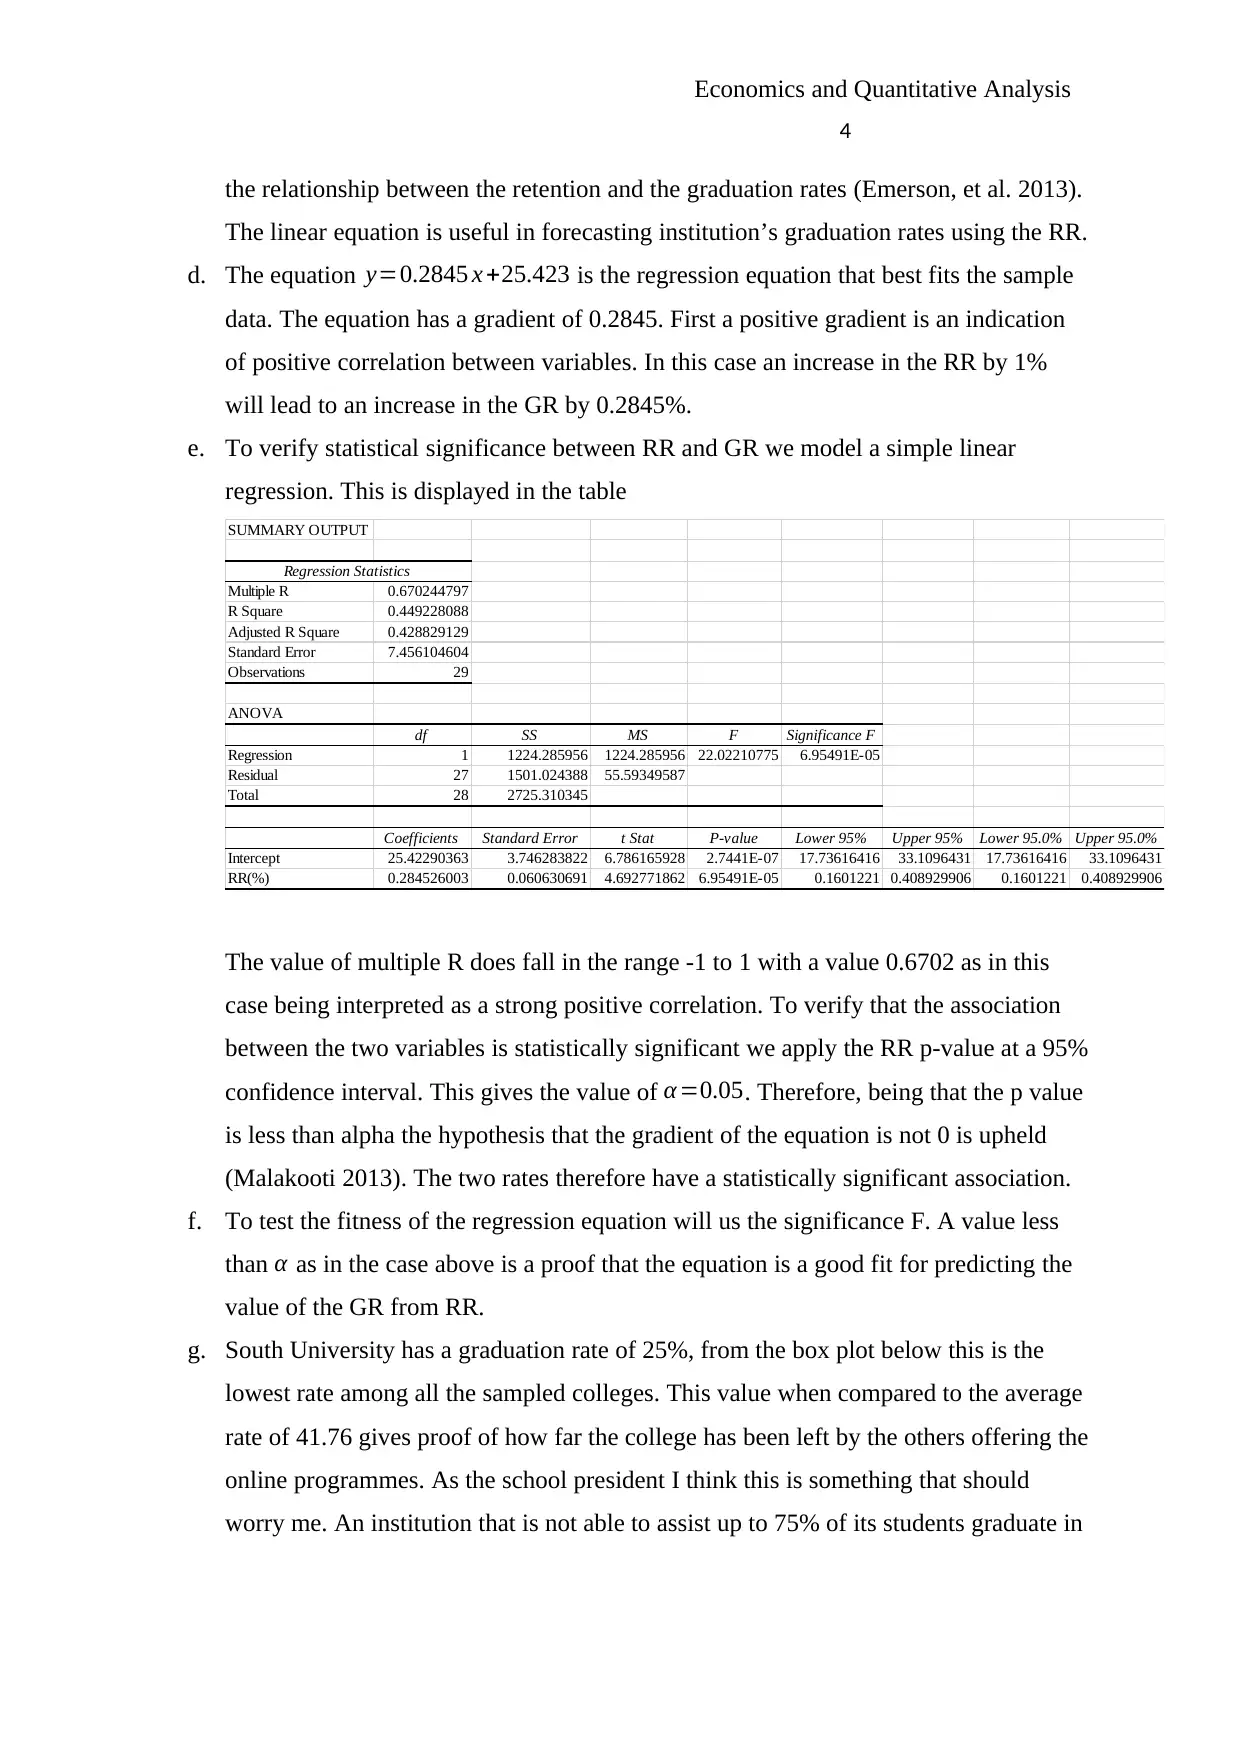
e. To verify statistical significance between RR and GR we model a simple linear
regression. This is displayed in the table
SUMMARY OUTPUT
Regression Statistics
Multiple R 0.670244797
R Square 0.449228088
Adjusted R Square 0.428829129
Standard Error 7.456104604
Observations 29
ANOVA
df SS MS F Significance F
Regression 1 1224.285956 1224.285956 22.02210775 6.95491E-05
Residual 27 1501.024388 55.59349587
Total 28 2725.310345
Coefficients Standard Error t Stat P-value Lower 95% Upper 95% Lower 95.0% Upper 95.0%
Intercept 25.42290363 3.746283822 6.786165928 2.7441E-07 17.73616416 33.1096431 17.73616416 33.1096431
RR(%) 0.284526003 0.060630691 4.692771862 6.95491E-05 0.1601221 0.408929906 0.1601221 0.408929906
The value of multiple R does fall in the range -1 to 1 with a value 0.6702 as in this
case being interpreted as a strong positive correlation. To verify that the association
between the two variables is statistically significant we apply the RR p-value at a 95%
confidence interval. This gives the value of α=0.05. Therefore, being that the p value
is less than alpha the hypothesis that the gradient of the equation is not 0 is upheld
(Malakooti 2013). The two rates therefore have a statistically significant association.
f. To test the fitness of the regression equation will us the significance F. A value less
than α as in the case above is a proof that the equation is a good fit for predicting the
value of the GR from RR.
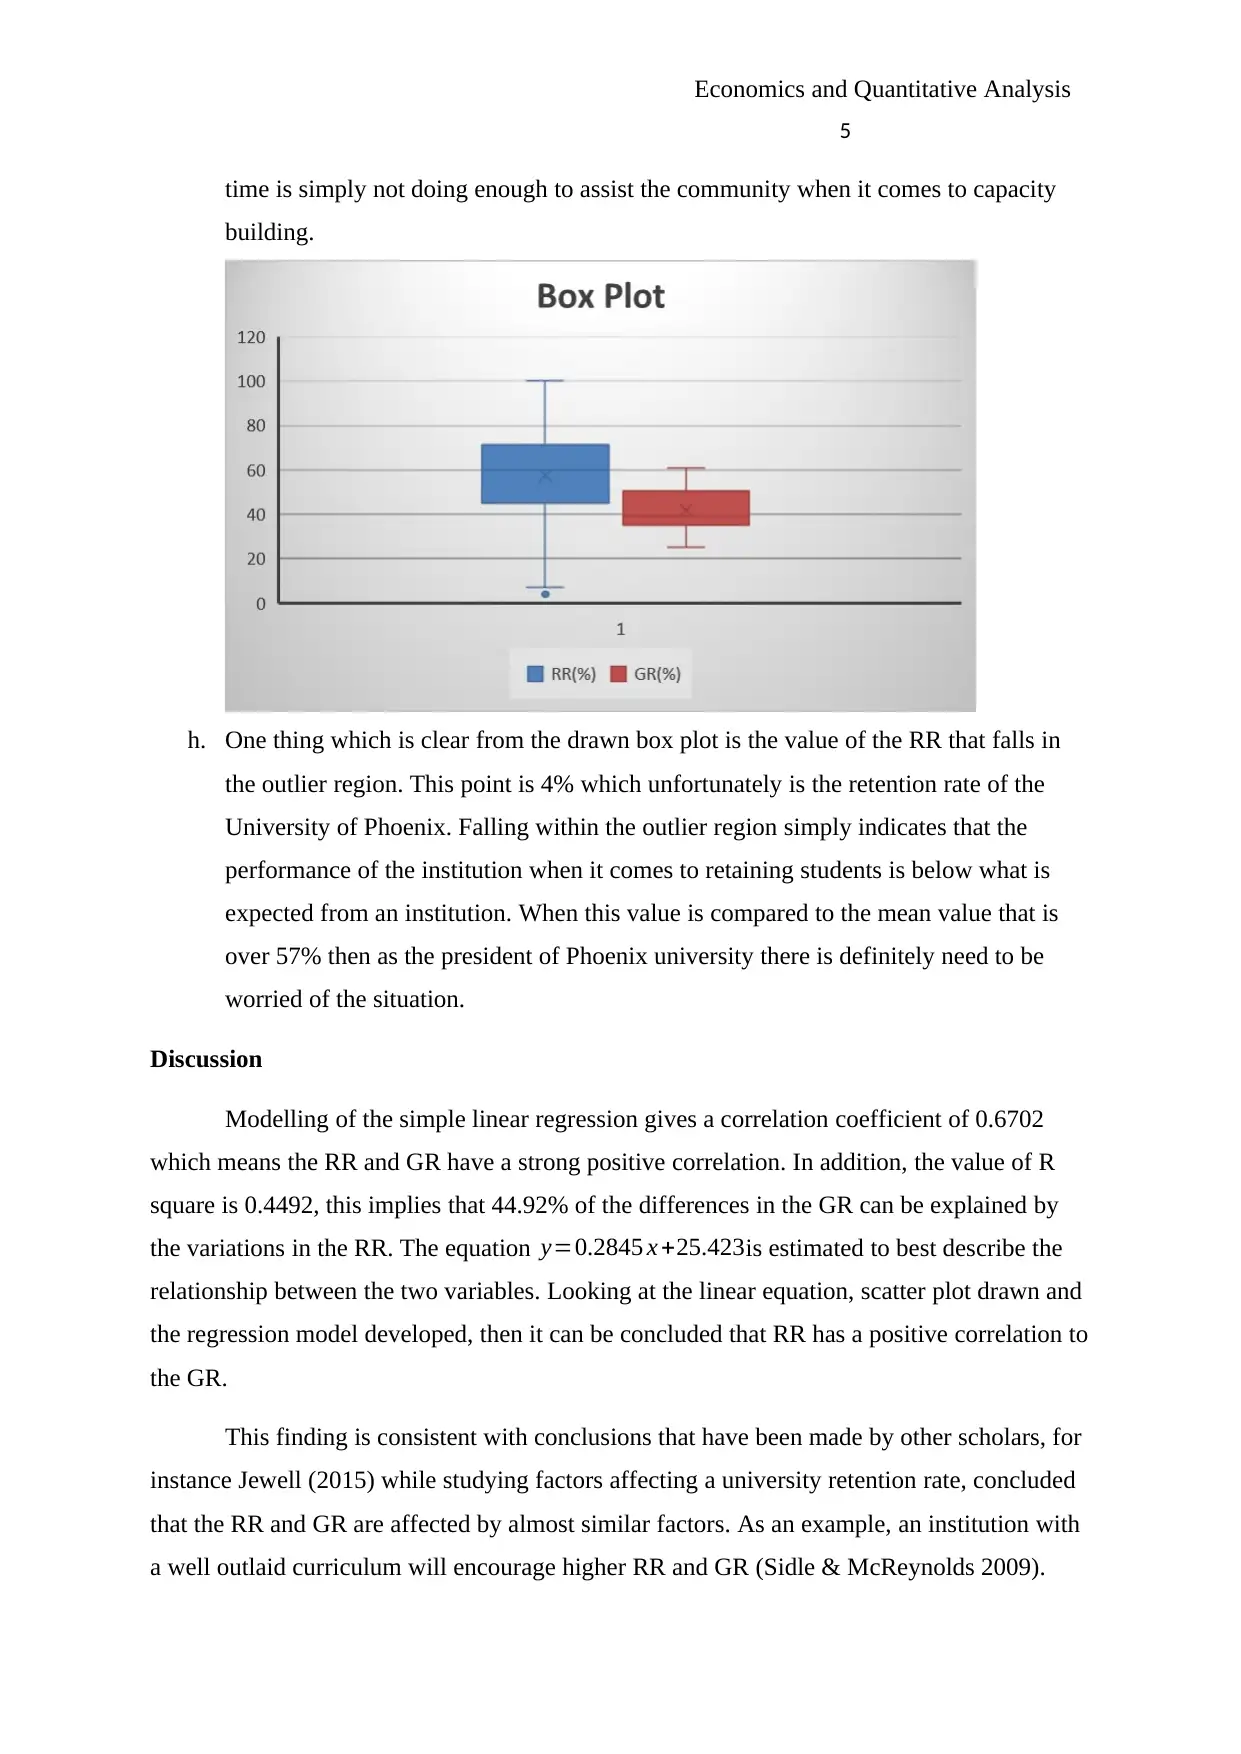
g. South University has a graduation rate of 25%, from the box plot below this is the
lowest rate among all the sampled colleges. This value when compared to the average
rate of 41.76 gives proof of how far the college has been left by the others offering the
online programmes. As the school president I think this is something that should
worry me. An institution that is not able to assist up to 75% of its students graduate in
4
the relationship between the retention and the graduation rates (Emerson, et al. 2013).
The linear equation is useful in forecasting institution’s graduation rates using the RR.
d. The equation y=0.2845 x +25.423 is the regression equation that best fits the sample
data. The equation has a gradient of 0.2845. First a positive gradient is an indication
of positive correlation between variables. In this case an increase in the RR by 1%
will lead to an increase in the GR by 0.2845%.
e. To verify statistical significance between RR and GR we model a simple linear
regression. This is displayed in the table
SUMMARY OUTPUT
Regression Statistics
Multiple R 0.670244797
R Square 0.449228088
Adjusted R Square 0.428829129
Standard Error 7.456104604
Observations 29
ANOVA
df SS MS F Significance F
Regression 1 1224.285956 1224.285956 22.02210775 6.95491E-05
Residual 27 1501.024388 55.59349587
Total 28 2725.310345
Coefficients Standard Error t Stat P-value Lower 95% Upper 95% Lower 95.0% Upper 95.0%
Intercept 25.42290363 3.746283822 6.786165928 2.7441E-07 17.73616416 33.1096431 17.73616416 33.1096431
RR(%) 0.284526003 0.060630691 4.692771862 6.95491E-05 0.1601221 0.408929906 0.1601221 0.408929906
The value of multiple R does fall in the range -1 to 1 with a value 0.6702 as in this
case being interpreted as a strong positive correlation. To verify that the association
between the two variables is statistically significant we apply the RR p-value at a 95%
confidence interval. This gives the value of α=0.05. Therefore, being that the p value
is less than alpha the hypothesis that the gradient of the equation is not 0 is upheld
(Malakooti 2013). The two rates therefore have a statistically significant association.
f. To test the fitness of the regression equation will us the significance F. A value less
than α as in the case above is a proof that the equation is a good fit for predicting the
value of the GR from RR.
g. South University has a graduation rate of 25%, from the box plot below this is the
lowest rate among all the sampled colleges. This value when compared to the average
rate of 41.76 gives proof of how far the college has been left by the others offering the
online programmes. As the school president I think this is something that should
worry me. An institution that is not able to assist up to 75% of its students graduate in
Secure Best Marks with AI Grader
Need help grading? Try our AI Grader for instant feedback on your assignments.
Economics and Quantitative Analysis
5
time is simply not doing enough to assist the community when it comes to capacity
building.
h. One thing which is clear from the drawn box plot is the value of the RR that falls in
the outlier region. This point is 4% which unfortunately is the retention rate of the
University of Phoenix. Falling within the outlier region simply indicates that the
performance of the institution when it comes to retaining students is below what is
expected from an institution. When this value is compared to the mean value that is
over 57% then as the president of Phoenix university there is definitely need to be
worried of the situation.
Discussion
Modelling of the simple linear regression gives a correlation coefficient of 0.6702
which means the RR and GR have a strong positive correlation. In addition, the value of R
square is 0.4492, this implies that 44.92% of the differences in the GR can be explained by
the variations in the RR. The equation y=0.2845 x +25.423is estimated to best describe the
relationship between the two variables. Looking at the linear equation, scatter plot drawn and
the regression model developed, then it can be concluded that RR has a positive correlation to
the GR.
This finding is consistent with conclusions that have been made by other scholars, for
instance Jewell (2015) while studying factors affecting a university retention rate, concluded
that the RR and GR are affected by almost similar factors. As an example, an institution with
a well outlaid curriculum will encourage higher RR and GR (Sidle & McReynolds 2009).
Economics and Quantitative Analysis
6
Moreover, as students retain a college, they increase their chances of graduating from the
same institution in the recommended time.
The use of secondary data is one of the strengths of the study. Secondary data is data
that has been collected, scrutinised and published hence can be treated as authentic source of
information. Despite this, the reasrch is limited by the overreliance on the RR and GR to
gauge quality of eduction offered by a college. Students retention and graduation rate s
occasionally affected by factors which are externally trigered and may have nothing to do
with the quality of education in an institution.
Recommendations
Having looked at the relationship between the RR and GR I recommend the following actions
to be put in place.
The Ministry concerned with education in Australia should evaluate the quality of
education offered online to ensure the colleges are operating within the set standards.
The institutions with lower retention rates need to improve service delivery so as to
meet the expectation of those enrolling in the colleges.
The institutions with low graduation rates need to evaluate their curriculum and
policies to identify any limitations that might lead to the failure of their students to
graduate in time.
Economics and Quantitative Analysis
7
References
Berg, B 2009, Qualitative Research Methods for the Social Sciences. Seventh ed. Boston:
Pearson Education Inc.
Callahan, J & Belcheir, M 2017, Testing Our Assumptions. Journal of College Student
Retention: Research, Theory & Practice, Vol. 19, pp. 161–175.
Dunlap, J & Lowenthal, P 2010, Defeating the Kobayashi Maru: Supporting Student
Retention by Balancing the Needs of the Many and the One. Educause Quarterly, vol. 33, no.
4, pp. 33.
Emerson, J, Green, W, Schoerke, B & Crowley, J 2013, The Generalized Pairs Plot. Journal
of Computational and Graphical Statistics, vol. 22, no. 1, pp. 79–91.
Jewell, S 2015, Retention and Graduation Rates at Public Research Universities: Do
Medical Centers Affect Rates?. [Online]
Available at: http://martin.uky.edu/sites/martin.uky.edu/files/Capstone_Projects/
Capstones_2015/Jewell.pdf
[Accessed 29 January 2018].
Malakooti, B 2013, Operations and Production Systems with Multiple Objectives, John Wiley
& Sons.
Rubin, M 2012, Social class differences in social integration among students in higher
education: A meta-analysis and recommendations for future research. Journal of Diversity in
Higher Education, Vol. 5, pp. 22–38.
Sidle, M. & McReynolds, J 2009, The freshman year experience: Student retention
andstudent success. NASPA Journal, vol. 46, no. 3, pp. 434-446.
Tofallis, C 2009, Least Squares Percentage Regression. Journal of Modern Applied
Statistical Methods, Vol. 7 , pp. 526–534.
University of Arkansas 2014, Increasing Graduation Rates, University of Arkansas Quality
Initiative Proposal. [Online]
Available at: https://provost.uark.edu/accreditation.php
[Accessed 30 January 2018].
Paraphrase This Document
Need a fresh take? Get an instant paraphrase of this document with our AI Paraphraser
Economics and Quantitative Analysis
8
8
1 out of 8
Related Documents


Your All-in-One AI-Powered Toolkit for Academic Success.
+13062052269
info@desklib.com
Available 24*7 on WhatsApp / Email
![[object Object]](/_next/static/media/star-bottom.7253800d.svg)
Unlock your academic potential
© 2024 | Zucol Services PVT LTD | All rights reserved.