Data Science Report: Comprehensive Dataset Summary and Analysis
VerifiedAdded on 2022/11/29
|11
|1699
|1
Report
AI Summary
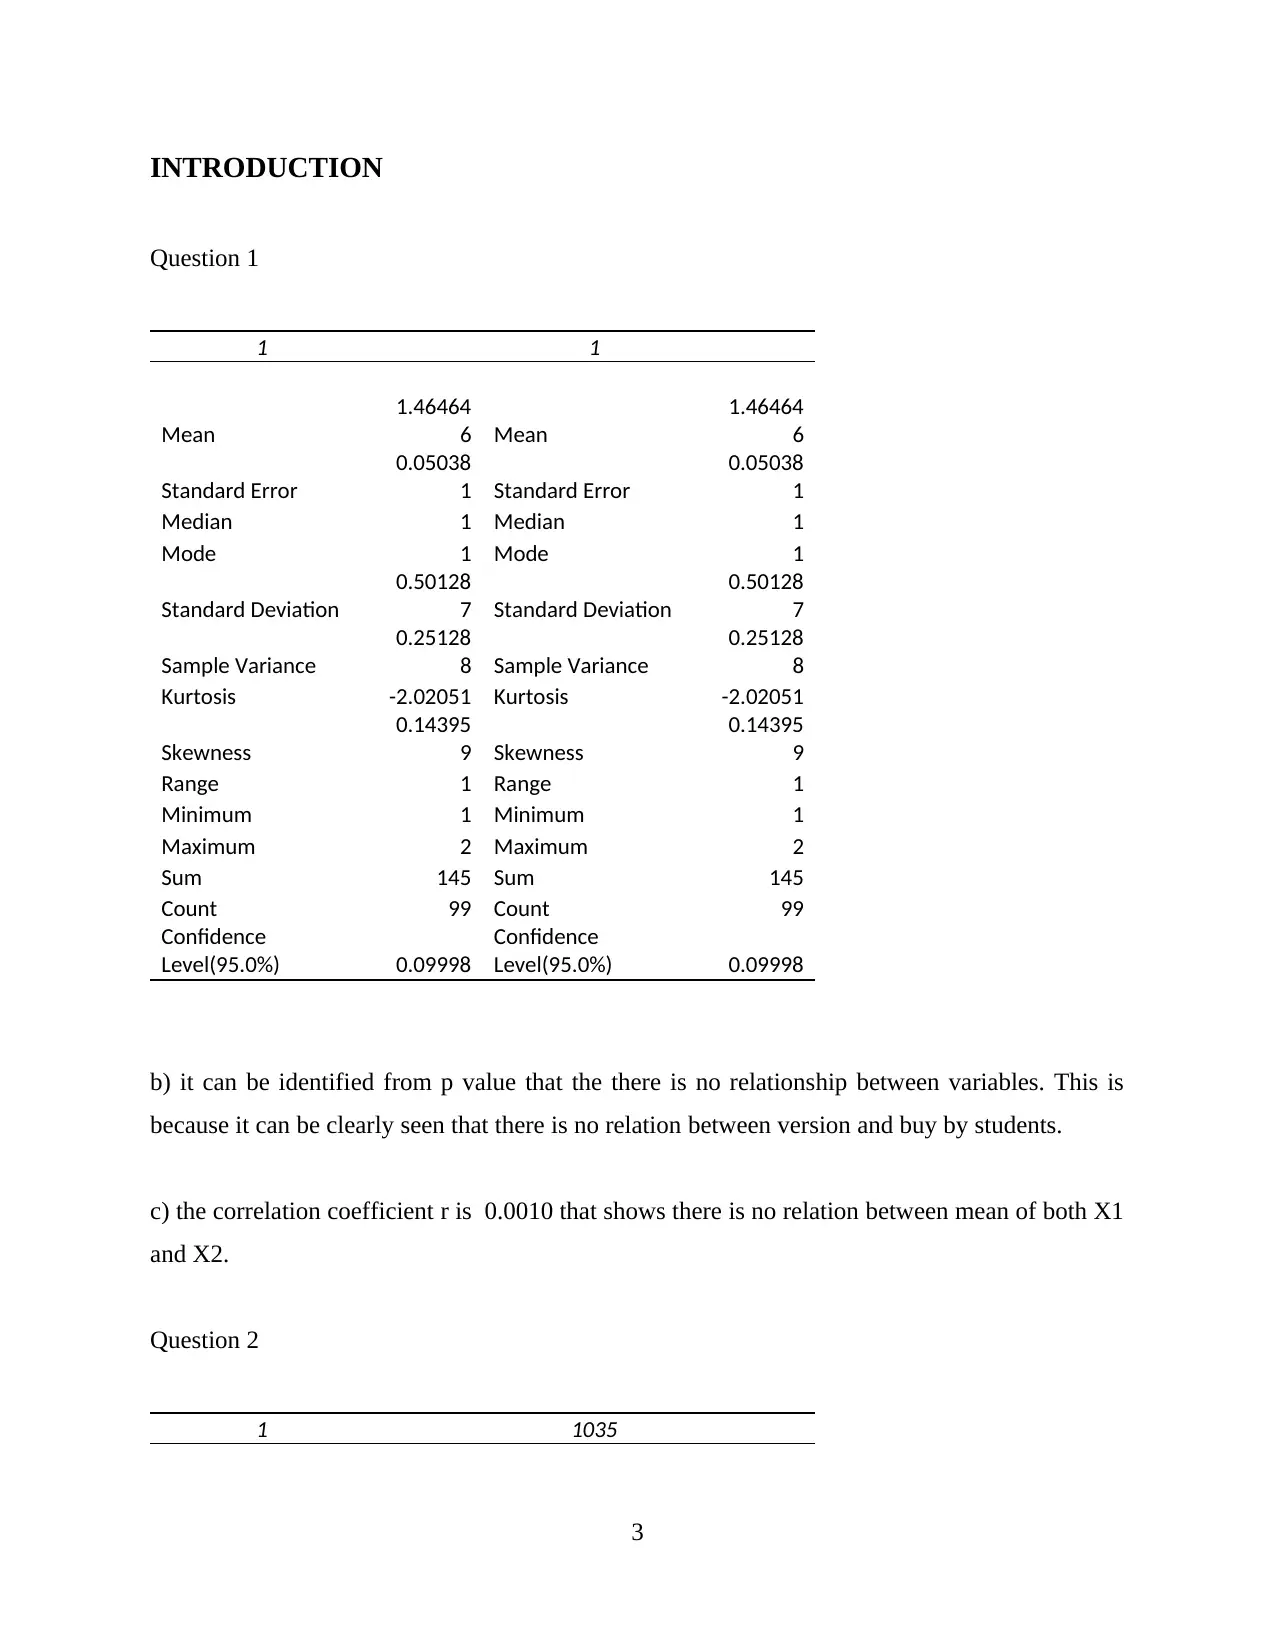
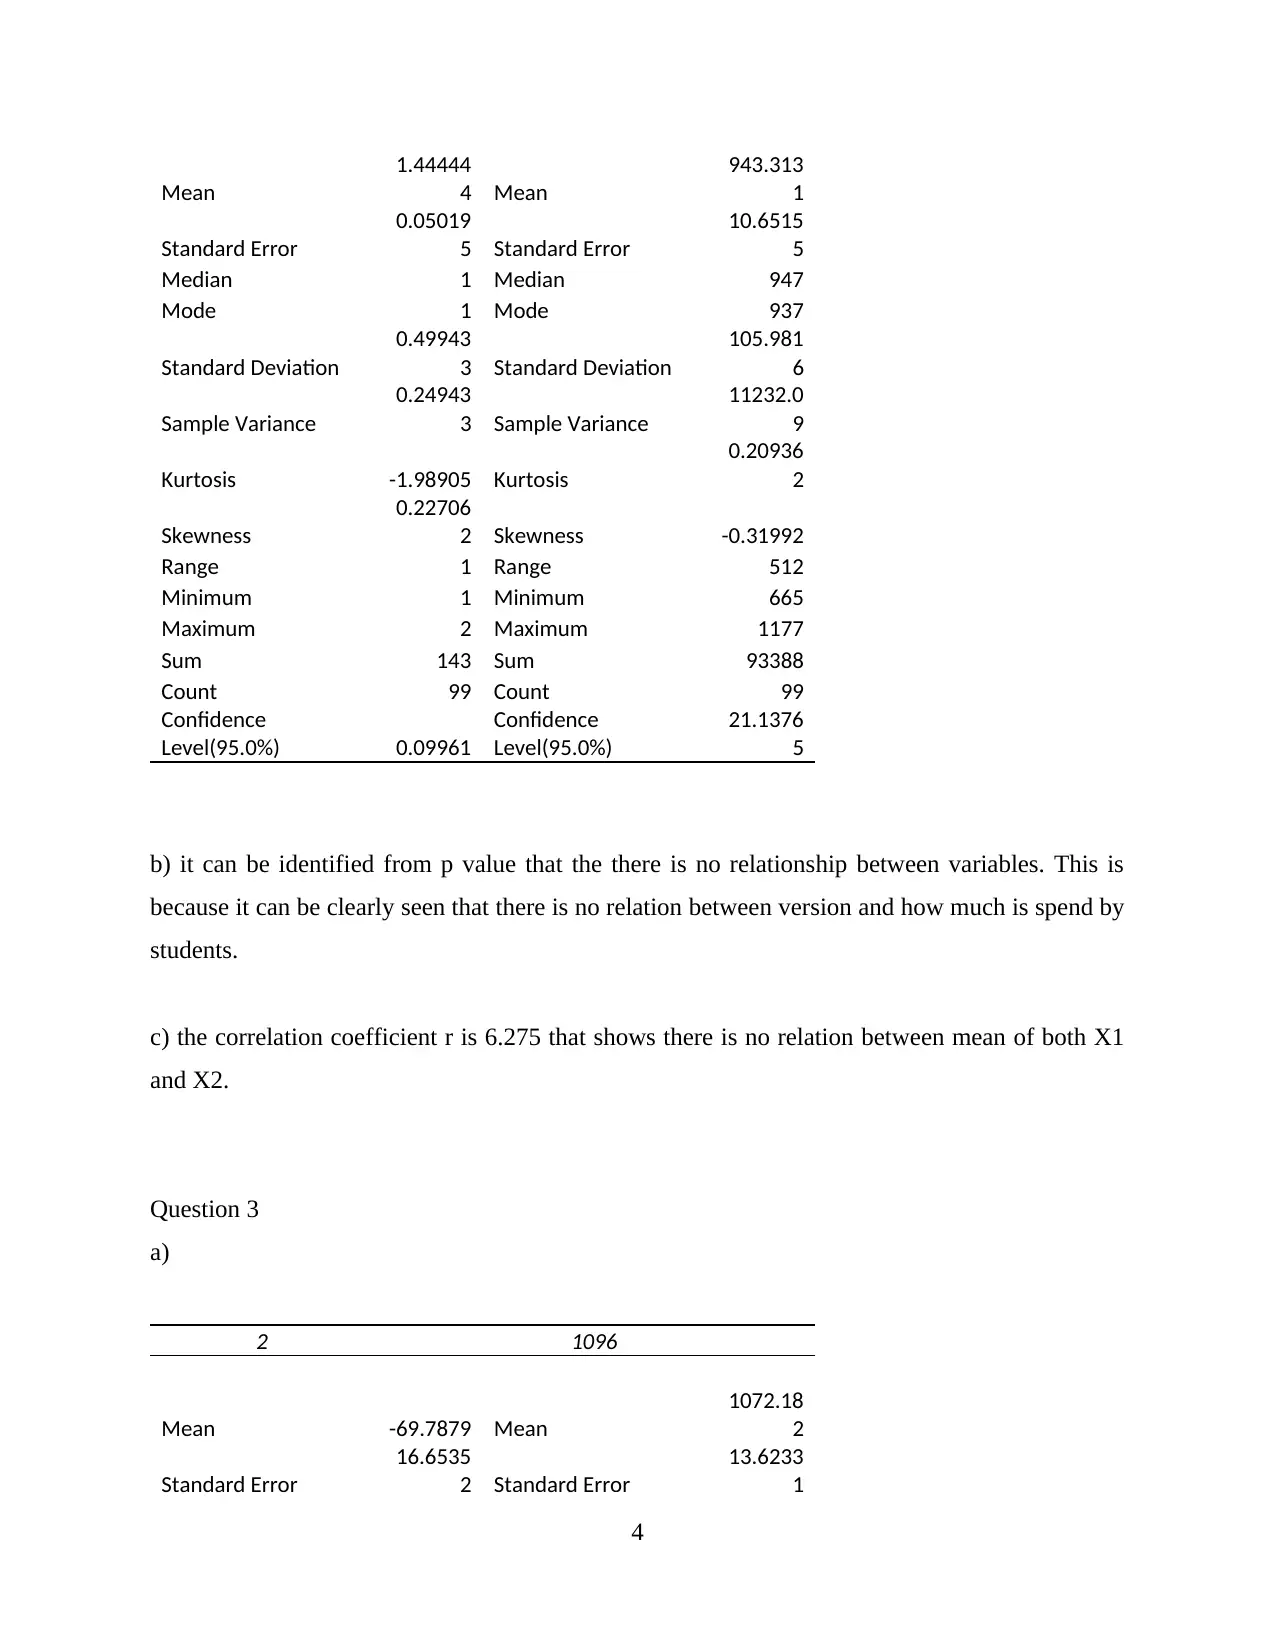
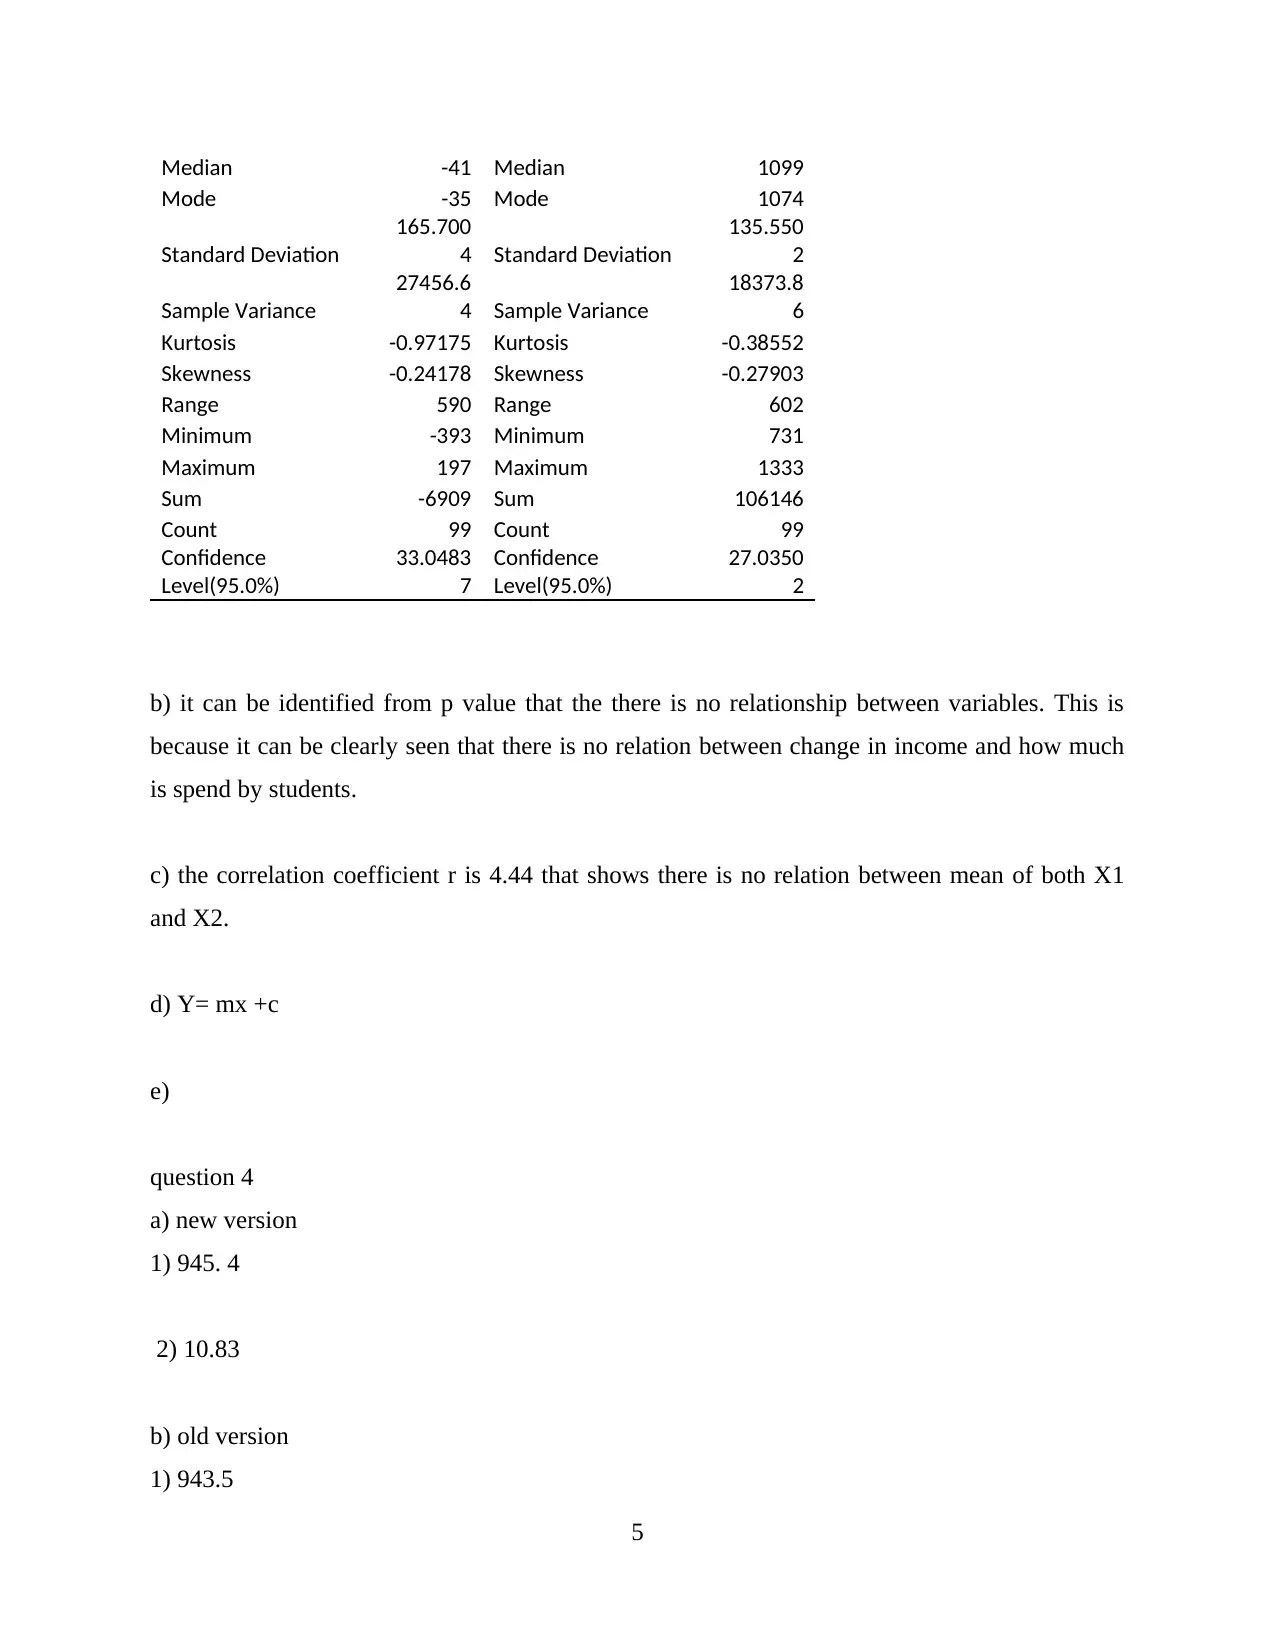
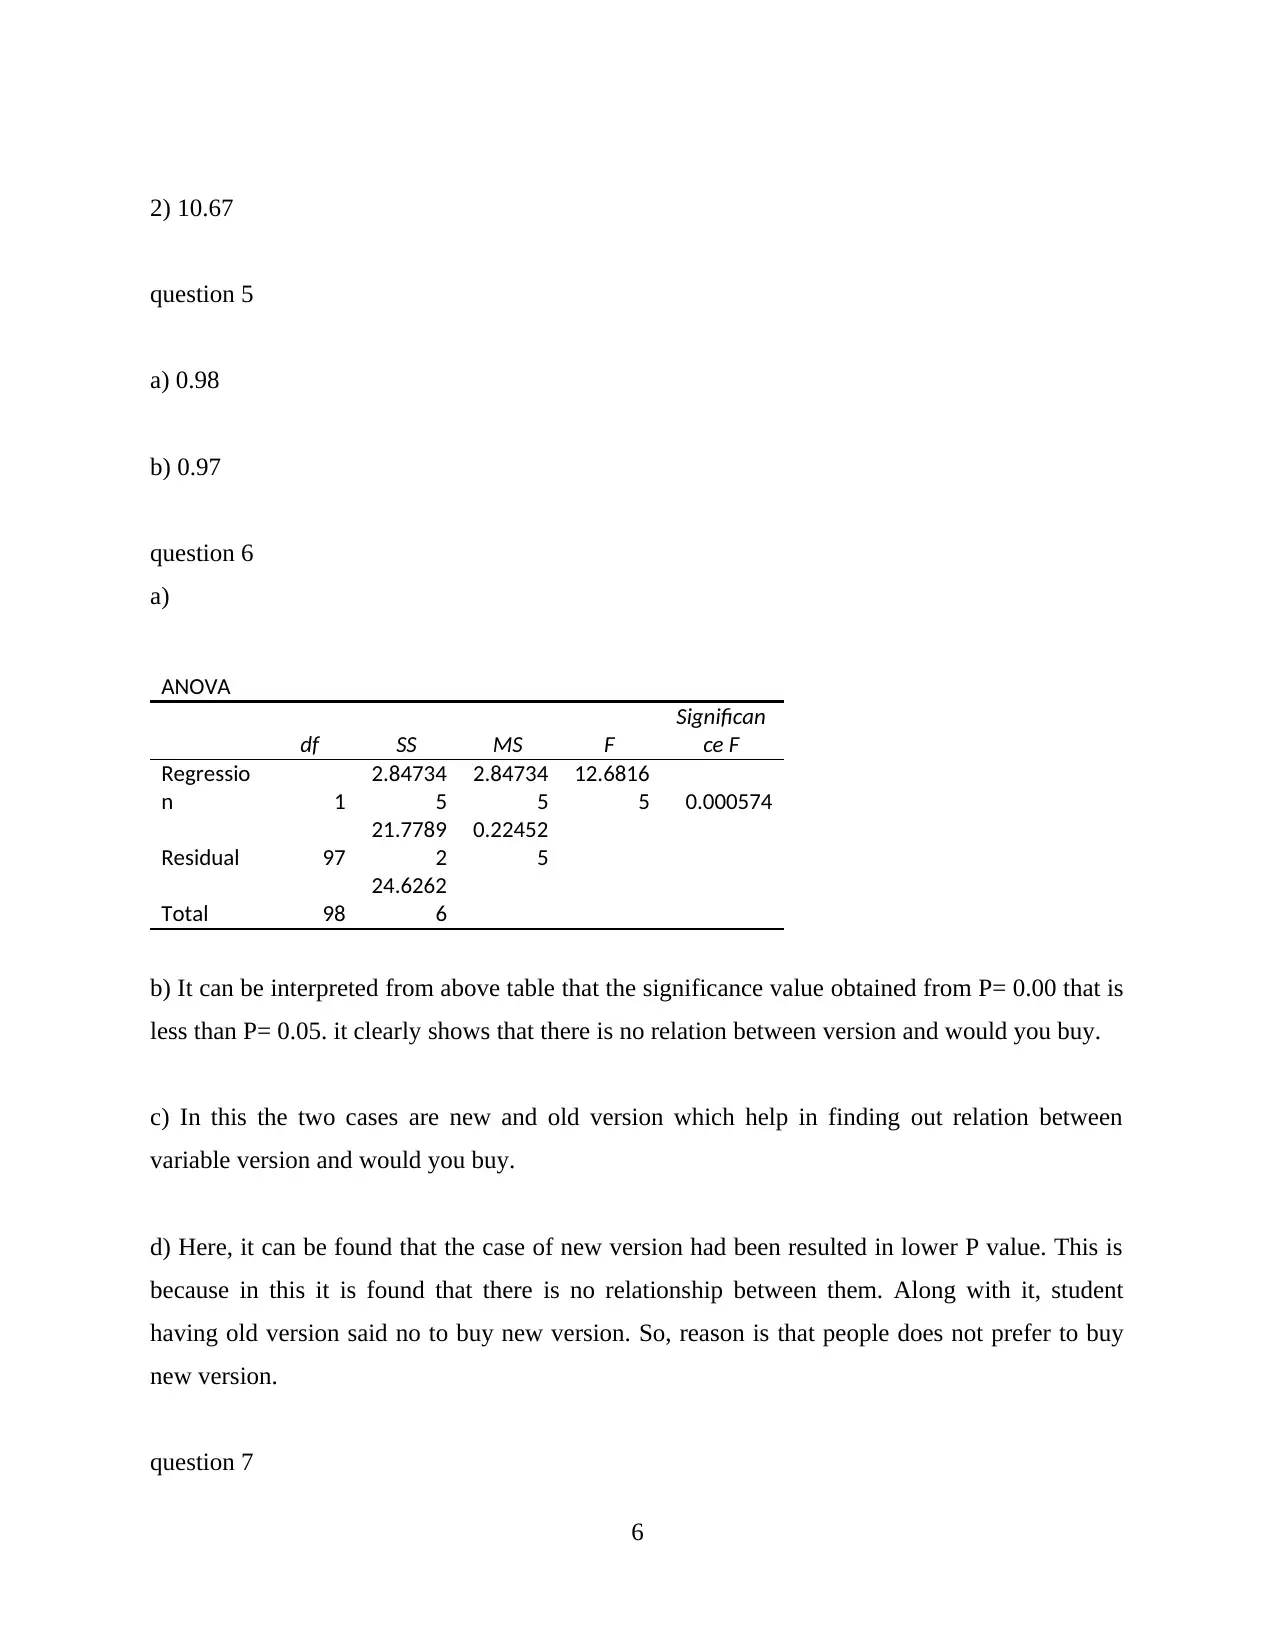
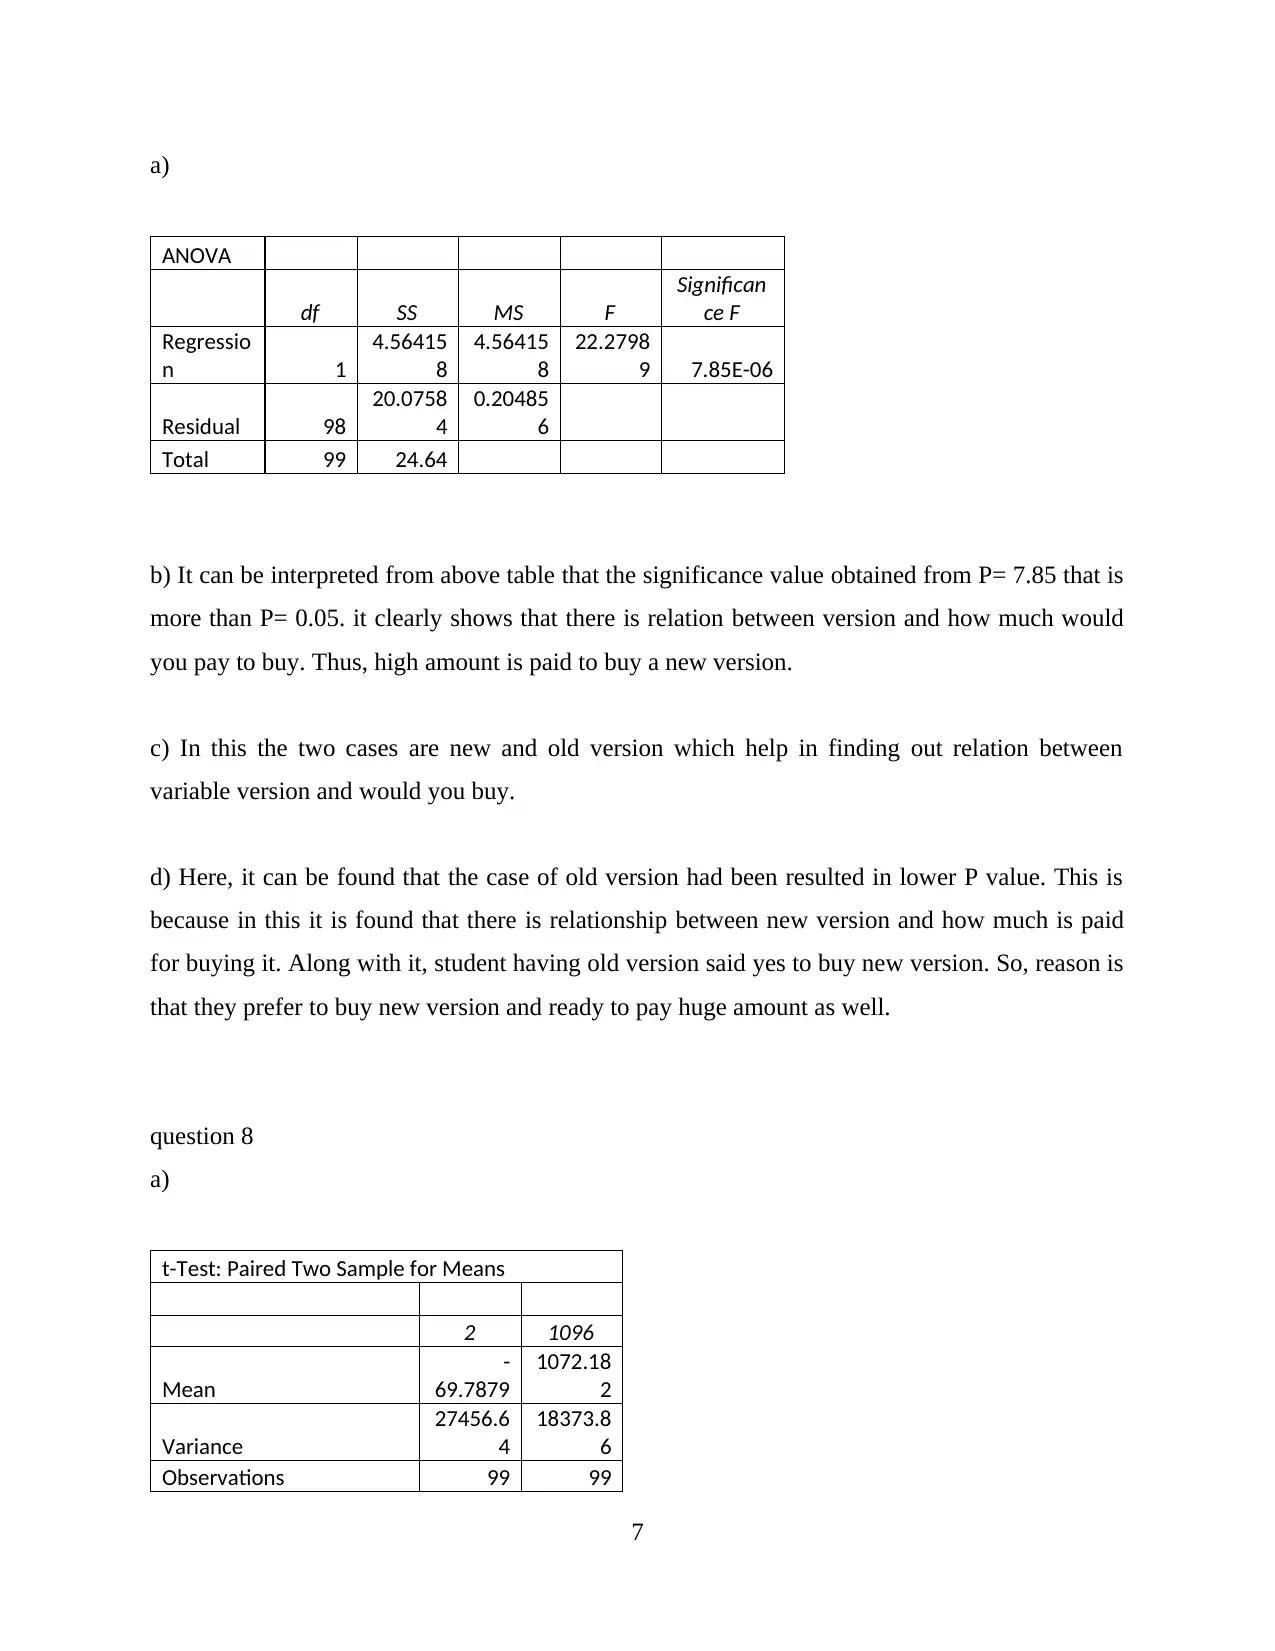
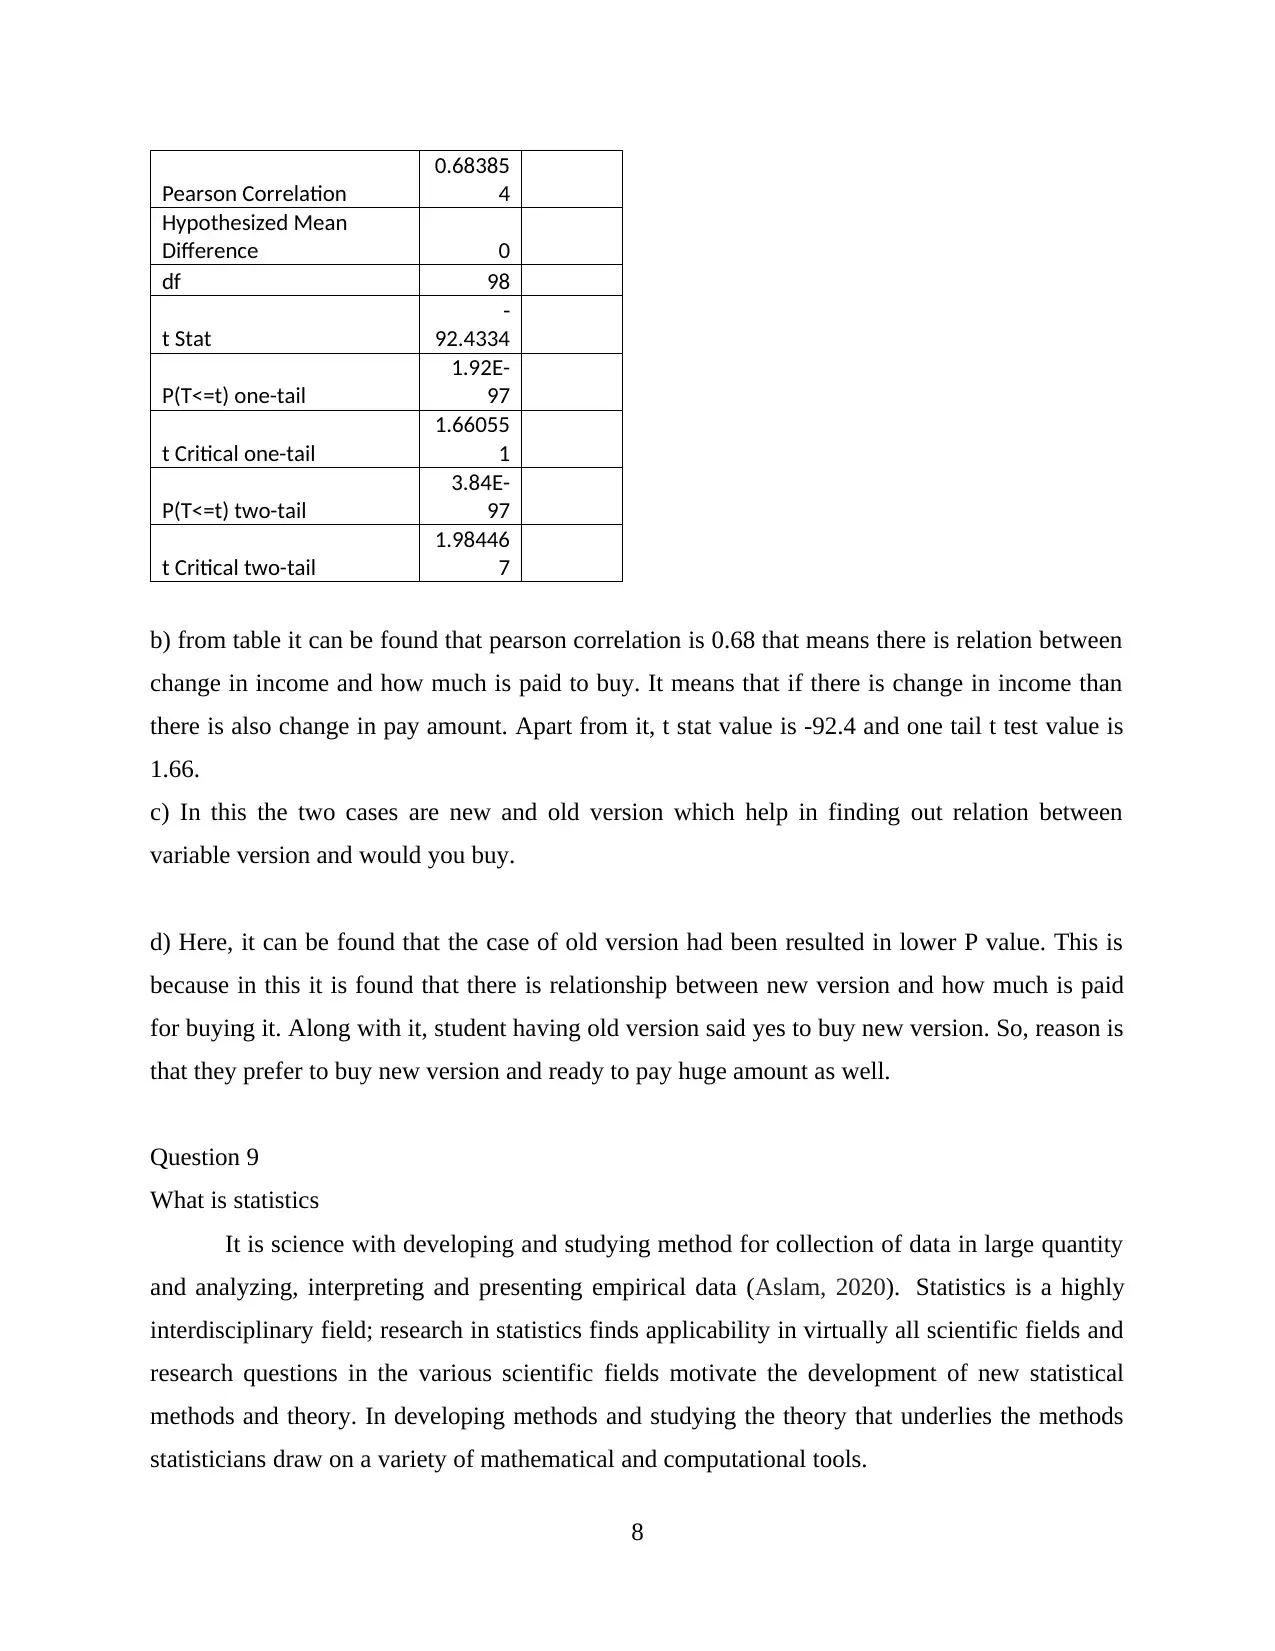
This report presents a comprehensive analysis of a dataset, encompassing various statistical measures and their interpretations. It begins with a summary table, providing key descriptive statistics such as mean, standard error, median, mode, and standard deviation for different variables. The analysis explores relationships between variables, including the examination of p-values to assess the significance of relationships and correlation coefficients to quantify the strength and direction of linear associations. The report includes the application of ANOVA and t-tests to compare means and determine the impact of different factors. Furthermore, the report delves into the application of statistics in business and economics, explaining the role of statistics in economic problem-solving, operations, HRM, information systems, and finance. It also explains the meaning of p-values and how to interpret them, offering a valuable resource for students studying data science and related fields.
1 out of 11
Related Documents


Your All-in-One AI-Powered Toolkit for Academic Success.
+13062052269
info@desklib.com
Available 24*7 on WhatsApp / Email
![[object Object]](/_next/static/media/star-bottom.7253800d.svg)
Copyright © 2020–2026 A2Z Services. All Rights Reserved. Developed and managed by ZUCOL.