AT10251 Statistical Analysis Project Part C: Fuel Price Study
VerifiedAdded on 2023/04/25
|10
|1689
|107
Project
AI Summary
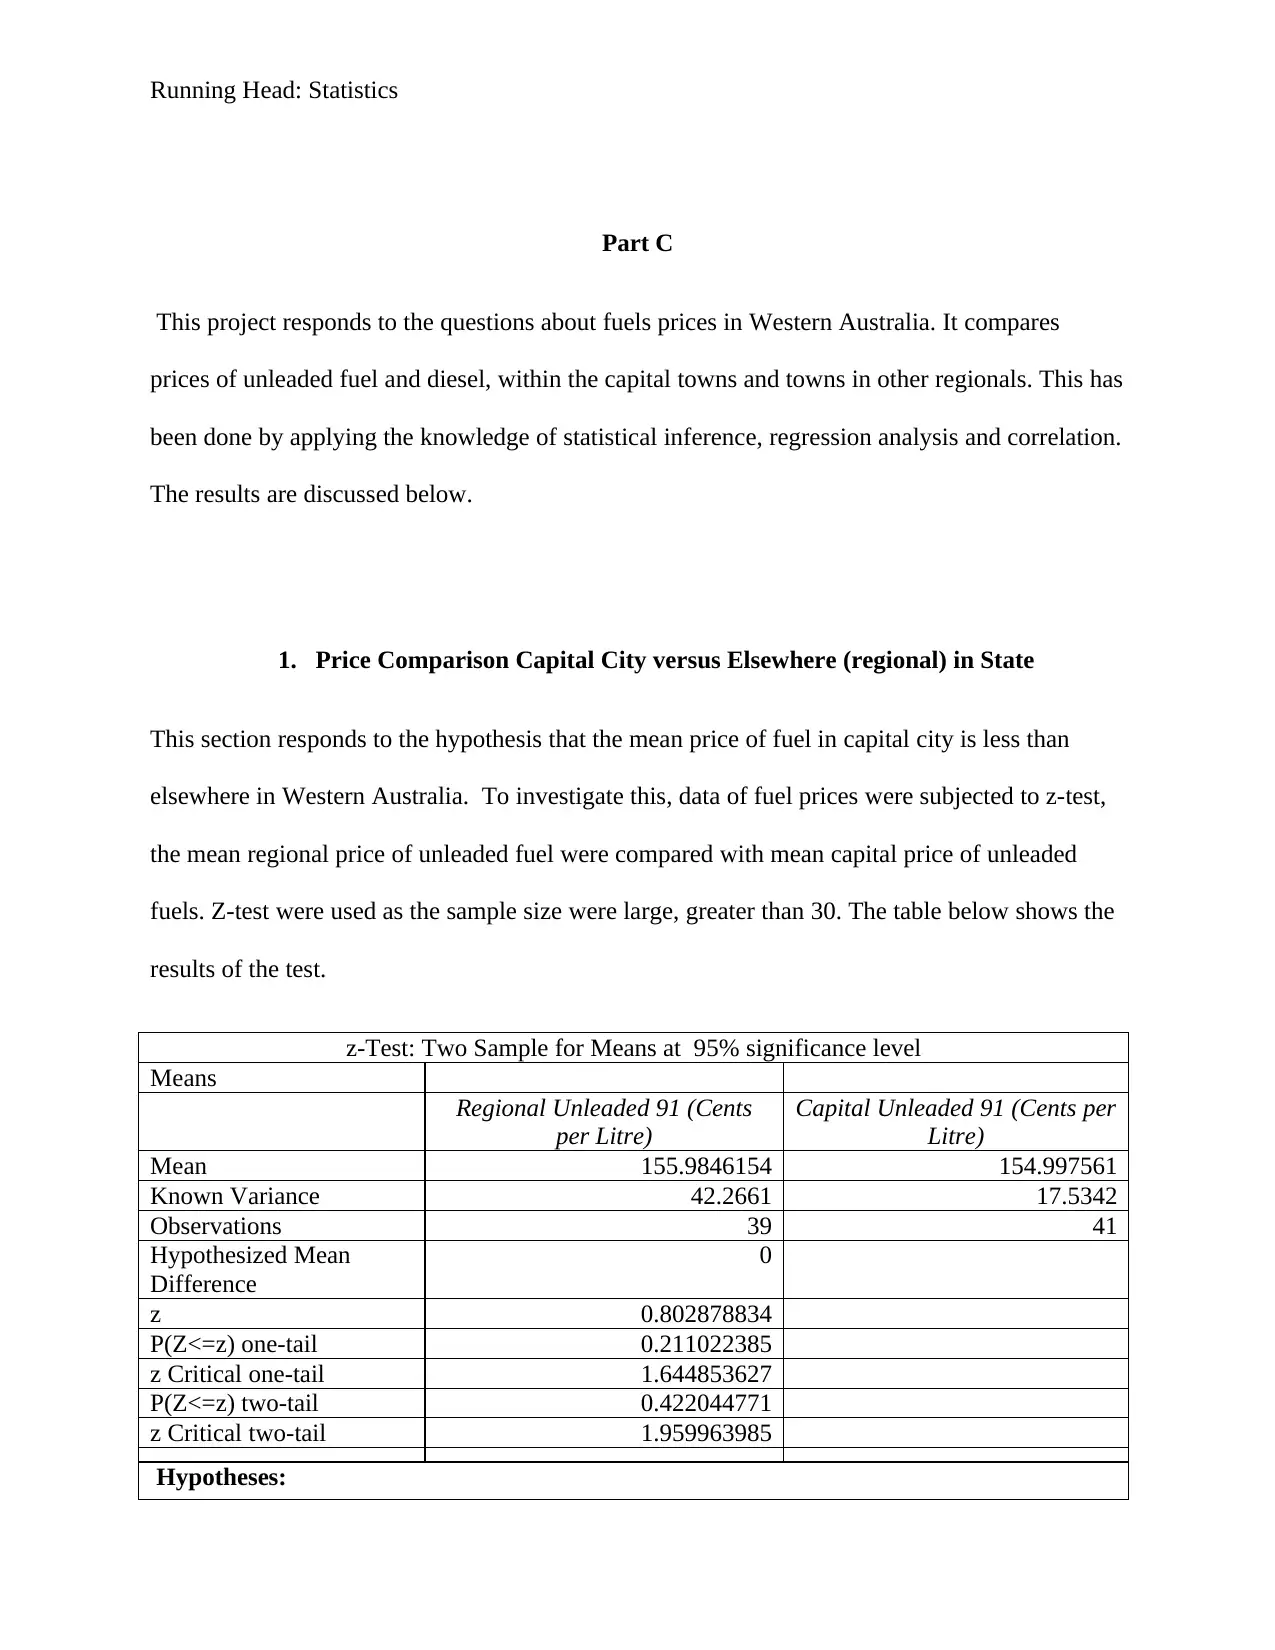
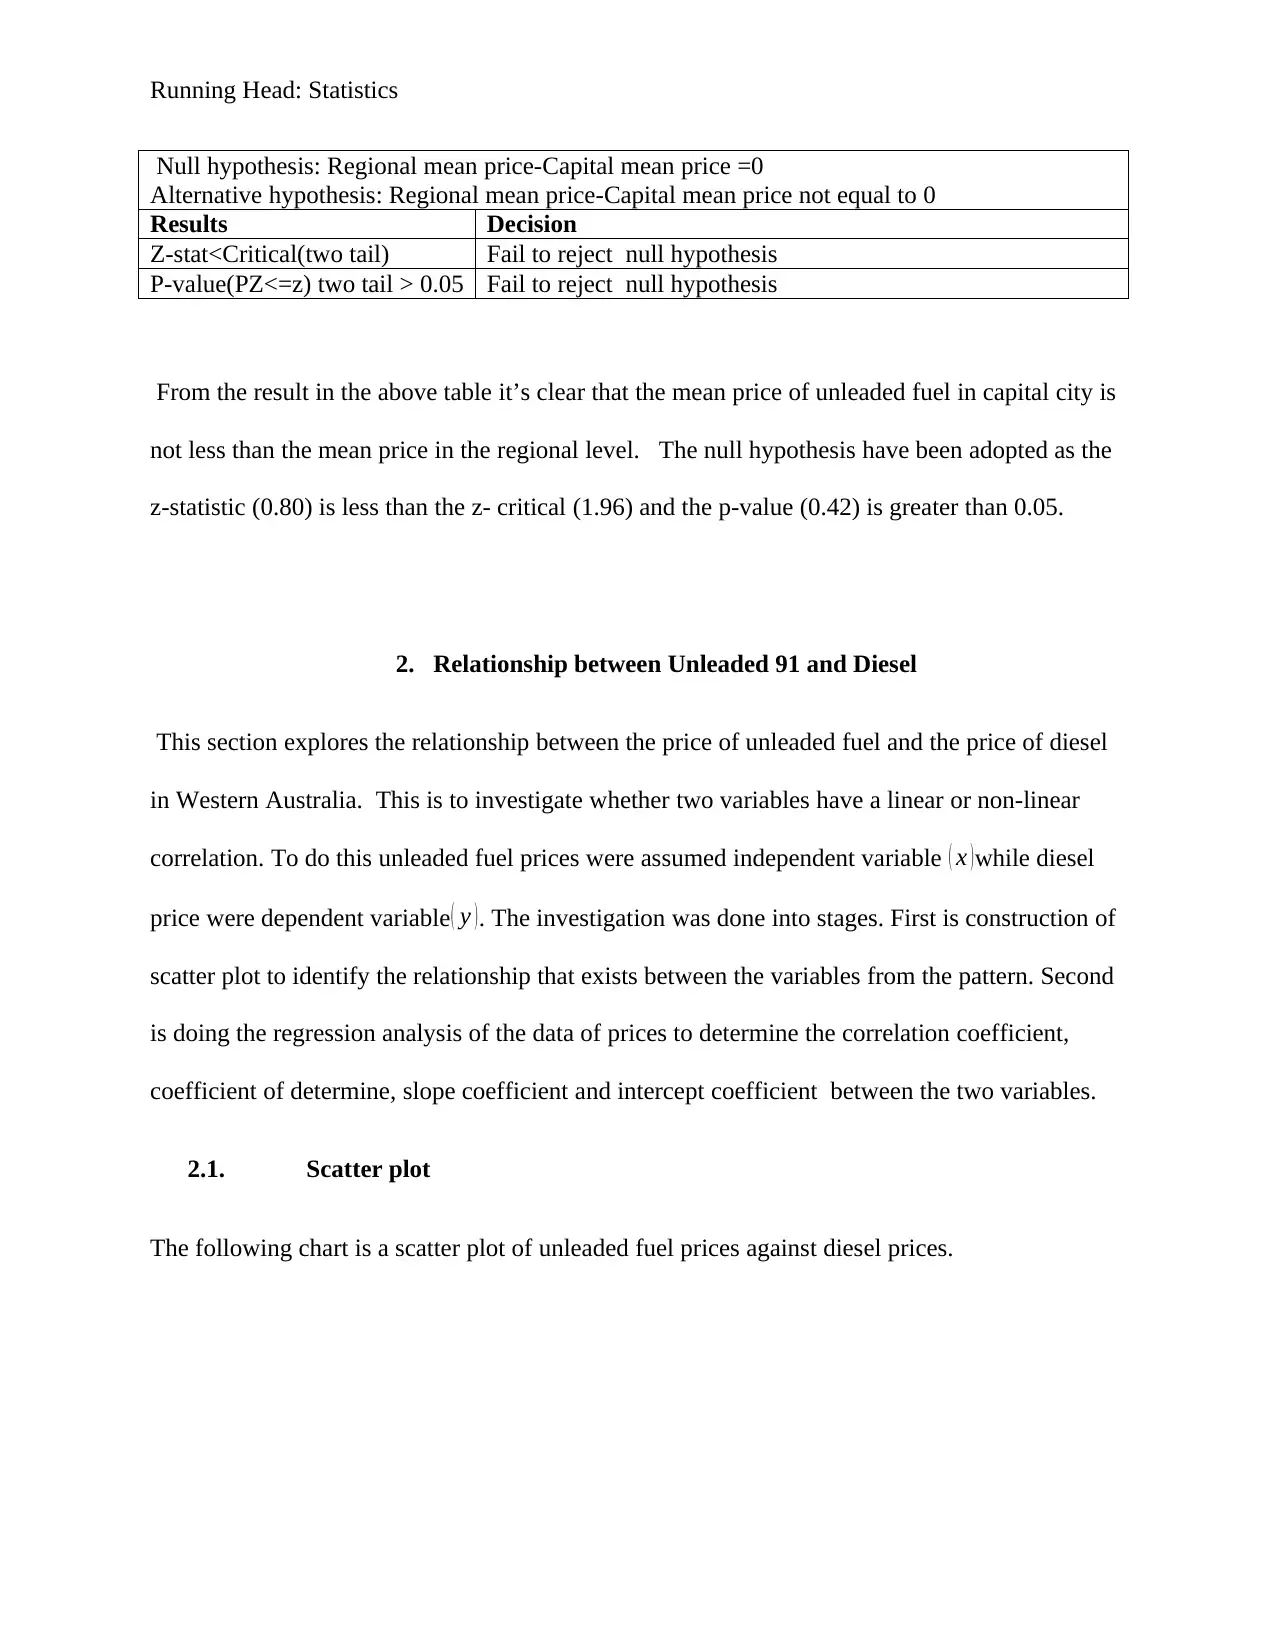
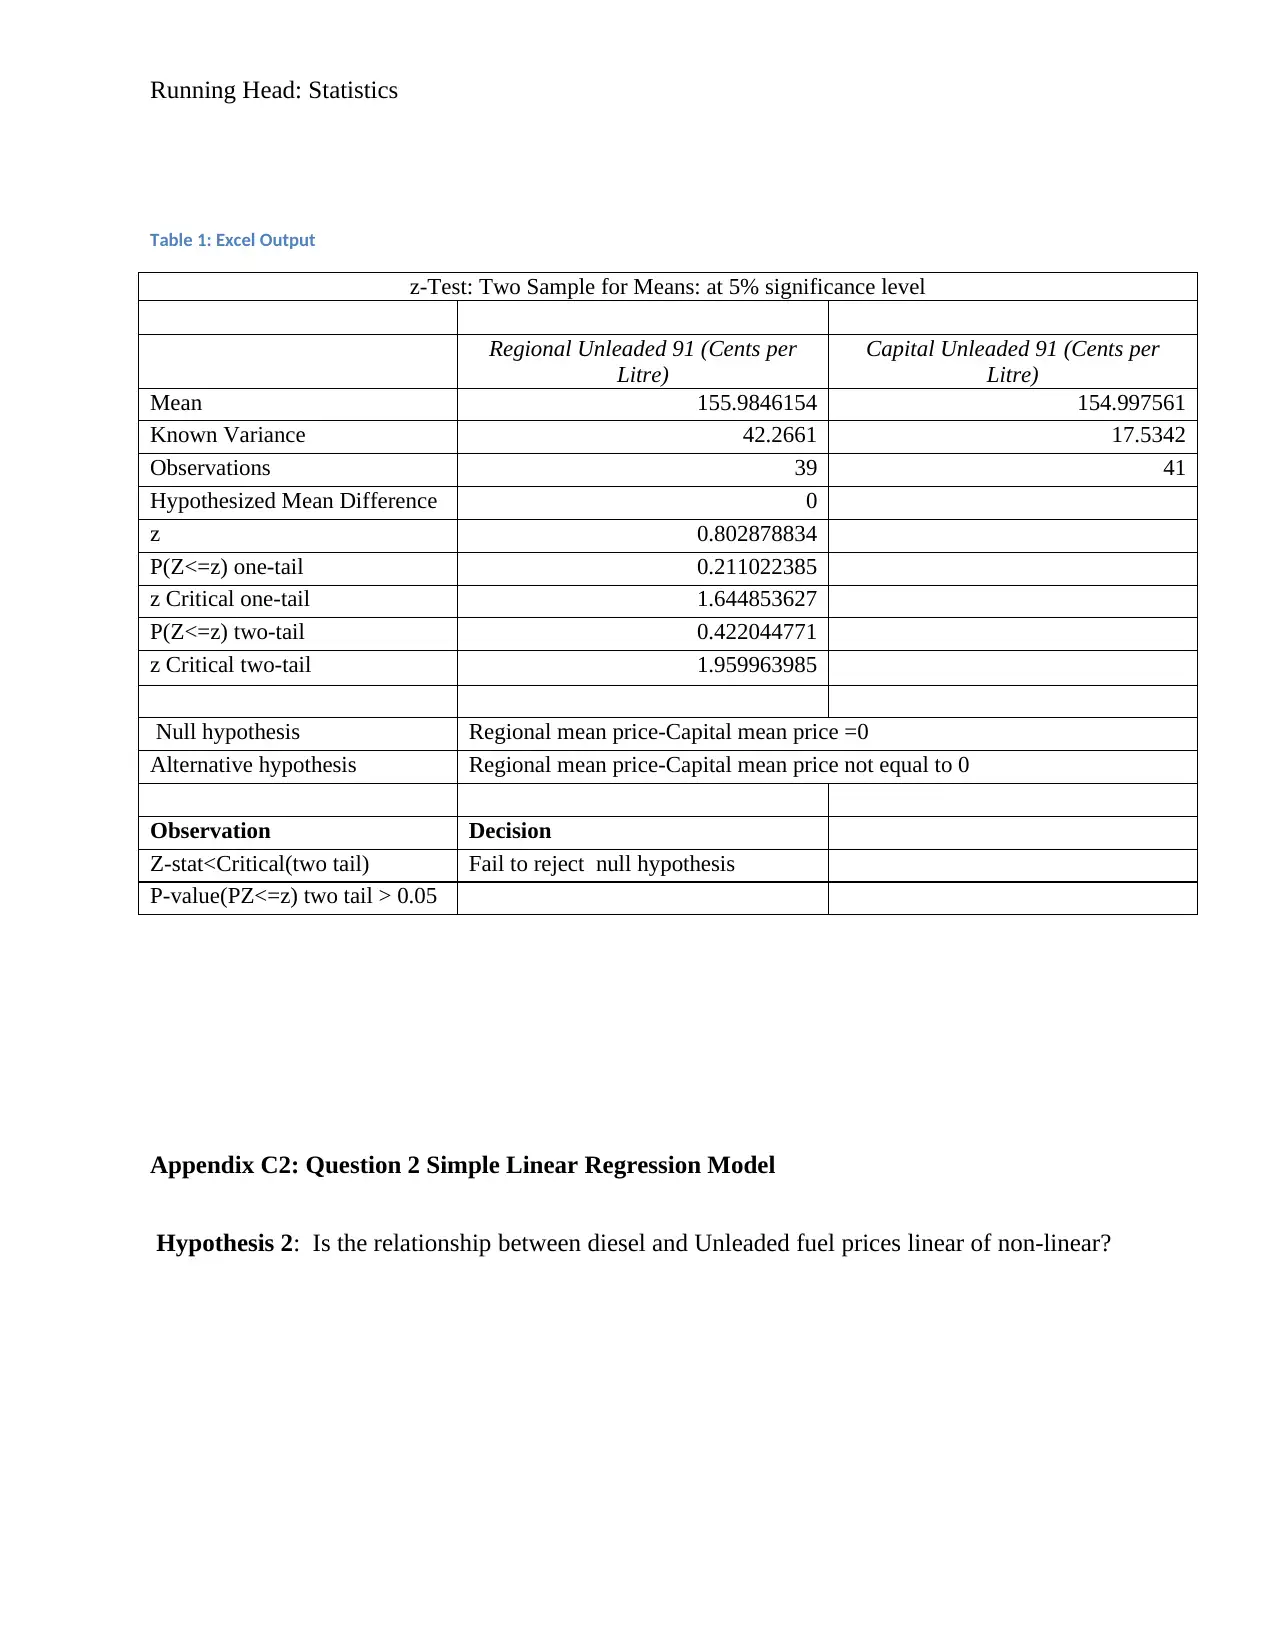
This statistical analysis project investigates fuel prices in Western Australia, comparing unleaded and diesel prices across capital cities and regional areas. The project employs z-tests to compare mean fuel prices between capital cities and regional areas, revealing whether prices differ significantly. Regression analysis and correlation are used to examine the relationship between unleaded and diesel fuel prices, determining the strength and nature of their correlation. Furthermore, a multiple linear regression model incorporates location as a variable to assess its impact on fuel prices. The analysis includes scatter plots, regression tables, and hypothesis testing to draw conclusions about fuel price variations and relationships. The project's findings indicate that the mean price of unleaded fuel in capital cities is not less than in regional areas, and it identifies a strong positive linear correlation between unleaded and diesel fuel prices. Location is found to have no significant influence on the model. The project utilizes data from PetrolSpy Australia, providing a comprehensive statistical evaluation of fuel price dynamics.


1 out of 10
Related Documents


Your All-in-One AI-Powered Toolkit for Academic Success.
+13062052269
info@desklib.com
Available 24*7 on WhatsApp / Email
![[object Object]](/_next/static/media/star-bottom.7253800d.svg)
Copyright © 2020–2026 A2Z Services. All Rights Reserved. Developed and managed by ZUCOL.