Gender Pay Gap in Australia: Statistical Modelling
Added on 2023-06-12
11 Pages2190 Words404 Views
STATISTICAL MODELLING
STUDENT ID:
[Pick the date]
STUDENT ID:
[Pick the date]
Section 1: Introduction
a) A glaring issue which is gripping Australia labour force is that of differential pay being
given to the two genders. In this regards, as per certain estimates, it has been found that
the wages/salaries drawn by females is about 15% lower in comparison to the other gender
i.e. males. Clearly, the existence of this trend in the future or worsening of the same can
potentially have adverse impact on the participation of females in the workplace and also
have implications for the workforce diversity. While some may argue that the difference in
salary levels is on account of difference in representation of the two genders in different
occupations, but there are some who indicate that the differential wage trend also is
prevalent in occupations where female representation is more than 50%. Further, this
inequality in gender pay also called as gender gap continues to exist despite presence of
legislation which forbids any differentiation based on gender (Livsey, 2017). The central
research question that is thus addressed is to find if gender gap is established in the dataset
provided considering the underlying information about occupations.
b) A unique dataset that has been provided for 1000 taxpayers from Australia is Dataset one.
This is regarded as secondary in nature since the researcher has himself/herself not
collected the data but ATO is the source of the data provided. Hence, it was the ATO
which primarily collected the data and a sample from that data was used for dataset 1
making it secondary data (Flick, 2015). This dataset comprises of four variables in the
form of gender, occupational code, salary amount and gift amount as deduction. While the
first two are categorical variables, the latter two are quantitative variables. The categorical
variables in the dataset are measured using nominal scale unlike quantitative variables
which are measured using interval scale (Hair et. al., 2015).
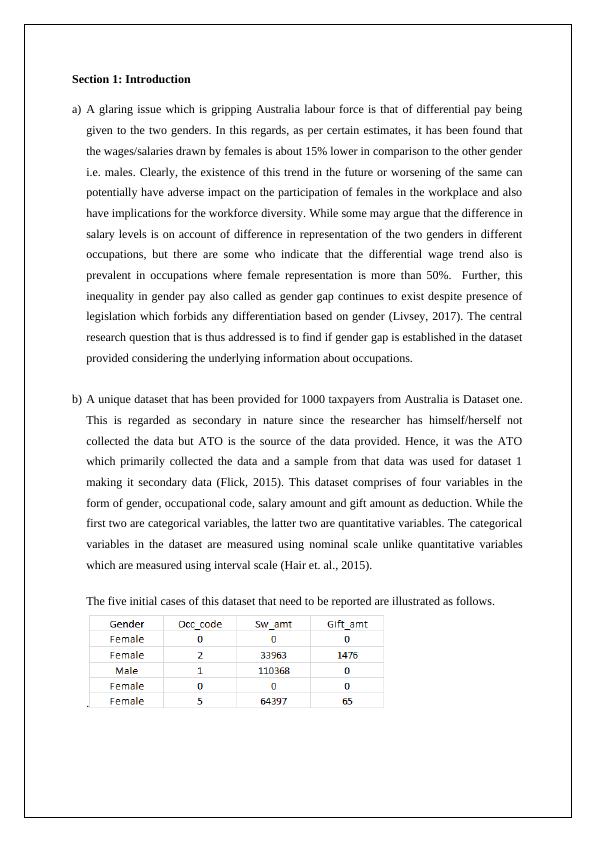
The five initial cases of this dataset that need to be reported are illustrated as follows.
.
a) A glaring issue which is gripping Australia labour force is that of differential pay being
given to the two genders. In this regards, as per certain estimates, it has been found that
the wages/salaries drawn by females is about 15% lower in comparison to the other gender
i.e. males. Clearly, the existence of this trend in the future or worsening of the same can
potentially have adverse impact on the participation of females in the workplace and also
have implications for the workforce diversity. While some may argue that the difference in
salary levels is on account of difference in representation of the two genders in different
occupations, but there are some who indicate that the differential wage trend also is
prevalent in occupations where female representation is more than 50%. Further, this
inequality in gender pay also called as gender gap continues to exist despite presence of
legislation which forbids any differentiation based on gender (Livsey, 2017). The central
research question that is thus addressed is to find if gender gap is established in the dataset
provided considering the underlying information about occupations.
b) A unique dataset that has been provided for 1000 taxpayers from Australia is Dataset one.
This is regarded as secondary in nature since the researcher has himself/herself not
collected the data but ATO is the source of the data provided. Hence, it was the ATO
which primarily collected the data and a sample from that data was used for dataset 1
making it secondary data (Flick, 2015). This dataset comprises of four variables in the
form of gender, occupational code, salary amount and gift amount as deduction. While the
first two are categorical variables, the latter two are quantitative variables. The categorical
variables in the dataset are measured using nominal scale unlike quantitative variables
which are measured using interval scale (Hair et. al., 2015).
The five initial cases of this dataset that need to be reported are illustrated as follows.
.
c) Yet another dataset which is used is dataset 2 which comprises of only 30 samples and has
two variables namely the salary level and the gender. It would be appropriate to label this
data as primary data owing to the fact that this has been collected by the researcher only.
Even though this is primary data but it is inferior to the secondary dataset which is dataset
1. This is on account of the few issues with the collection methodology. One of these is the
underlying sampling technique which is not probability based but driven by my
convenience and hence the odds of the data being biased are significant. Further, the data
collected may not be accurate due to exaggerated responses by the respondents in an
attempt to exaggerate their salary level owing to personal relationship between them and
myself. The collection has been reduced to just two variables since these are mandatory
for exploring the underlying research question with regards to possible gender gap being
present (Eriksson and Kovalainen, 2015).
Section 2: Descriptive Statistics
a) The appropriate graphical illustration for the given relationship is in the form of the
following column chart.
The above graph reflects on the difference in gender proportions that are expected across
different occupations. It is noteworthy that the difference in the representation levels of the
two genders is clearly very stark across some occupations. An ideal example of this would be
the occupation with corresponding 7 where the representation of females is quite dismal as
less than 5% of the individuals employed in this occupation for the sample comprises of
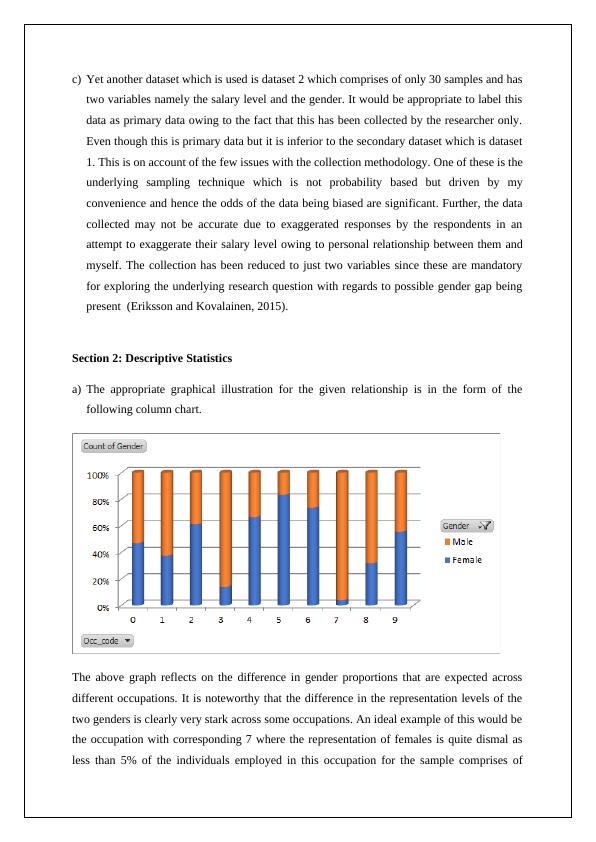
females. A similar situation is witnessed in case of occupation with code 3 even though
female representation is a tad better than the situation in code 7 occupation. Also, it is
noteworthy that males are not subject to minority representation to such an extent is any of
the occupations listed below.
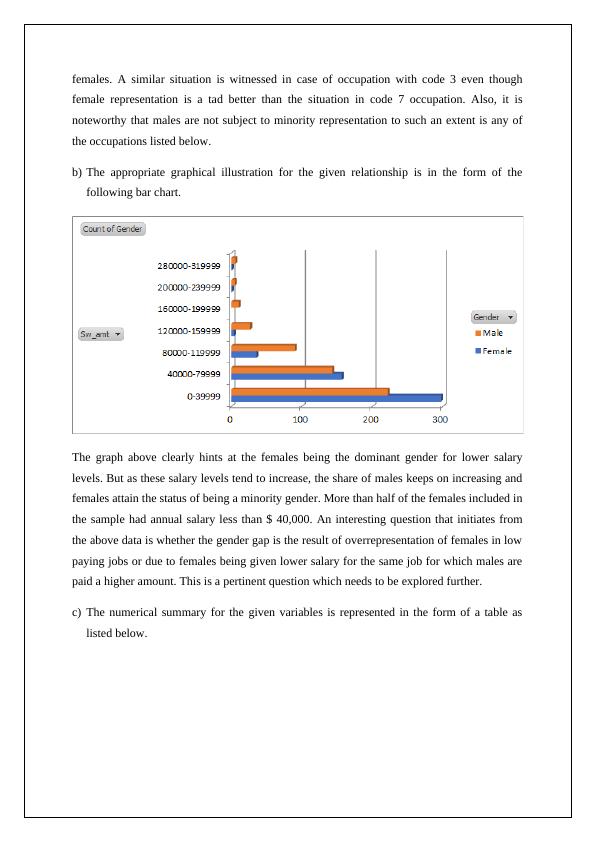
b) The appropriate graphical illustration for the given relationship is in the form of the
following bar chart.
The graph above clearly hints at the females being the dominant gender for lower salary
levels. But as these salary levels tend to increase, the share of males keeps on increasing and
females attain the status of being a minority gender. More than half of the females included in
the sample had annual salary less than $ 40,000. An interesting question that initiates from
the above data is whether the gender gap is the result of overrepresentation of females in low
paying jobs or due to females being given lower salary for the same job for which males are
paid a higher amount. This is a pertinent question which needs to be explored further.
c) The numerical summary for the given variables is represented in the form of a table as
listed below.
female representation is a tad better than the situation in code 7 occupation. Also, it is
noteworthy that males are not subject to minority representation to such an extent is any of
the occupations listed below.
b) The appropriate graphical illustration for the given relationship is in the form of the
following bar chart.
The graph above clearly hints at the females being the dominant gender for lower salary
levels. But as these salary levels tend to increase, the share of males keeps on increasing and
females attain the status of being a minority gender. More than half of the females included in
the sample had annual salary less than $ 40,000. An interesting question that initiates from
the above data is whether the gender gap is the result of overrepresentation of females in low
paying jobs or due to females being given lower salary for the same job for which males are
paid a higher amount. This is a pertinent question which needs to be explored further.
c) The numerical summary for the given variables is represented in the form of a table as
listed below.
End of preview
Want to access all the pages? Upload your documents or become a member.
Related Documents
Statistical Modelling - Assignmentlg...
|11
|2197
|61
Statistical Modelling Assignment PDFlg...
|12
|2377
|37
Introduction - Statistical Modelinglg...
|12
|2173
|100
Statistical Modelling - Assignment PDFlg...
|11
|2022
|43
Gender Gap in Workforce Managementlg...
|10
|1500
|438
Statistical Modelling - Assignment PDFlg...
|11
|1983
|83