Statistical Modelling Assignment PDF
Added on 2021-05-30
12 Pages2377 Words37 Views
STATISTICALMODELLINGSTUDENT ID:[Pick the date]
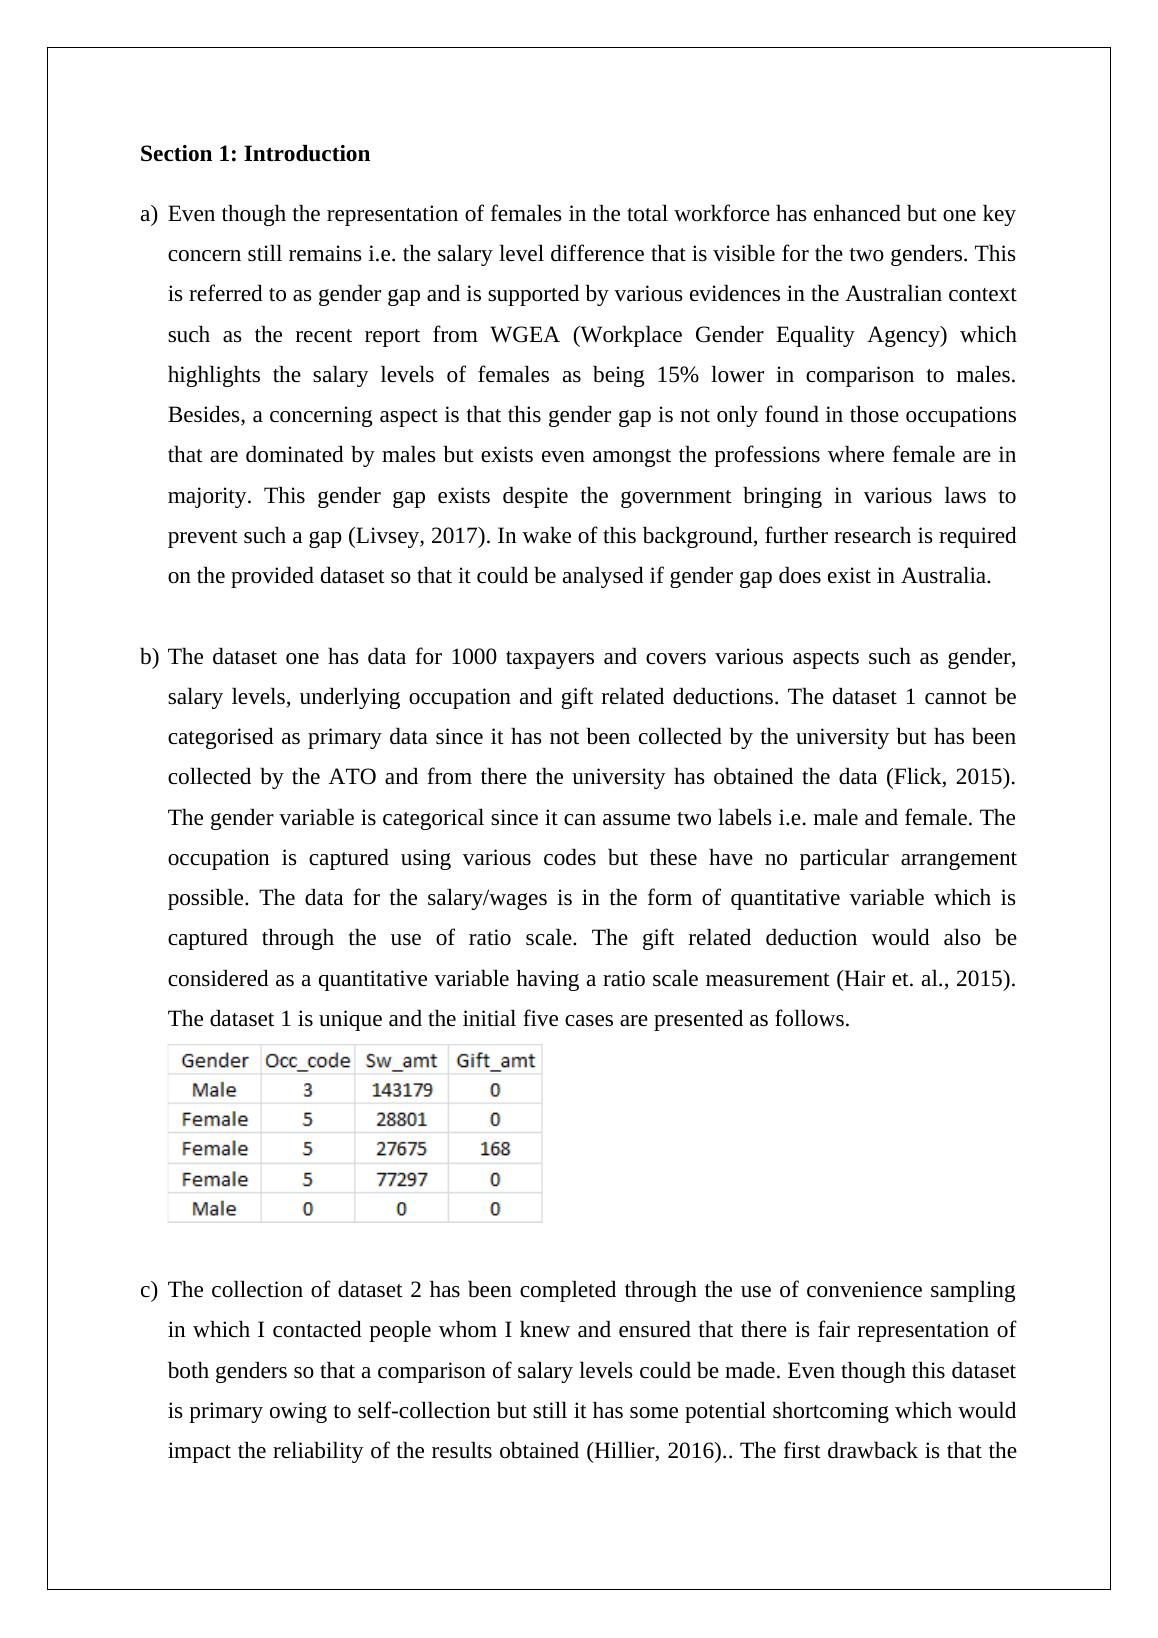
Section 1: Introductiona)Even though the representation of females in the total workforce has enhanced but one keyconcern still remains i.e. the salary level difference that is visible for the two genders. Thisis referred to as gender gap and is supported by various evidences in the Australian contextsuch as the recent report from WGEA (Workplace Gender Equality Agency) whichhighlights the salary levels of females as being 15% lower in comparison to males.Besides, a concerning aspect is that this gender gap is not only found in those occupationsthat are dominated by males but exists even amongst the professions where female are inmajority. This gender gap exists despite the government bringing in various laws toprevent such a gap (Livsey, 2017). In wake of this background, further research is requiredon the provided dataset so that it could be analysed if gender gap does exist in Australia. b)The dataset one has data for 1000 taxpayers and covers various aspects such as gender,salary levels, underlying occupation and gift related deductions. The dataset 1 cannot becategorised as primary data since it has not been collected by the university but has beencollected by the ATO and from there the university has obtained the data (Flick, 2015).The gender variable is categorical since it can assume two labels i.e. male and female. Theoccupation is captured using various codes but these have no particular arrangementpossible. The data for the salary/wages is in the form of quantitative variable which iscaptured through the use of ratio scale. The gift related deduction would also beconsidered as a quantitative variable having a ratio scale measurement (Hair et. al., 2015).The dataset 1 is unique and the initial five cases are presented as follows.c)The collection of dataset 2 has been completed through the use of convenience samplingin which I contacted people whom I knew and ensured that there is fair representation ofboth genders so that a comparison of salary levels could be made. Even though this datasetis primary owing to self-collection but still it has some potential shortcoming which wouldimpact the reliability of the results obtained (Hillier, 2016).. The first drawback is that the
given sample can potentially be biased since random sampling has not been deployed.Also, some of the data may be wrong particularly the salary as people may have overstatedconsidering that they were aware that this was being given to me and since I knew thempersonally. In this primary dataset, there are only two variables which are of interest forthe given research question. One of these is the gender represented through the use of maleand female labels. The variable is categorical. The other variable i.e. salary is quantitativeowing to representation by numerical values (Eriksson and Kovalainen, 2015). Thesample size of dataset 2 is taken as 34. Section 2: Descriptive Statistics (Using Dataset 1)a)The requisite representation in graphical terms for the relationship between occupation andgender is summarised as follows.The key observation which can be drawn from the graph indicated above is that therepresentation of the two genders is not the same or similar across professions and there is asignificant difference in this regards. A case in point is of code 7 which represents drivers andmachine operators. The proportion of female workers in this occupation is abysmally low.Then there are certain occupations represented with code 4 and 5 which have adisproportionate representation from females since one of the occupations is communityservices while the other comprises of clerical and administrative workers. Community
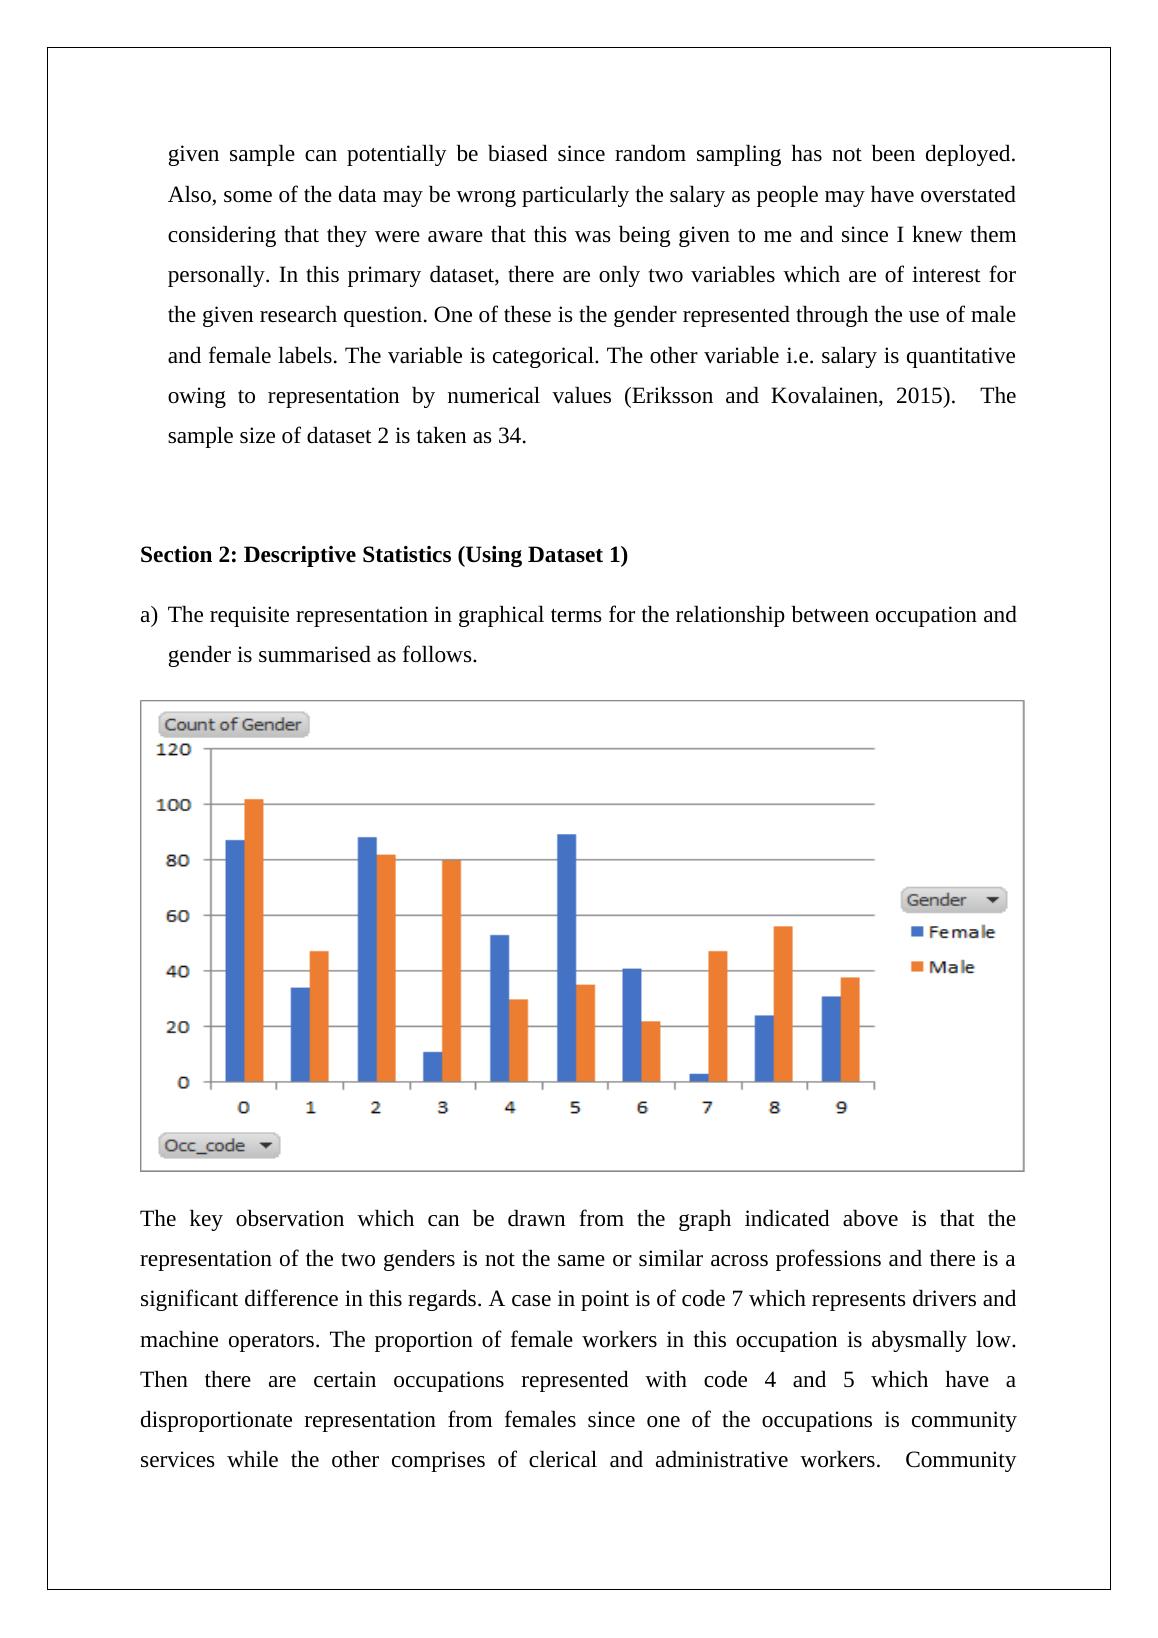
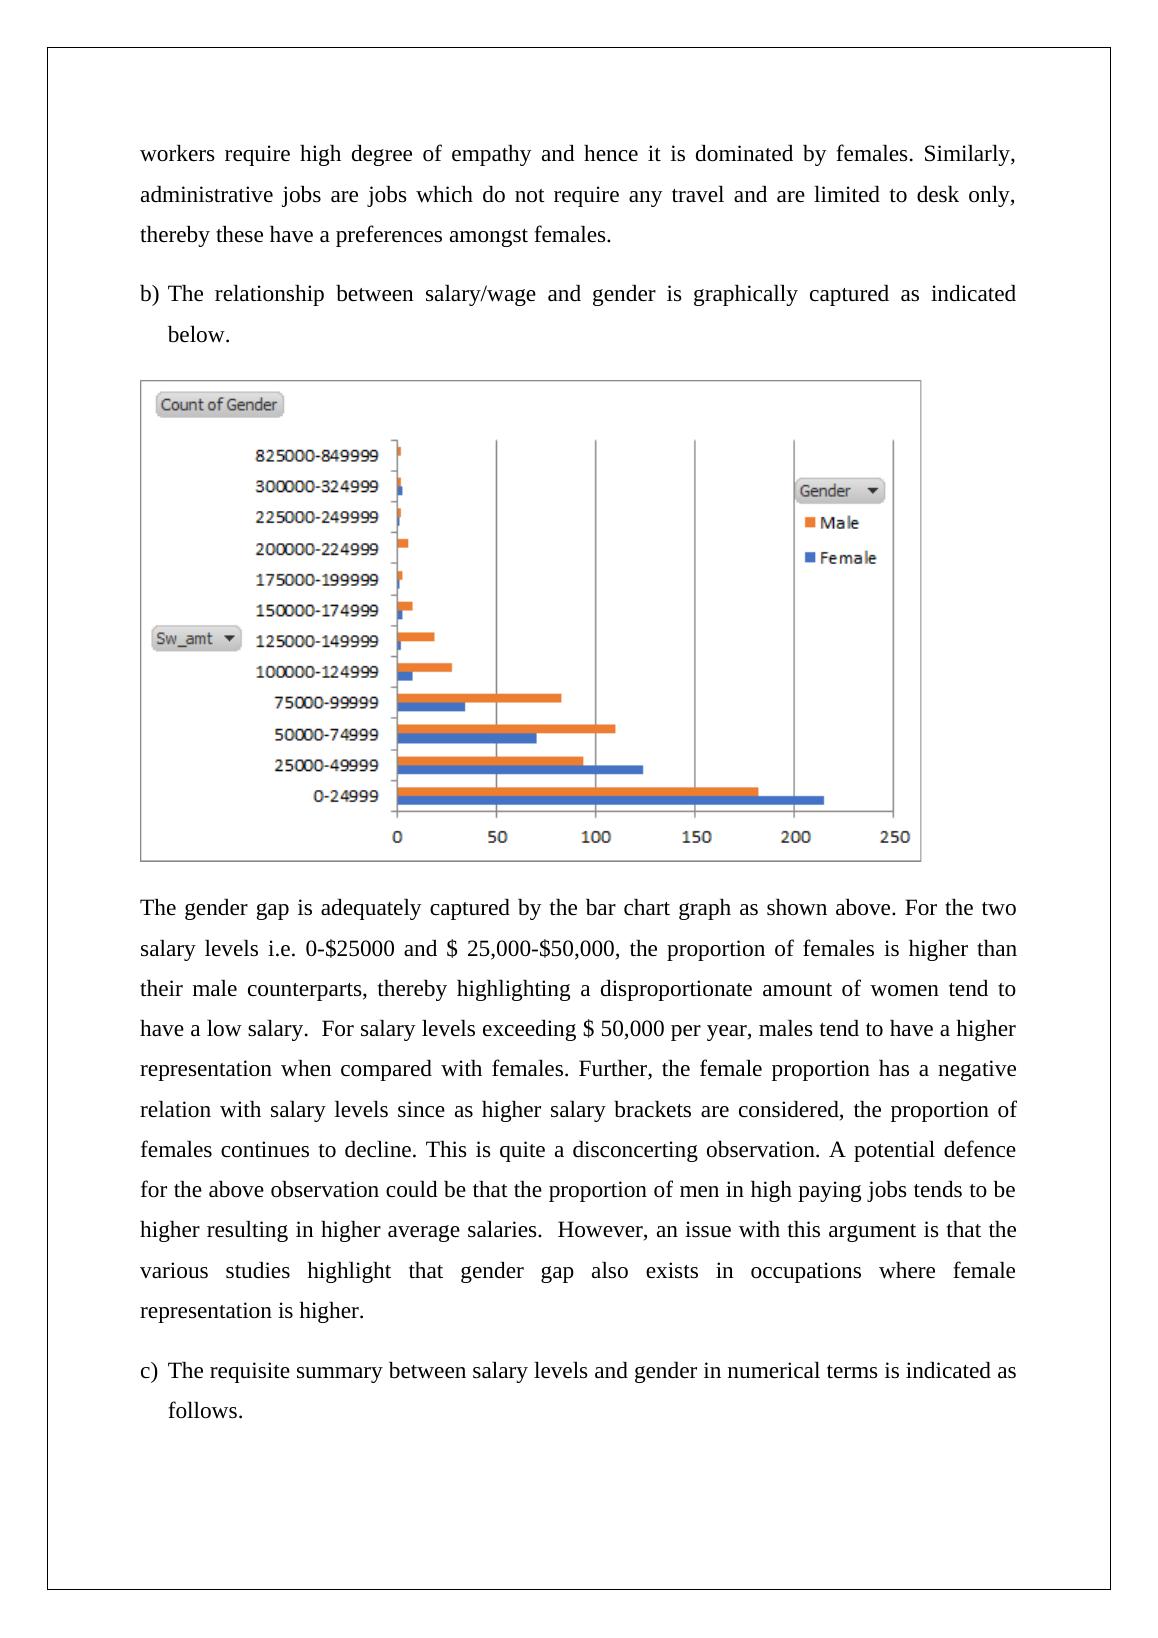
workers require high degree of empathy and hence it is dominated by females. Similarly,administrative jobs are jobs which do not require any travel and are limited to desk only,thereby these have a preferences amongst females.b)The relationship between salary/wage and gender is graphically captured as indicatedbelow.The gender gap is adequately captured by the bar chart graph as shown above. For the twosalary levels i.e. 0-$25000 and $ 25,000-$50,000, the proportion of females is higher thantheir male counterparts, thereby highlighting a disproportionate amount of women tend tohave a low salary. For salary levels exceeding $ 50,000 per year, males tend to have a higherrepresentation when compared with females. Further, the female proportion has a negativerelation with salary levels since as higher salary brackets are considered, the proportion offemales continues to decline. This is quite a disconcerting observation. A potential defencefor the above observation could be that the proportion of men in high paying jobs tends to behigher resulting in higher average salaries. However, an issue with this argument is that thevarious studies highlight that gender gap also exists in occupations where femalerepresentation is higher. c)The requisite summary between salary levels and gender in numerical terms is indicated asfollows.
End of preview
Want to access all the pages? Upload your documents or become a member.
Related Documents
Gender Pay Gap in Australia: Statistical Modellinglg...
|11
|2190
|404
Statistical Modelling - Assignment PDFlg...
|11
|1983
|83
(PDF) An introduction to statistical modellinglg...
|12
|2406
|48
Gender Gap in Workforce Managementlg...
|10
|1500
|438
Introduction - Statistical Modelinglg...
|12
|2173
|100
Statistical Modelling - Assignmentlg...
|11
|2197
|61