Statistical Modelling - Assignment PDF
Added on 2021-05-31
11 Pages2022 Words43 Views
STATISTICALMODELLINGSTUDENT ID:[Pick the date]
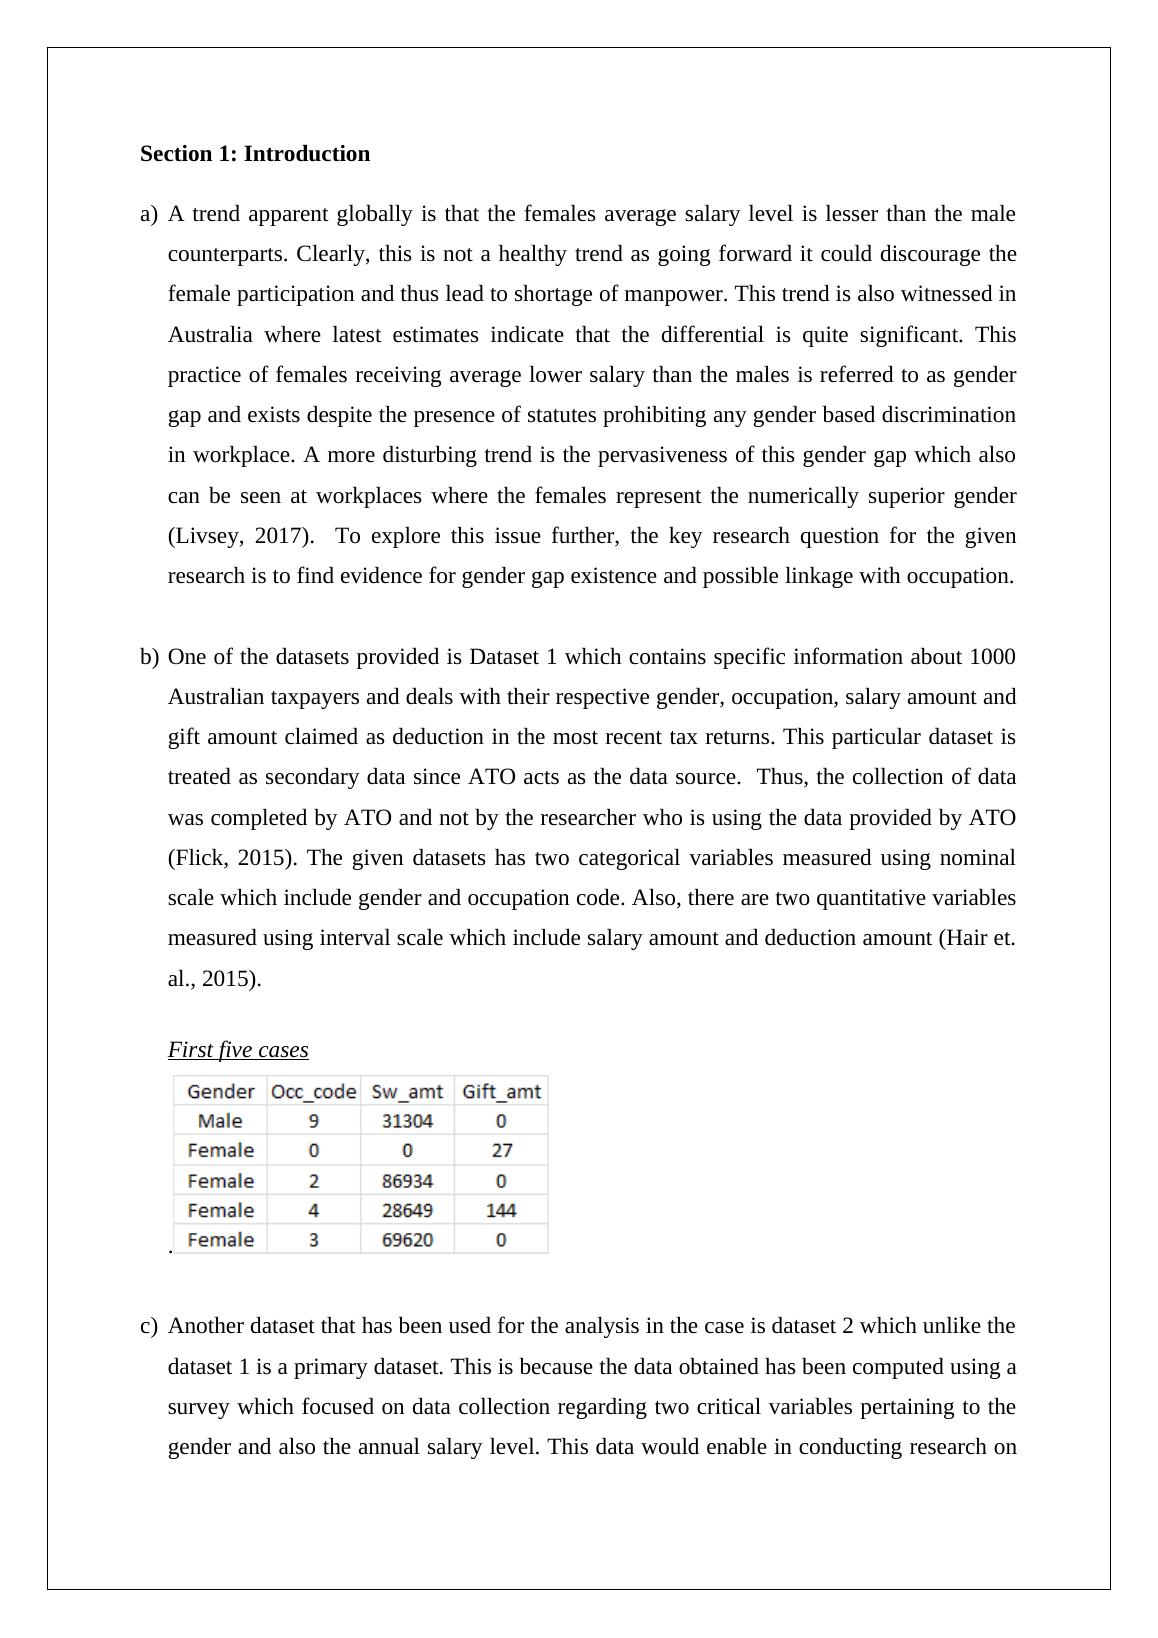
Section 1: Introductiona)A trend apparent globally is that the females average salary level is lesser than the malecounterparts. Clearly, this is not a healthy trend as going forward it could discourage thefemale participation and thus lead to shortage of manpower. This trend is also witnessed inAustralia where latest estimates indicate that the differential is quite significant. Thispractice of females receiving average lower salary than the males is referred to as gendergap and exists despite the presence of statutes prohibiting any gender based discriminationin workplace. A more disturbing trend is the pervasiveness of this gender gap which alsocan be seen at workplaces where the females represent the numerically superior gender(Livsey, 2017). To explore this issue further, the key research question for the givenresearch is to find evidence for gender gap existence and possible linkage with occupation.b)One of the datasets provided is Dataset 1 which contains specific information about 1000Australian taxpayers and deals with their respective gender, occupation, salary amount andgift amount claimed as deduction in the most recent tax returns. This particular dataset istreated as secondary data since ATO acts as the data source. Thus, the collection of datawas completed by ATO and not by the researcher who is using the data provided by ATO(Flick, 2015). The given datasets has two categorical variables measured using nominalscale which include gender and occupation code. Also, there are two quantitative variablesmeasured using interval scale which include salary amount and deduction amount (Hair et.al., 2015). First five cases.c)Another dataset that has been used for the analysis in the case is dataset 2 which unlike thedataset 1 is a primary dataset. This is because the data obtained has been computed using asurvey which focused on data collection regarding two critical variables pertaining to thegender and also the annual salary level. This data would enable in conducting research on
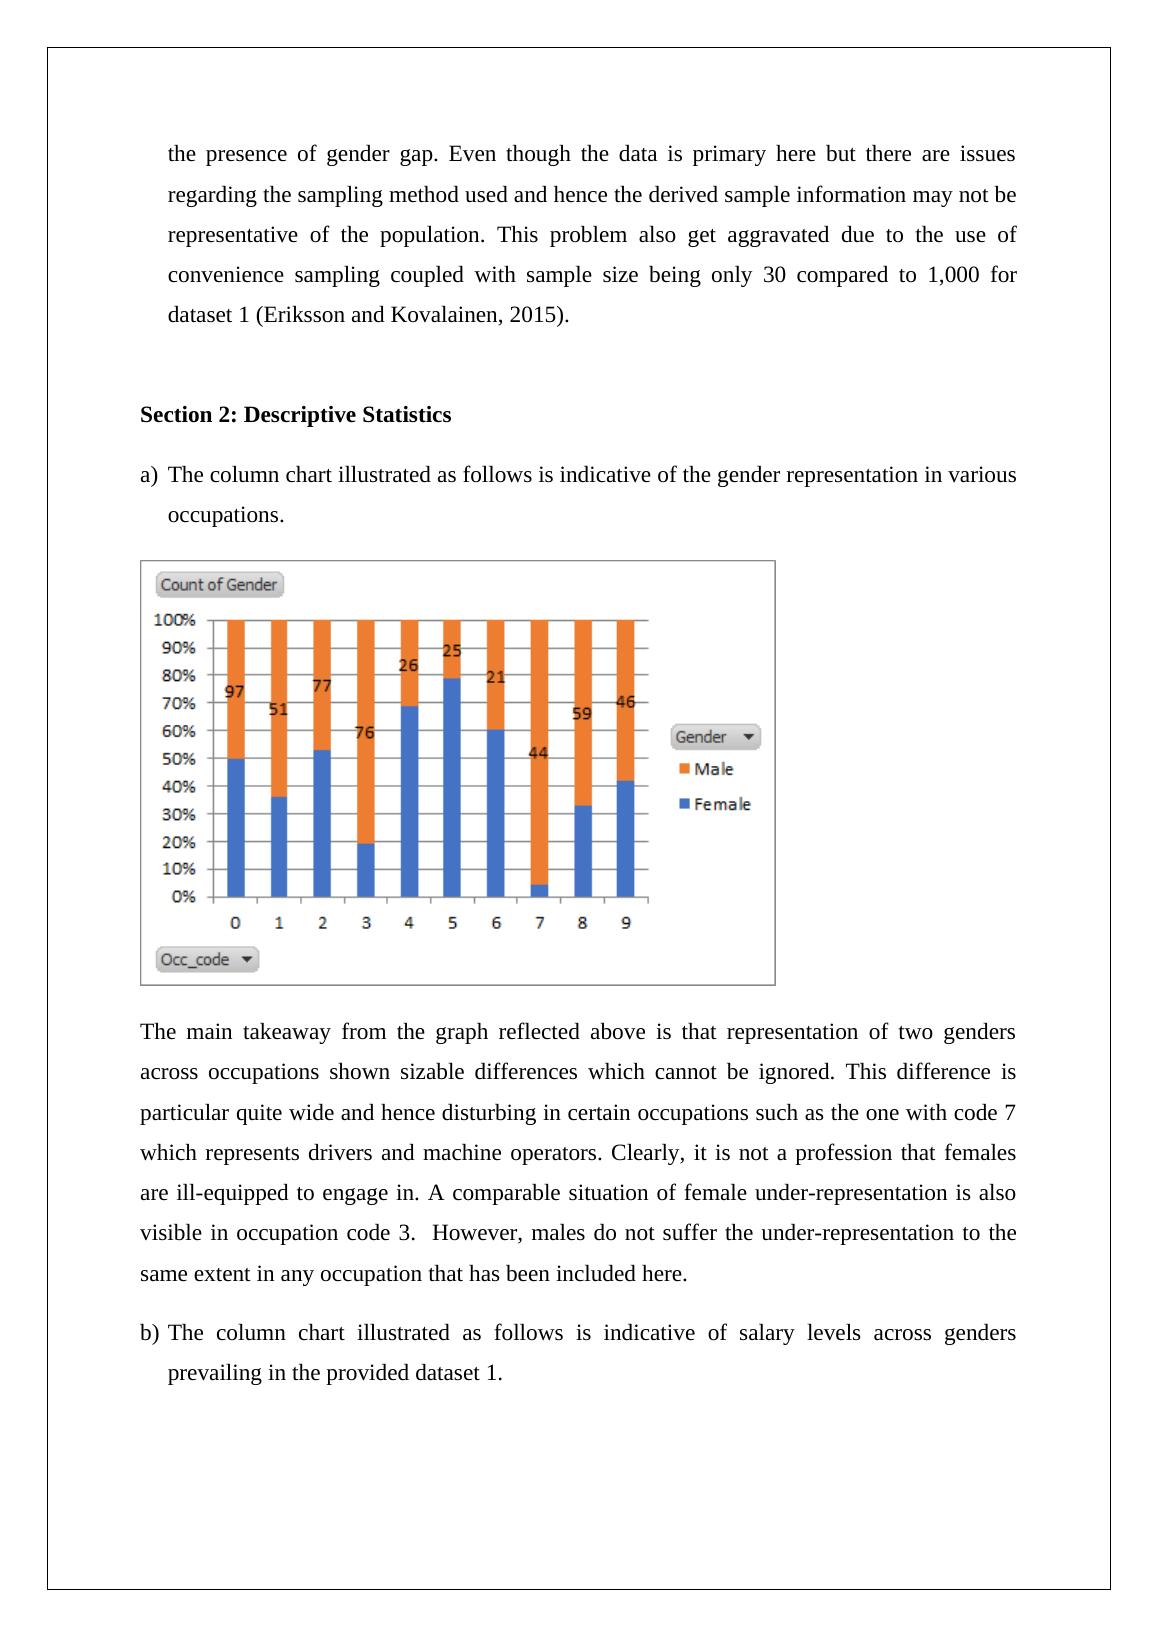
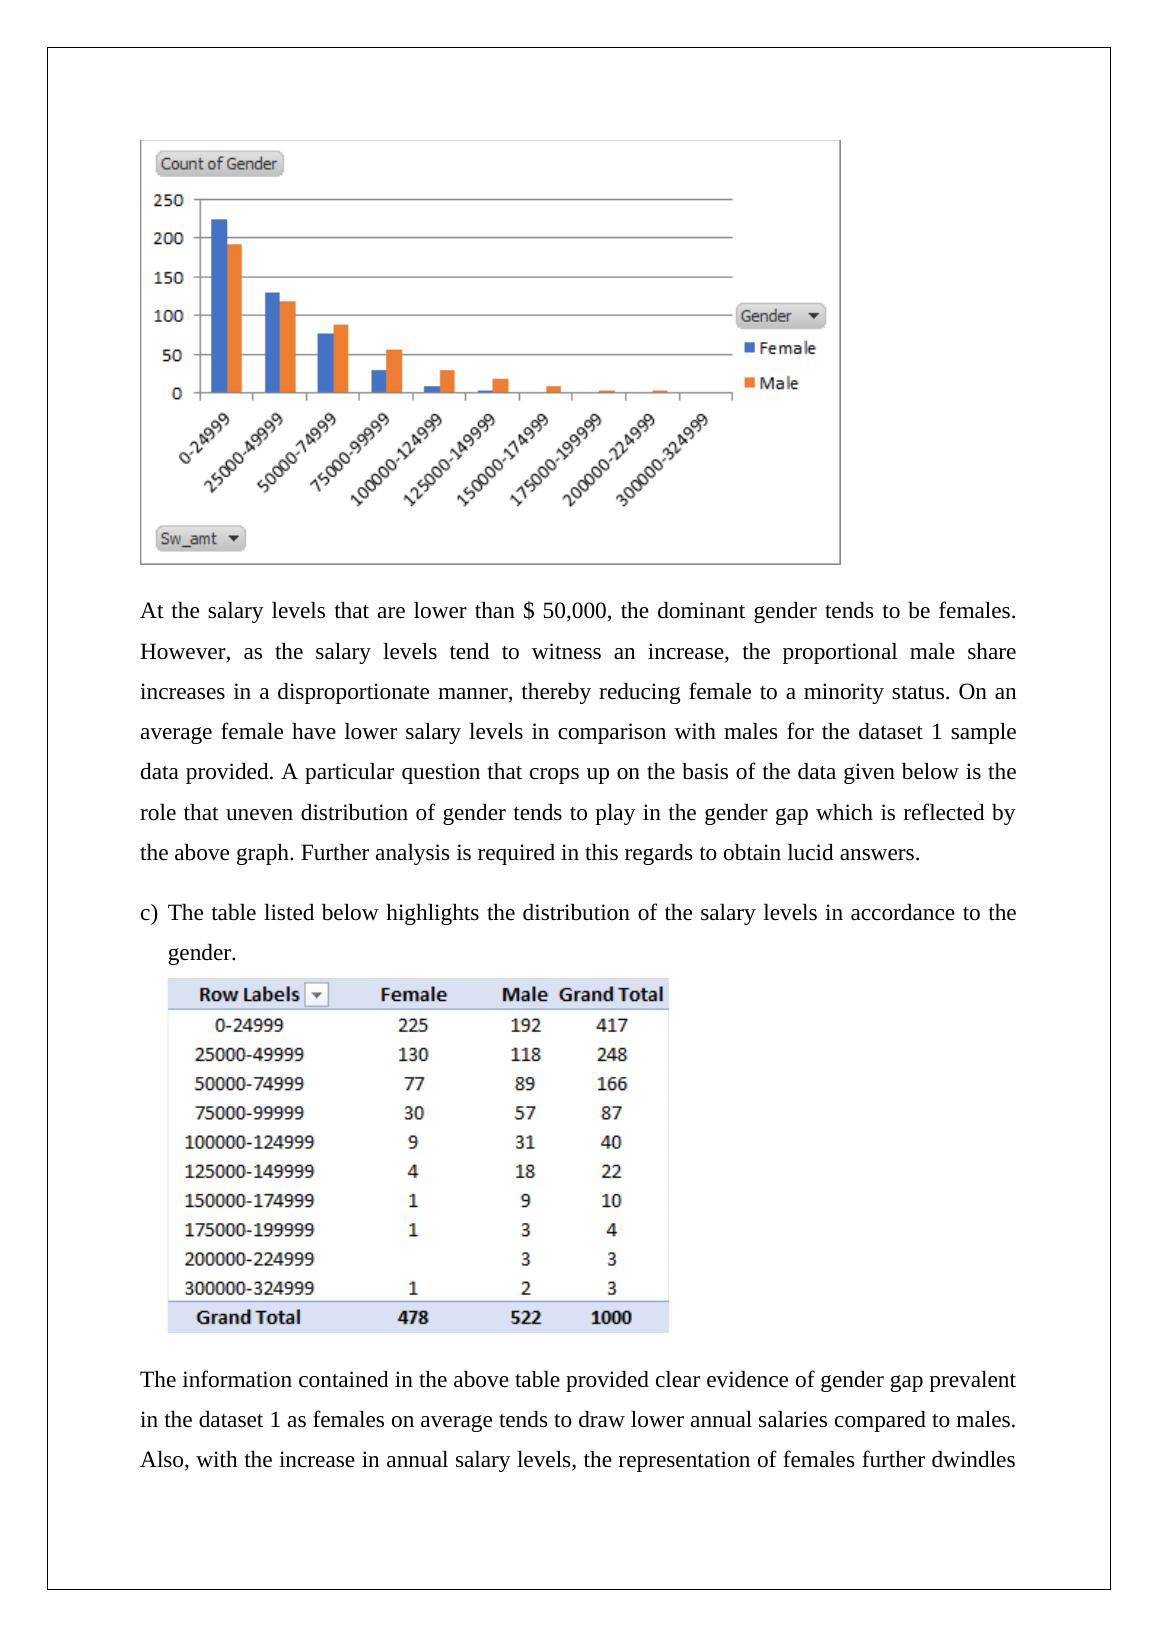
the presence of gender gap. Even though the data is primary here but there are issuesregarding the sampling method used and hence the derived sample information may not berepresentative of the population. This problem also get aggravated due to the use ofconvenience sampling coupled with sample size being only 30 compared to 1,000 fordataset 1 (Eriksson and Kovalainen, 2015).Section 2: Descriptive Statistics a)The column chart illustrated as follows is indicative of the gender representation in variousoccupations.The main takeaway from the graph reflected above is that representation of two gendersacross occupations shown sizable differences which cannot be ignored. This difference isparticular quite wide and hence disturbing in certain occupations such as the one with code 7which represents drivers and machine operators. Clearly, it is not a profession that femalesare ill-equipped to engage in. A comparable situation of female under-representation is alsovisible in occupation code 3. However, males do not suffer the under-representation to thesame extent in any occupation that has been included here.b)The column chart illustrated as follows is indicative of salary levels across gendersprevailing in the provided dataset 1.
At the salary levels that are lower than $ 50,000, the dominant gender tends to be females.However, as the salary levels tend to witness an increase, the proportional male shareincreases in a disproportionate manner, thereby reducing female to a minority status. On anaverage female have lower salary levels in comparison with males for the dataset 1 sampledata provided. A particular question that crops up on the basis of the data given below is therole that uneven distribution of gender tends to play in the gender gap which is reflected bythe above graph. Further analysis is required in this regards to obtain lucid answers.c)The table listed below highlights the distribution of the salary levels in accordance to thegender. The information contained in the above table provided clear evidence of gender gap prevalentin the dataset 1 as females on average tends to draw lower annual salaries compared to males.Also, with the increase in annual salary levels, the representation of females further dwindles
End of preview
Want to access all the pages? Upload your documents or become a member.
Related Documents
Introduction - Statistical Modelinglg...
|12
|2173
|100
Gender Gap in Workforce Managementlg...
|10
|1500
|438
Statistical Modelling - Assignmentlg...
|11
|2197
|61
Gender Pay Gap in Australia: Statistical Modellinglg...
|11
|2190
|404
Statistical Modelling - Assignment PDFlg...
|11
|1983
|83
Statistical Modelling Assignment PDFlg...
|12
|2377
|37